Phoenix, Arizona and Staten Island, New York offer unique living experiences that differ on various parameters. These include crime rates, weather, cost of living, education quality, economic conditions, infrastructure integrity, and cultural richness. The decision to relocate or visit depends on your priorities for these aspects and others such as industry opportunities, real-estate affordability, and healthcare quality. Now, let's delve deeper into these parameters to offer you a detailed comparison.
Phoenix reports a higher overall crime rate than Staten Island which is one of the safer boroughs in New York city. Beware that in Phoenix both major crimes like assault and minor ones like theft are relatively more common. However, tourists usually experience safe visits if they stay in the central and touristic areas. Staten Island, while generally safe, has areas with relatively higher crime rates which tourists usually avoid.
Cost of Living
The cost of living is generally higher in Staten Island than in Phoenix when considering housing, healthcare, groceries, and utilities. The median home cost in Staten Island is higher than Phoenix, and foodstuff and services also cost more due to New York's generally higher prices.
Income Tax
New York has a graduated income tax system that can go as high as 8.82%, in addition to the New York City income tax. Arizona has a lower flat income tax rate which is beneficial to high-income earners.
Property Tax
Property taxes in Phoenix are generally lower than those in Staten Island, effectively making homeownership more affordable in Phoenix.
Sales Tax
Arizona's state sales tax is 5.6%, and Phoenix adds a 2.3% city sales tax, making the combined rate higher than New York state's 4% rate plus Staten Island's 4.5% city tax. Both have additional local sales taxes that could affect the overall cost for certain products.
Income
Type
Phoenix
Staten Island
Estimated median household income
$68,435
$86,054
Estimated per capita income
$35,073
$38,678
Cost of living index (U.S. average is 100)
101.2
164.1
If you make $50,000 in Phoenix, you will have to make $81,077 in Staten Island to maintain the same standard of living.
Geographical Conditions
Phoenix is situated in the Sonoran Desert and boasts a flat landscape, surrounded by mountain ranges. Staten Island is positioned on the southwest part of New York City and is characterized by hilly terrain and a coastal environment.
Geographical information
Type
Phoenix
Staten Island
Land area
474.9 sq. miles
58.5 sq. miles
Population density
3,421.1 people per sq. mile
8,225.7 people per sq. mile
Relative area comparison
Phoenix, AZ Staten Island, NY
Education
Both Phoenix and Staten Island offer quality education but differ in their focus areas. Staten Island's education system is centered around holistic student development through extracurricular activities, while Phoenix prioritizes academic achievement and workforce readiness. Both provide ample choices for high-quality public, private, and college education.
Phoenix's economy thrives across diverse industries like technology, healthcare, and finance while Staten Island is anchored by sectors like healthcare, retail, and education. Phoenix has been experiencing significant job growth, particularly in the tech industry. However, Staten Island offers close proximity to the vast job market of New York City.
Biggest Employers
Phoenix's largest employers include Banner Health, Wells Fargo, and Amazon. Yet, it's home to several other large companies offering various job opportunities. In contrast, Staten Island's largest employers include Staten Island University Hospital, Richmond University Medical Center, and the City of New York.
In Phoenix (Maricopa County), 43.6% voted for Democrats and 54.3% for Republicans in 2012 Presidential Election. In Staten Island (Richmond County), 50.8% voted for Democrats and 48.3% for Republicans.
Elections
Type
Democrats
Republicans
Other
Year
Phoenix
Staten Island
Phoenix
Staten Island
Phoenix
Staten Island
2020
50.2%
42.2%
48.0%
57.1%
1.8%
0.7%
2016
44.9%
41.0%
47.7%
56.1%
7.5%
2.9%
2012
43.6%
50.8%
54.3%
48.3%
2.1%
0.9%
2008
44.0%
47.8%
54.5%
51.9%
1.5%
0.4%
2004
42.4%
42.8%
57.0%
56.5%
0.6%
0.7%
2000
43.0%
52.1%
53.4%
45.1%
3.6%
2.9%
1996
44.5%
50.5%
47.2%
40.8%
8.2%
8.7%
Breakdown of population affiliated with a religious congregation
Type
Adherents
Congregations
Religion
Phoenix
Staten Island
Phoenix
Staten Island
CATHOLIC CHURCH
13.6%
54.2%
4.3%
20.6%
SOUTHERN BAPTIST CONVENTION
1.9%
0.2%
6.5%
3.5%
EVANGELICAL LUTHERAN CHURCH IN AMERICA
0.8%
0.6%
2.0%
4.0%
LUTHERAN CHURCH
0.5%
0.2%
1.5%
1.5%
SEVENTH DAY ADVENTIST CHURCH
0.4%
0.1%
2.0%
2.5%
EPISCOPAL CHURCH
0.3%
0.4%
1.3%
5.0%
VINEYARD USA
0.3%
0.0%
0.6%
0.0%
AMERICAN BAPTIST CHURCHES IN THE USA
0.2%
0.6%
0.6%
1.0%
MUSLIM ESTIMATE
0.2%
1.7%
1.0%
3.0%
COPTIC ORTHODOX CHURCH
0.0%
0.5%
0.1%
1.0%
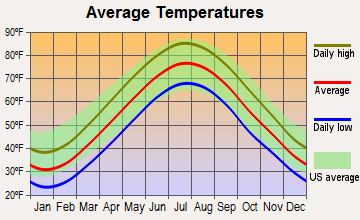
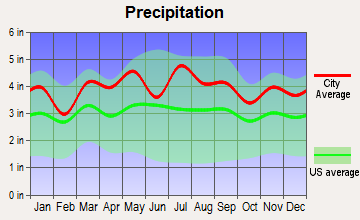
Weather
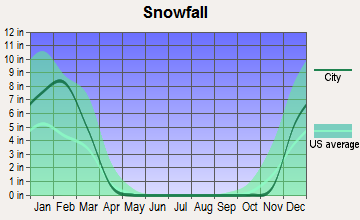
Phoenix experiences a hot desert climate with extremely high temperatures in the summer, mild winters, and low annual precipitation while Staten Island experiences a humid subtropical climate with four distinct seasons. Keep in mind that if you consider relocating changing weather routines and clothes depending on the season may feel more familiar to you on Staten Island.
Weather and climate
Type
Phoenix
Staten Island
Temperature - Average
71.5°F
54.1°F
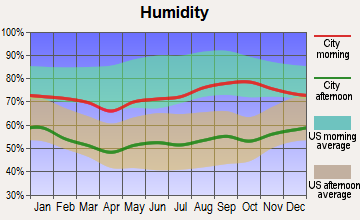
Humidity - Average morning or afternoon humidity
37.5%
67.4%
Humidity - Differences between morning and afternoon humidity
48%
29.9%
Humidity - Maximum monthly morning or afternoon humidity
60%
77%
Humidity - Minimum monthly morning or afternoon humidity
12%
47.2%
Precipitation - Yearly average
8.7 in
47.4 in
Snowfall - Yearly average
0 in
60 in
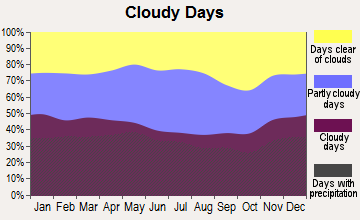
Clouds - Number of days clear of clouds
35.3%
15.8%
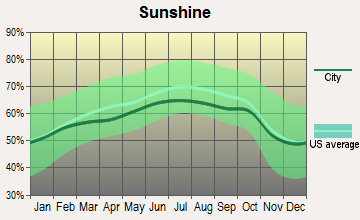
Sunshine amount - Average
92.8%
60.2%
Sunshine amount - Differences during a year
16%
20%
Sunshine amount - Maximum monthly
95%
64%
Sunshine amount - Minimum monthly
79%
44%
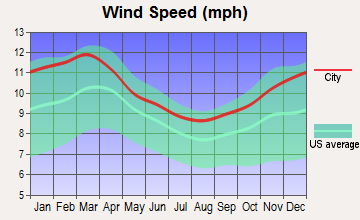
Wind speed - Average
6.6 mph
10.5 mph
Average climate in Phoenix, Arizona
Average climate in Staten Island, New York
Air pollution
Type
AQI
CO
NO2
OZONE
PB
PM10
PM25
SO2
Year
Phoenix
Staten Island
Phoenix
Staten Island
Phoenix
Staten Island
Phoenix
Staten Island
Staten Island
Phoenix
Staten Island
Phoenix
Staten Island
Phoenix
Staten Island
2018
156
94
0.38
0.35
15.2
17.1
28.5
24.1
N/A
N/A
34.8
N/A
8.6
7.9
0.6
0.4
2017
120
98
0.41
0.32
15.9
17.0
28.6
27.0
N/A
N/A
34.9
N/A
7.6
7.6
1.4
0.2
2016
114
94
0.44
0.37
15.8
17.9
27.3
28.5
N/A
N/A
30.6
N/A
7.7
7.7
0.4
0.2
2015
102
102
0.46
0.39
17.6
18.9
27.1
27.3
N/A
N/A
26.2
N/A
7.9
8.6
0.9
0.4
2014
117
97
0.46
0.38
19.6
19.2
27.6
25.6
N/A
N/A
37.0
N/A
8.5
8.3
1.1
0.7
2013
130
99
0.43
0.39
19.9
19.6
27.9
27.8
N/A
N/A
35.3
N/A
8.4
8.5
0.9
0.8
2012
157
102
0.44
0.42
21.2
19.3
28.1
26.9
N/A
N/A
41.9
N/A
8.8
9.2
1.3
1.4
2011
203
108
0.47
0.42
20.0
21.4
28.3
28.1
N/A
N/A
41.3
N/A
9.6
10.2
0.9
2.0
2010
100
114
0.48
0.40
19.9
19.9
26.9
28.7
N/A
N/A
31.2
N/A
8.3
9.4
0.9
1.8
2009
108
105
0.52
0.39
20.1
22.5
25.6
25.3
N/A
N/A
38.2
N/A
N/A
9.5
1.8
2.4
2008
106
111
0.48
0.39
21.4
23.0
26.6
24.3
0.013
N/A
39.6
N/A
N/A
11.3
2.4
3.4
2007
129
123
0.54
0.44
23.5
24.2
25.2
23.3
0.016
N/A
47.6
N/A
N/A
12.0
2.4
4.3
2006
131
117
0.66
0.55
25.3
25.6
24.4
24.7
0.018
N/A
50.8
N/A
N/A
13.1
2.3
5.3
2005
109
112
0.74
0.69
25.9
27.3
22.2
23.3
N/A
N/A
44.6
N/A
N/A
N/A
2.5
7.3
2004
98
109
0.77
0.68
25.5
26.4
23.4
22.2
0.030
N/A
32.8
N/A
N/A
N/A
1.4
6.9
2003
101
112
0.90
0.76
26.8
28.0
23.7
22.1
0.006
N/A
42.6
26.9
N/A
N/A
1.4
7.1
2002
111
125
0.98
0.74
28.7
30.6
23.6
24.7
0.008
N/A
41.8
26.1
N/A
N/A
1.6
6.6
2001
106
124
1.00
0.81
28.6
32.4
22.3
24.9
0.020
N/A
37.8
26.9
N/A
N/A
1.5
7.2
2000
117
116
1.14
0.93
29.9
33.0
24.6
23.1
0.022
N/A
45.6
22.2
N/A
N/A
1.7
7.2
Natural disasters
Type
Phoenix
Staten Island
Tornado activity compared to U.S. average
18.3%
61.3%
Earthquake activity compared to U.S. average
2,597.6%
31.2%
Natural disasters compared to U.S. average
16%
19%
Transportation
Phoenix is heavily reliant on automobile usage for commuting, while Staten Island offers an efficient network of buses, trains, and the famous Staten Island Ferry. Both cities provide ample parking, yet Phoenix residents often face longer commuting times.
Transport
Type
Phoenix
Staten Island
Amtrak stations
3
0
Amtrak stations nearby
3
3
FAA registered aircraft
1
39
FAA registered aircraft manufacturers and dealers
15
2
Means of transportation to work
Type
Phoenix
Staten Island
Bicycle
0.4%
0.2%
Bus
1.8%
19.2%
Carpooled
12.2%
12.1%
Car alone
81.8%
54.3%
Ferryboat
0%
5.3%
Motorcycle
0.4%
0.1%
Railroad
0.2%
0.9%
Subway
0%
2.6%
Taxicab
0.1%
0.4%
Walked
1.4%
2.9%
Average travel time to work
Type
Phoenix
Staten Island
Average
28.6 min
45.3 min
Real Estate
Real estate prices in Phoenix are significantly lower than in Staten Island. Phoenix offers a larger variety of housing styles and sizes. Homeownership affordability is one of the major factors motivating people to move to Phoenix. On the other hand, Staten Island provides a more suburban ambiance when compared to the other New York City boroughs.
Neighborhoods
Phoenix's neighborhoods such as Ahwatukee Foothills and Chandler offer suburban-style living with shopping centers and parks. In contrast, areas like South Shore in Staten Island tend to be more quiet and residential while North Shore is experiencing rapid development with new businesses and real estate projects.
Houses and residents
Type
Phoenix
Staten Island
Houses
644,625
163,993
Average household size (people)
2.8
2.8
Houses occupied
602,039 (93.4%)
156,341 (95.3%)
Houses occupied by owners
354,237 (58.8%)
99,732 (63.8%)
Houses occupied by renters
247,802 (41.2%)
56,609 (36.2%)
Median rent asked for vacant for-rent units
$1,605
$1,320
Median price asked for vacant for-sale houses and condos
$375,817
$369,853
Estimated median house or condo value
$352,600
$605,500
Median number of rooms in apartments
4
3.9
Median number of rooms in houses and condos
6.1
6.1
Renting percentage
42.4%
35.9%
Housing density (houses/condos per square mile)
1,357.5
2,804.3
Household income disparities
43.9%
43.8%
Housing units without a mortgage
3,634 (1.5%)
19,289 (25%)
Housing units with both a second mortgage and home equity loan
12,949 (5.2%)
160 (0.2%)
Housing units with a mortgage
246,434 (98.5%)
57,986 (75%)
Housing units with a home equity loan
624 (0.2%)
5,623 (7.3%)
Housing units with a second mortgage
16,890 (6.8%)
4,499 (5.8%)
Housing units lacking complete kitchen facilities
1.2%
0.6%
Housing units lacking complete plumbing facilities
Self-employed workers in own not incorporated business
48,122
7,611
State government workers
30,385
6,285
Unpaid family workers
1,048
394
Industries and Occupations
In Phoenix, major industry sectors include advanced manufacturing, bioscience, healthcare, and information technology. Staten Island's economy relies heavily on the healthcare, retail trade, and education sectors. It's important to consider the availability of jobs in your field before you relocate.
Both Phoenix and Staten Island have access to excellent healthcare facilities. While Staten Island is part of the extensive healthcare network of New York City, Phoenix hosts several highly-rated hospitals and healthcare systems.
Phoenix is characterized by urban sprawl with wide roads, expansive freeways, and less population density. Its infrastructure growth is aimed at sustaining heavy automobile usage. On the other hand, Staten Island, while less densely populated than other NYC boroughs, has more public infrastructure supporting walking, cycling, and public transit.
Infrastructure
Type
Phoenix
Staten Island
Hospitals
48
25
TV stations
22
30
Bank branches located here
263
104
Bank institutions located here
41
19
Main business address for public companies
41
1
Drinking water stations with no reported violations in the past
2
1
Drinking water stations with reported violations in the past
80
3
Schools
School facilities
Type
Phoenix
Staten Island
Private elementary/middle schools
31
22
Private high schools
16
13
Public elementary/middle schools
0
63
Public high schools
0
16
Colleges/Universities
49
5
Culture and Food
Phoenix offers a vibrant mix of Native American, Spanish, Mexican, and Western cultures resulting in a diverse range of cuisine. Staten Island however is known for Italian cuisine and seafood. Both cities host numerous cultural events and festivals.
Sports Teams
Phoenix is home to franchises in all four major sports leagues including the Phoenix Suns (NBA) and Arizona Cardinals (NFL). Staten Island doesn't have any major league teams but New York City hosts teams in all major sports leagues.


 Phoenix, AZ
 Staten Island, NY