Queens, NY, and Oklahoma City, OK, present two distinctly different lifestyles and environments. The former being one of the five boroughs of the fast-paced, cosmopolitan New York City, and the latter a relaxed, low-cost living city in the heart of the Great Plains. This comparison of the two provides an in-depth look into key factors such as crime and safety, cost of living, education, work, economy, and more that could guide a relocation decision or a visit to either city.
Queens, while safer than other parts of New York City, still has a crime rate somewhat higher than the national average with property crimes being more frequent than violent crimes. Oklahoma City also has a crime rate on par with national averages with property crimes more common than violent crimes. Both cities have invested in community policing efforts, but it's fair to say that you'll need to be more vigilant in Queens than in Oklahoma City due to the denser population.
Cost of Living
The cost of living in Queens is significantly higher than the national average, primarily due to high housing costs. Oklahoma City, in contrast, boasts a cost of living below the national average with housing being quite affordable. Groceries, health care, utilities, and transportation also tend to be cheaper in Oklahoma City as compared to Queens.
Income Tax
New York has a progressive income tax system with rates ranging from 4% to 8.82%, in addition to a city income tax. Oklahoma's state income tax is a flat rate of 5%, and there is no city tax in Oklahoma City.
Property Tax
Property tax rates in New York City, including Queens, are lower than the national average. Oklahoma City has a property tax rate close to the national average.
Sales Tax
New York City and Oklahoma City both have combined state and local sales tax rates above the national average – in Queens it's around 8.875% and Oklahoma City is at about 8.375%.
Income
Type
Queens
Oklahoma City
Estimated median household income
$73,262
$59,214
Estimated per capita income
$34,969
$31,630
Cost of living index (U.S. average is 100)
173.2
85.4
If you make $50,000 in Oklahoma City, you will have to make $101,405 in Queens to maintain the same standard of living.
Geographical Conditions
Queens, located on Long Island, has a diverse geographical layout with urban areas, beaches, and parks. Oklahoma City, located in the Great Plains region, features a mix of urban and rural landscapes with lakes and parks.
Geographical information
Type
Queens
Oklahoma City
Land area
109.2 sq. miles
607 sq. miles
Population density
20,847 people per sq. mile
1,133 people per sq. mile
Relative area comparison
Queens, NY Oklahoma City, OK
Education
Queens is part of the largest school district in the U.S., New York City Department of Education, and also hosts several highly regarded private schools. The city is home to renowned universities like St. John's University and Queens College. Oklahoma City also has a good education system with the Oklahoma City Public Schools being the largest school district. Higher education institutions like the University of Oklahoma, and Oklahoma City University are located here.
The economy of Queens is diverse with sectors such as health care, retail trade, education, and manufacturing playing significant roles. In contrast, Oklahoma City's economy is built around public sector jobs, petroleum products, services, and information technology. While both cities offer several job opportunities, wages tend to be higher in Queens.
Biggest Employers
In Queens, the largest employers include JetBlue Airways, Bulova, Mount Sinai Queens, and various city agencies. In Oklahoma City, major employers include the State of Oklahoma, University of Oklahoma Health Sciences Center, Hobby Lobby Stores, and Continental Resources.
In Queens (Queens County), 79.2% voted for Democrats and 20.0% for Republicans in 2012 Presidential Election. In Oklahoma City (Oklahoma County), 41.7% voted for Democrats and 58.3% for Republicans.
Elections
Type
Democrats
Republicans
Other
Year
Queens
Oklahoma City
Queens
Oklahoma City
Queens
Oklahoma City
2020
72.3%
48.1%
27.0%
49.2%
0.7%
2.7%
2016
75.4%
41.2%
21.8%
51.7%
2.8%
7.1%
2012
79.2%
41.7%
20.0%
58.3%
0.8%
0.0%
2008
75.4%
41.6%
24.3%
58.4%
0.3%
0.0%
2004
71.8%
35.8%
27.5%
64.2%
0.8%
0.0%
2000
75.2%
36.6%
22.0%
62.3%
2.8%
1.1%
1996
72.9%
36.5%
21.1%
54.7%
6.0%
8.8%
Breakdown of population affiliated with a religious congregation
Type
Adherents
Congregations
Religion
Queens
Oklahoma City
Queens
Oklahoma City
CATHOLIC CHURCH
30.4%
8.5%
7.7%
3.0%
MUSLIM ESTIMATE
3.7%
0.3%
4.4%
0.6%
SEVENTH DAY ADVENTIST CHURCH
0.6%
0.4%
3.4%
1.5%
AMERICAN BAPTIST CHURCHES IN THE USA
0.5%
0.3%
2.5%
0.1%
EPISCOPAL CHURCH
0.4%
0.7%
2.1%
1.3%
EVANGELICAL LUTHERAN CHURCH IN AMERICA
0.3%
0.2%
2.6%
0.9%
SOUTHERN BAPTIST CONVENTION
0.2%
20.7%
3.8%
20.0%
LUTHERAN CHURCH
0.1%
0.5%
1.8%
1.0%
INTERNA PENTECO HOLINESS CHURCH
0.0%
0.7%
0.2%
2.9%
Weather
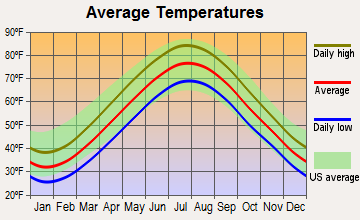
Queens experiences a humid subtropical climate with hot, humid summers and chilly, damp winters. Oklahoma City, on the other hand, experiences a temperate humid subtropical climate with hot, humid summers and mild winters. Additionally, Oklahoma City is situated in the notorious "Tornado Alley," thus prone to extreme weather events such as tornadoes and severe thunderstorms.
Weather and climate
Type
Queens
Oklahoma City
Temperature - Average
54.6°F
60.1°F
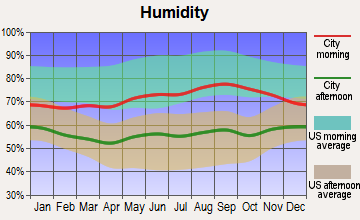
Humidity - Average morning or afternoon humidity
68.5%
73.1%
Humidity - Differences between morning and afternoon humidity
25.1%
35%
Humidity - Maximum monthly morning or afternoon humidity
76.3%
85%
Humidity - Minimum monthly morning or afternoon humidity
51.1%
50%
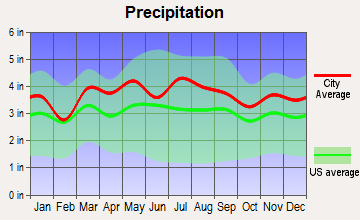
Precipitation - Yearly average
44.5 in
35.7 in
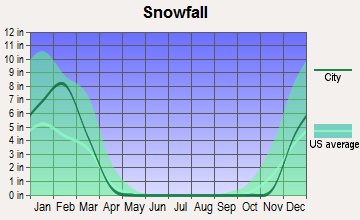
Snowfall - Yearly average
52.7 in
17.2 in
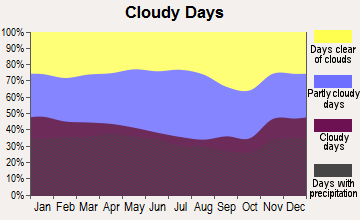
Clouds - Number of days clear of clouds
16.3%
23.1%
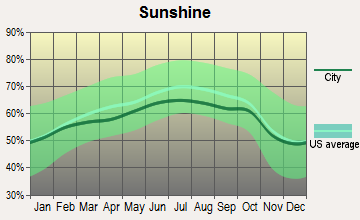
Sunshine amount - Average
60.2%
72.1%
Sunshine amount - Differences during a year
20%
21%
Sunshine amount - Maximum monthly
64%
79%
Sunshine amount - Minimum monthly
44%
58%
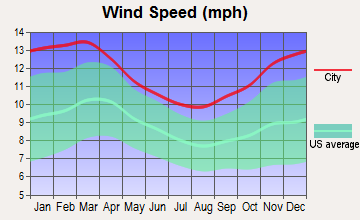
Wind speed - Average
11.6 mph
12.3 mph
Average climate in Queens, New York
Average climate in Oklahoma City, Oklahoma
Air pollution
Type
AQI
CO
NO2
OZONE
PB
PM10
PM25
SO2
Year
Queens
Oklahoma City
Queens
Oklahoma City
Queens
Oklahoma City
Queens
Oklahoma City
Queens
Oklahoma City
Queens
Oklahoma City
Queens
Oklahoma City
Queens
Oklahoma City
2018
97
85
0.26
0.29
14.7
6.6
25.4
31.9
N/A
0.002
N/A
21.3
6.4
9.6
0.4
0.0
2017
98
82
0.23
0.32
15.4
6.7
25.8
33.0
N/A
0.002
N/A
20.7
6.4
8.9
0.5
0.0
2016
97
72
0.24
0.29
16.0
6.6
25.5
31.9
N/A
0.002
N/A
19.4
6.7
8.5
0.6
0.2
2015
104
76
0.26
0.24
17.4
7.0
24.1
31.5
N/A
0.002
N/A
19.1
7.9
7.8
0.8
0.5
2014
99
84
0.25
0.15
17.0
7.1
24.3
32.4
N/A
0.002
N/A
N/A
7.8
8.7
1.1
0.1
2013
101
84
0.23
0.14
17.7
8.6
25.8
32.8
N/A
0.002
N/A
N/A
8.7
9.3
1.2
0.2
2012
105
97
0.26
0.13
17.6
9.4
25.8
34.0
N/A
0.007
N/A
N/A
9.1
7.9
1.8
0.3
2011
112
107
0.27
0.24
20.4
9.9
24.2
36.3
N/A
0.003
N/A
N/A
10.6
9.9
2.7
0.8
2010
112
81
0.35
0.30
19.4
8.8
23.6
31.7
N/A
0.002
N/A
N/A
10.3
9.8
2.9
0.7
2009
107
82
0.24
0.52
21.0
8.1
21.0
31.9
N/A
0.002
N/A
N/A
9.7
10.2
3.4
0.7
2008
113
78
0.44
0.51
22.6
9.8
22.0
31.0
0.013
N/A
N/A
N/A
11.0
N/A
4.1
1.4
2007
121
81
0.46
0.44
22.9
10.2
20.2
29.4
0.016
N/A
N/A
N/A
11.6
N/A
4.9
2.0
2006
120
95
0.46
0.43
23.5
10.1
20.3
33.7
0.018
N/A
N/A
N/A
12.7
N/A
5.3
1.2
2005
110
88
0.54
0.38
25.5
11.6
19.7
31.0
N/A
N/A
N/A
N/A
N/A
N/A
6.7
1.3
2004
107
75
0.55
0.46
25.1
10.5
18.2
28.6
0.030
N/A
N/A
N/A
N/A
N/A
5.8
0.6
2003
110
87
0.63
0.42
26.9
10.9
18.9
30.8
0.022
N/A
26.9
N/A
N/A
N/A
7.0
N/A
2002
124
91
0.58
0.35
27.9
14.3
19.2
29.0
0.008
N/A
25.7
N/A
N/A
N/A
6.5
2.0
2001
124
87
0.60
0.69
28.8
13.1
19.3
31.0
0.020
N/A
24.5
N/A
N/A
N/A
7.8
1.8
2000
115
89
0.67
0.66
28.4
13.4
17.6
29.5
0.022
N/A
22.2
N/A
N/A
N/A
7.3
3.0
Natural disasters
Type
Queens
Oklahoma City
Tornado activity compared to U.S. average
54%
353.4%
Earthquake activity compared to U.S. average
30.6%
938.9%
Natural disasters compared to U.S. average
19%
43%
Transportation
Queens has a vast public transit system, part of the Metropolitan Transportation Authority, with extensive subway and bus coverage. Commuters in Oklahoma City, by contrast, primarily rely on cars, with public transportation options being less extensive.
Transport
Type
Queens
Oklahoma City
Amtrak stations
2
1
Amtrak stations nearby
3
2
FAA registered aircraft
4
0
Means of transportation to work
Type
Queens
Oklahoma City
Bicycle
0.3%
0.2%
Bus
10%
0.3%
Carpooled
10.2%
8.6%
Car alone
34.3%
87.6%
Railroad
2.2%
0%
Streetcar
0.2%
0%
Subway
34.3%
0%
Taxicab
0.7%
0.2%
Walked
5.7%
1.4%
Average travel time to work
Type
Queens
Oklahoma City
Average
44 min
25.6 min
Real Estate
Real estate in Queens tends to be expensive with a mix of condos, apartments, and single-family homes. Oklahoma City's real estate market is more affordable and typically offers larger lot sizes and more single-family homes.
Neighborhoods
Queens is known for its diverse neighborhoods including Flushing, Astoria, and Jamaica. Oklahoma City also has a variety of neighborhoods with different characteristics, from the lively, artsy Paseo District to the upscale Nichols Hills.
Houses and residents
Type
Queens
Oklahoma City
Houses
817,250
302,241
Average household size (people)
2.8
2.5
Houses occupied
782,664 (95.8%)
275,285 (91.1%)
Houses occupied by owners
334,894 (42.8%)
164,470 (59.7%)
Houses occupied by renters
447,770 (57.2%)
110,815 (40.3%)
Median rent asked for vacant for-rent units
$1,666
$1,241
Median price asked for vacant for-sale houses and condos
$615,765
$278,299
Estimated median house or condo value
$642,000
$190,900
Median number of rooms in apartments
3.7
4.3
Median number of rooms in houses and condos
5.4
6.2
Renting percentage
57%
40.3%
Housing density (houses/condos per square mile)
7,481.6
497.9
Household income disparities
44.9%
44.3%
Housing units without a mortgage
64,617 (34.6%)
1,238 (1.2%)
Housing units with both a second mortgage and home equity loan
311 (0.2%)
4,838 (4.7%)
Housing units with a mortgage
122,366 (65.4%)
100,798 (98.8%)
Housing units with a home equity loan
9,927 (5.3%)
123 (0.1%)
Housing units with a second mortgage
10,707 (5.7%)
5,921 (5.8%)
Housing units lacking complete kitchen facilities
1%
3.1%
Housing units lacking complete plumbing facilities
Self-employed workers in own not incorporated business
48,383
20,964
State government workers
21,536
17,132
Unpaid family workers
2,382
555
Industries and Occupations
Queens' thriving industries include health care, social assistance, retail, and educational services. Oklahoma City, with its economy centered on oil, natural gas, and petroleum products, has a significant presence of energy, aerospace, biotechnology, and logistics industries.
Queens offers several prestigious hospitals like Elmhurst Hospital Center and NewYork-Presbyterian Queens. Oklahoma City houses some of the state's best hospitals, such as INTEGRIS Baptist Medical Center and OU Medical Center.
Health (county statistics)
Type
Queens
Oklahoma City
General health status score of residents in this county from 1 (poor) to 5 (excellent)
Queens boasts a well-developed infrastructure characteristic of a major city. It's serviced by an extensive subway and bus system. Oklahoma City has a more expansive layout but lacks the public transportation infrastructure Queens has, making a car more necessary for day-to-day life.
Infrastructure
Type
Queens
Oklahoma City
Hospitals
1
61
TV stations
30
20
Schools
School facilities
Type
Queens
Oklahoma City
Private elementary/middle schools
8
19
Private high schools
1
10
Public elementary/middle schools
6
126
Public high schools
2
25
Colleges/Universities
1
22
Culture and Food
Queens boasts a diverse culture and food scene with influences from around the world, particularly Latin America and Asia. Oklahoma City also offers a vibrant cultural scene, including cowboy culture, Native American history, and a burgeoning food and craft beer scene.
Sports Teams
As part of New York City, Queens is near many professional sports teams including the Yankees (baseball), Knicks (basketball), and Giants (football). Oklahoma City is home to the Oklahoma City Thunder, a nationally recognized NBA team.

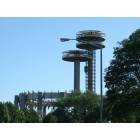


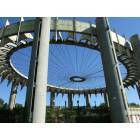


 Queens, NY
 Oklahoma City, OK