Queens, NY, and Philadelphia, PA, are two east coast cities with unique experiences. Comparing them involves analyzing a plethora of factors including crime, cost of living, education, the local economy, and much more. Both cities offer their own dynamic character, art scene, diverse populations, and rich history, but they do vary greatly in other aspects. Whether you're looking to relocate or just visiting, understanding these differences can provide a clearer picture of what to expect in each city.
In general, Philadelphia tends to have a higher crime rate than Queens, though it varies by neighborhood in both locations. Both cities, however, have experienced a decrease in crime over the past few years. Despite this, safety can depend greatly on the specific neighborhoods, with those in Queens generally considered safer than their counterparts in Philadelphia. However, they both have effective police departments working to ensure the safety of their residents and visitors.
Cost of Living
The cost of living in Queens tends to be higher than in Philadelphia due to higher housing costs and overall expenses. For instance, median home prices and rental rates in Queens are significantly higher than Philadelphia. Everyday expenses, including groceries, transportation, and healthcare, are generally costlier in Queens as well.
Income Tax
In terms of income tax, residents in Queens pay New York state income tax, which varies from 4% to 8.82% based on income level, in addition to a city income tax ranging from 3.078% to 3.876%. Philadelphia residents also pay city (3.8712%) and state (3.07%) income taxes.
Property Tax
Property tax rates in Queens vary significantly based on the type and value of the property but on average fall around 0.90%. Philadelphia, on the other hand, has a flat property tax rate of 1.3998%.
Sales Tax
New York City has a higher sales tax rate compared to Philadelphia. The sales tax rate in Queens is 8.875%, which includes the New York state sales tax of 4.5%, the Queens city sales tax of 4.5%, and a 0.375% district tax. Philadelphia has a sales tax of 8%.
Income
Type
Queens
Philadelphia
Estimated median household income
$73,262
$52,899
Estimated per capita income
$34,969
$32,707
Cost of living index (U.S. average is 100)
173.2
105.4
If you make $50,000 in Philadelphia, you will have to make $82,163 in Queens to maintain the same standard of living.
Geographical Conditions
Queens is situated on Long Island and is the easternmost of the five boroughs of New York City. It's noted for its proximity to two major airports, beaches, and Flushing Meadows–Corona Park. Philadelphia is located in the Mid-Atlantic region and is characterized by flat terrain with gentle rolling hills. It also enjoys close proximity to the Delaware River and the Schuylkill River.
Geographical information
Type
Queens
Philadelphia
Land area
109.2 sq. miles
135.1 sq. miles
Population density
20,847 people per sq. mile
11,668 people per sq. mile
Relative area comparison
Queens, NY Philadelphia, PA
Education
Both cities have diverse offerings when it comes to education. Philadelphia is home to prestigious institutions like the University of Pennsylvania, while Queens has notable schools like St. John's University. Overall, the public school performance in Queens tends to be better than Philadelphia. Both cities have a wide range of private and public school options for K to 12 education.
While both cities have diverse economies, there are differences in their dominant industries. Queens has a strong presence in the service industry, including tourism, retail, and food service, and is home to several significant corporate headquarters. Meanwhile, Philadelphia's economy leans more towards healthcare, education, and professional services. The unemployment rate typically fluctuates without a consistent pattern between the two cities, but overall Queens tends to have a higher cost of living and wage average.
Biggest Employers
The biggest employer in Queens is Delta Air Lines, consistent with the area's association with the aviation industry due to the presence of two major airports - JFK and LaGuardia. In contrast, in Philadelphia, the University of Pennsylvania and its Health System are the largest employers, highlighting the city's emphasis on educational and healthcare services.
In Queens (Queens County), 79.2% voted for Democrats and 20.0% for Republicans in 2012 Presidential Election. In Philadelphia (Philadelphia County), 85.2% voted for Democrats and 14.0% for Republicans.
Elections
Type
Democrats
Republicans
Other
Year
Queens
Philadelphia
Queens
Philadelphia
Queens
Philadelphia
2020
72.3%
81.2%
27.0%
17.9%
0.7%
0.9%
2016
75.4%
82.3%
21.8%
15.3%
2.8%
2.4%
2012
79.2%
85.2%
20.0%
14.0%
0.8%
0.8%
2008
75.4%
83.2%
24.3%
16.4%
0.3%
0.4%
2004
71.8%
80.6%
27.5%
19.4%
0.8%
0.0%
2000
75.2%
80.4%
22.0%
18.1%
2.8%
1.5%
1996
72.9%
77.4%
21.1%
16.0%
6.0%
6.6%
Breakdown of population affiliated with a religious congregation
Type
Adherents
Congregations
Religion
Queens
Philadelphia
Queens
Philadelphia
CATHOLIC CHURCH
30.4%
24.8%
7.7%
8.8%
MUSLIM ESTIMATE
3.7%
2.6%
4.4%
3.1%
SEVENTH DAY ADVENTIST CHURCH
0.6%
0.4%
3.4%
1.7%
AMERICAN BAPTIST CHURCHES IN THE USA
0.5%
3.8%
2.5%
6.7%
EPISCOPAL CHURCH
0.4%
0.8%
2.1%
3.8%
EVANGELICAL LUTHERAN CHURCH IN AMERICA
0.3%
0.6%
2.6%
3.1%
SOUTHERN BAPTIST CONVENTION
0.2%
2.2%
3.8%
9.9%
PRESBYTERIAN CHURCH IN AMERICA
0.1%
0.4%
0.8%
1.4%
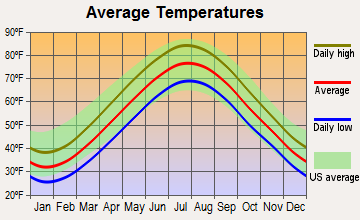
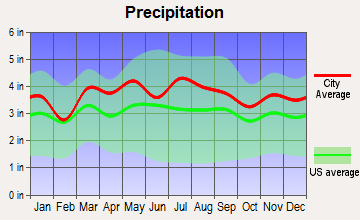
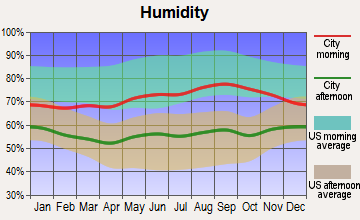
Weather
Weather in both cities is characterized by a humid subtropical climate with hot summers and cold winters. Philadelphia experiences a slightly warmer weather pattern than Queens throughout the year due to its slightly southern position. Queens is typically colder during the winter months because it's located further north, closer to the Atlantic Ocean which can result in more snow during winter.
Weather and climate
Type
Queens
Philadelphia
Temperature - Average
54.6°F
54.8°F
Humidity - Average morning or afternoon humidity
68.5%
69.9%
Humidity - Differences between morning and afternoon humidity
25.1%
34%
Humidity - Maximum monthly morning or afternoon humidity
76.3%
82%
Humidity - Minimum monthly morning or afternoon humidity
51.1%
48%
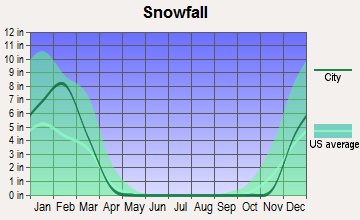
Precipitation - Yearly average
44.5 in
45.7 in
Snowfall - Yearly average
52.7 in
45.1 in
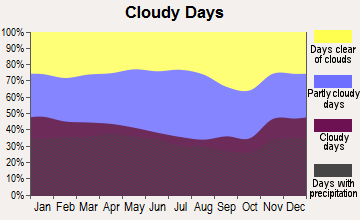
Clouds - Number of days clear of clouds
16.3%
15.4%
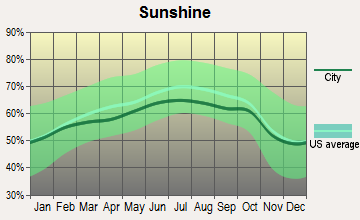
Sunshine amount - Average
60.2%
59.8%
Sunshine amount - Differences during a year
20%
18%
Sunshine amount - Maximum monthly
64%
63%
Sunshine amount - Minimum monthly
44%
45%
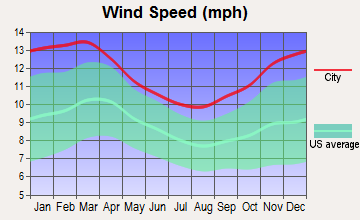
Wind speed - Average
11.6 mph
10 mph
Average climate in Queens, New York
Average climate in Philadelphia, Pennsylvania
Air pollution
Type
AQI
CO
NO2
OZONE
PB
PM10
PM25
SO2
Year
Queens
Philadelphia
Queens
Philadelphia
Queens
Philadelphia
Queens
Philadelphia
Queens
Philadelphia
Queens
Philadelphia
Queens
Philadelphia
Queens
Philadelphia
2018
97
99
0.26
0.37
14.7
10.7
25.4
24.3
N/A
N/A
N/A
17.2
6.4
9.2
0.4
0.9
2017
98
105
0.23
0.32
15.4
11.0
25.8
25.3
N/A
0.004
N/A
22.3
6.4
8.9
0.5
1.0
2016
97
99
0.24
0.30
16.0
13.6
25.5
25.1
N/A
0.007
N/A
23.2
6.7
9.5
0.6
1.4
2015
104
110
0.26
0.34
17.4
15.8
24.1
22.6
N/A
0.007
N/A
23.9
7.9
10.5
0.8
1.8
2014
99
105
0.25
0.34
17.0
16.8
24.3
23.1
N/A
0.027
N/A
23.0
7.8
11.7
1.1
2.2
2013
101
105
0.23
0.27
17.7
16.7
25.8
22.5
N/A
0.029
N/A
31.0
8.7
10.5
1.2
1.5
2012
105
111
0.26
0.29
17.6
17.8
25.8
23.0
N/A
0.040
N/A
14.6
9.1
11.7
1.8
1.5
2011
112
113
0.27
0.28
20.4
19.9
24.2
24.3
N/A
0.039
N/A
16.9
10.6
9.8
2.7
1.9
2010
112
116
0.35
0.30
19.4
20.1
23.6
23.0
N/A
0.009
N/A
21.7
10.3
12.2
2.9
2.6
2009
107
95
0.24
0.32
21.0
18.9
21.0
19.7
N/A
0.011
N/A
18.0
9.7
11.9
3.4
2.9
2008
113
112
0.44
0.30
22.6
19.8
22.0
19.1
0.013
0.010
N/A
16.8
11.0
13.9
4.1
3.8
2007
121
128
0.46
0.42
22.9
21.6
20.2
23.3
0.016
0.019
N/A
17.5
11.6
12.3
4.9
4.2
2006
120
112
0.46
0.52
23.5
21.4
20.3
22.5
0.018
0.016
N/A
18.3
12.7
13.1
5.3
4.2
2005
110
108
0.54
0.58
25.5
24.4
19.7
20.8
N/A
0.018
N/A
19.7
N/A
N/A
6.7
5.0
2004
107
102
0.55
0.58
25.1
24.1
18.2
18.9
0.030
0.023
N/A
19.1
N/A
N/A
5.8
5.2
2003
110
103
0.63
0.62
26.9
23.8
18.9
19.7
0.022
0.034
26.9
19.6
N/A
N/A
7.0
5.4
2002
124
128
0.58
0.56
27.9
26.8
19.2
21.2
0.008
0.035
25.7
18.3
N/A
N/A
6.5
4.9
2001
124
119
0.60
0.63
28.8
27.9
19.3
20.0
0.020
0.014
24.5
20.6
N/A
N/A
7.8
5.6
2000
115
111
0.67
0.68
28.4
26.7
17.6
19.0
0.022
0.034
22.2
N/A
N/A
N/A
7.3
5.5
Natural disasters
Type
Queens
Philadelphia
Tornado activity compared to U.S. average
54%
96.6%
Earthquake activity compared to U.S. average
30.6%
34.4%
Natural disasters compared to U.S. average
19%
22%
Transportation
When it comes to public transportation and commuting, Queens, as part of the larger New York City metropolitan area, has an edge with its extensive subway system, buses, and commuter trains. Philadelphia also has solid public transit with its SEPTA system, but it is not as extensive as New York City's. Both cities also have bike-sharing programs and are navigable by car, although parking can be pricey, especially in Queens.
Transport
Type
Queens
Philadelphia
Amtrak stations
2
2
Amtrak stations nearby
3
3
FAA registered aircraft
4
347
FAA registered aircraft manufacturers and dealers
0
2
Means of transportation to work
Type
Queens
Philadelphia
Bicycle
0.3%
2%
Bus
10%
11.7%
Carpooled
10.2%
8.7%
Car alone
34.3%
60%
Railroad
2.2%
0.7%
Streetcar
0.2%
4.2%
Subway
34.3%
2.8%
Taxicab
0.7%
0.2%
Walked
5.7%
7.8%
Average travel time to work
Type
Queens
Philadelphia
Average
44 min
34.3 min
Real Estate
In terms of real estate, prices in Queens are typically higher than those in Philadelphia. In Queens, you'll find a variety of housing options from high-rise apartments to single-family homes. Philadelphia also offers a mix of housing styles but with a more historical leaning, including many row houses and beautiful brick homes.
Neighborhoods
Queens, with neighborhoods like Astoria and Flushing, is known for its diversity and cultural blend. These neighborhoods offer a rich mix of ethnicities, cuisines, and cultural experiences. Philadelphia, on the other hand, offers neighborhoods like Rittenhouse Square and Old City with historical charm. Each city has neighborhoods that cater to a variety of tastes and lifestyles, from quiet suburban feel to bustling urban life.
Houses and residents
Type
Queens
Philadelphia
Houses
817,250
733,015
Average household size (people)
2.8
2.5
Houses occupied
782,664 (95.8%)
660,921 (90.2%)
Houses occupied by owners
334,894 (42.8%)
348,935 (52.8%)
Houses occupied by renters
447,770 (57.2%)
311,986 (47.2%)
Median rent asked for vacant for-rent units
$1,666
$1,301
Median price asked for vacant for-sale houses and condos
$615,765
$260,453
Estimated median house or condo value
$642,000
$220,700
Median number of rooms in apartments
3.7
4.2
Median number of rooms in houses and condos
5.4
6.2
Renting percentage
57%
45.9%
Housing density (houses/condos per square mile)
7,481.6
5,426.1
Household income disparities
44.9%
49.5%
Housing units without a mortgage
64,617 (34.6%)
8,484 (4%)
Housing units with both a second mortgage and home equity loan
311 (0.2%)
18,029 (8.5%)
Housing units with a mortgage
122,366 (65.4%)
202,880 (96%)
Housing units with a home equity loan
9,927 (5.3%)
1,280 (0.6%)
Housing units with a second mortgage
10,707 (5.7%)
22,966 (10.9%)
Housing units lacking complete kitchen facilities
1%
3.7%
Housing units lacking complete plumbing facilities
Self-employed workers in own not incorporated business
48,383
29,270
State government workers
21,536
16,901
Unpaid family workers
2,382
570
Industries and Occupations
In Queens, the leading industries are healthcare and social assistance, retail trade, and educational services. This is also reflected in the most common occupations, such as management positions and office and administrative support roles. Philadelphia’s economy is led by sectors such as healthcare, education, and professional and business services. The major occupations here are also in management and administrative roles, with a significant presence of healthcare practitioners and educators.
Both Queens and Philadelphia offer excellent health care options. Queens is part of New York City's extensive healthcare systems with world-renowned hospitals like Mount Sinai. Philadelphia is also a significant hub for healthcare with renowned institutions like the University of Pennsylvania Hospital.
Health (county statistics)
Type
Queens
Philadelphia
General health status score of residents in this county from 1 (poor) to 5 (excellent)
Both Queens and Philadelphia have robust infrastructures. Queens, given its location within the larger New York City, benefits from impressive skyscrapers, diverse architecture, and extensive public transportation. Philadelphia’s infrastructure includes a mix of colonial-era buildings and modern developments but may not be as densely populated or as extensive in public transportation options as Queens.
Infrastructure
Type
Queens
Philadelphia
Hospitals
1
91
TV stations
30
24
Schools
School facilities
Type
Queens
Philadelphia
Private elementary/middle schools
8
115
Private high schools
1
42
Public elementary/middle schools
6
209
Public high schools
2
97
Colleges/Universities
1
43
Culture and Food
There’s no shortage of culture and food in either city. Queens is recognized for its cultural diversity, which is reflected in its food scene, offering everything from authentic Greek to Thai cuisine. Philadelphia is famous for its historic sites, arts scene, and of course, Philly cheesesteaks.
Sports Teams
Both cities have passionate sports cultures. Queens is home to the New York Mets (MLB), playing at Citi Field. Philadelphia is known for its die-hard sports fans and is home to the Philadelphia Eagles (NFL), Philadelphia 76ers (NBA), Philadelphia Flyers (NHL), and the Philadelphia Phillies (MLB).
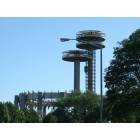


 Queens, NY
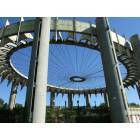
 Philadelphia, PA