The two Southern California cities of Riverside and Rancho Cucamonga each have unique characteristics. Riverside, a more cultural city with a vibrant art scene, higher education institutions, and historic landmarks, contrasts with Rancho Cucamonga, which offers a more suburban appeal with new housing developments, wineries, and shopping centers. Below is a comparative analysis of various aspects of these cities to help in relocating decisions or creating tourist itineraries for those who are thinking of visiting.
Distance between
Riverside, CA and
Rancho Cucamonga, CA : 16.0 miles
Riverside's population is larger by 81%. Its population has grown by 62,095 people (24.3%) since 2000. The population of Rancho Cucamonga has grown by 47,399 people (37.1%) during that time.
In terms of crime and safety, Riverside demonstrates higher crime rates, according to the National Crime Statistics. It’s crucial to note, however, that certain areas within Riverside are safer than others. The same applies to Rancho Cucamonga which has a considerably lower crime rate than Riverside but still higher than the national average. Both cities' police departments actively engage in community policing strategies to manage crime rates.
City-data.com crime index counts serious crimes and violent crime more heavily. It adjusts for the number of visitors and daily workers commuting into cities. (higher means more crime, U.S. average = 301.1)
City-data.com crime index counts serious crimes and violent crime more heavily. It adjusts for the number of visitors and daily workers commuting into cities. (higher means more crime, U.S. average = 301.1)
Sex Offenders
According to our data, there are 616 registered sex offenders living in Riverside and 106 registered sex offenders living in . The ratio of residents to sex offenders in Riverside is 527 to 1; the ratio in Rancho Cucamonga is 1,665 to 1. The number of registered sex offenders compared to the number of residents is much larger in Riverside than that in Rancho Cucamonga.
Cost of Living
The cost of living in both cities trends higher than the US average, mainly due to California's overall high cost of living. However, Rancho Cucamonga tends to be slightly more expensive, particularly with housing prices, compared to Riverside.
Income Tax
California's state income tax, which affects both Riverside and Rancho Cucamonga, ranges from 1% to 13.3% based on income levels. These rates are higher than most other states.
Property Tax
The median property tax rate in Riverside and Rancho Cucamonga is approximately 0.77% and 0.78% of the property's fair market value, respectively. This rate is lower than the national average of 1.08%.
Sales Tax
The sales tax in both Riverside and Rancho Cucamonga is the same—8.75%—which is higher than the national median of 6.5%.
Income
Type
Riverside
Rancho Cucamonga
Estimated median household income
$76,558
$83,850
Estimated per capita income
$29,013
$37,696
Cost of living index (U.S. average is 100)
83
84
If you make $50,000 in Riverside, you will have to make $50,602 in Rancho Cucamonga to maintain the same standard of living.
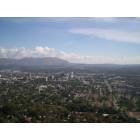
Geographical Conditions
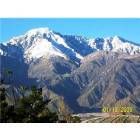
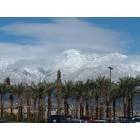
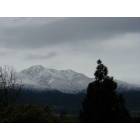
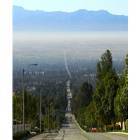
Riverside is nestled beside the Santa Ana River and surrounded by small mountain ranges. Rancho Cucamonga sits at the foot of the San Gabriel Mountains and offers numerous outdoor recreational activities. Both cities feature attractive landscapes for outdoor enthusiasts.
Education-wise, Riverside houses several higher education establishments, including the University of California, Riverside, and Riverside Community College. Meanwhile, Rancho Cucamonga is home to Chaffey College and satellite campuses for other universities. Both cities have numerous public and private schools for K-12 education.
Riverside’s economy is primarily driven by education, healthcare, and retail trade, while Rancho Cucamonga hosts more manufacturing and logistics businesses. Both cities have substantial service-sector operations, which offer extensive employment opportunities.
Biggest Employers
Riverside County and UC Riverside are among the biggest employers in Riverside. In Rancho Cucamonga, some of the biggest employers include the Etiwanda School District and Inland Empire Health Plan.
There were 293 building permits issued in Riverside in 2012 (250 more than in 2011) compared to 107 building permits issued in Rancho Cucamonga in 2012 (77 less than in 2011).
In Riverside (Riverside County), 49.6% voted for Democrats and 48.0% for Republicans in 2012 Presidential Election. In Rancho Cucamonga (San Bernardino County), 52.3% voted for Democrats and 45.0% for Republicans.
Elections
Type
Democrats
Republicans
Other
Year
Riverside
Rancho Cucamonga
Riverside
Rancho Cucamonga
Riverside
Rancho Cucamonga
2020
53.0%
54.2%
45.0%
43.6%
2.0%
2.2%
2016
49.7%
52.1%
44.4%
41.5%
5.9%
6.4%
2012
49.6%
52.3%
48.0%
45.0%
2.4%
2.6%
2008
50.4%
52.2%
48.1%
45.8%
1.5%
2.0%
2004
41.3%
43.8%
58.2%
55.6%
0.6%
0.6%
2000
45.0%
47.3%
51.6%
48.8%
3.4%
3.9%
1996
43.0%
44.4%
45.6%
43.6%
11.3%
12.1%
Breakdown of population affiliated with a religious congregation
Type
Adherents
Congregations
Religion
Riverside
Rancho Cucamonga
Riverside
Rancho Cucamonga
CATHOLIC CHURCH
27.5%
21.9%
4.5%
4.3%
SOUTHERN BAPTIST CONVENTION
1.2%
2.2%
11.2%
9.6%
SEVENTH DAY ADVENTIST CHURCH
0.9%
1.6%
3.4%
4.6%
MUSLIM ESTIMATE
0.5%
0.6%
0.7%
1.1%
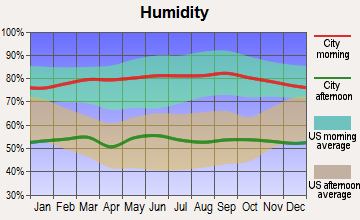
Weather
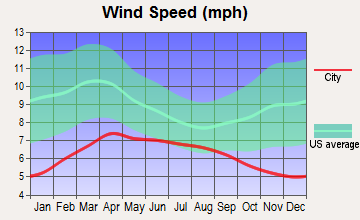
Both Riverside and Rancho Cucamonga feature the typical Southern California weather pattern, with warm to hot summers and mild winters. Average temperatures in Riverside span between 73 to 96°F in the summer and 45 to 68°F in the winter. Rancho Cucamonga experiences slightly chillier winters, with average temperatures ranging between 43 to 68°F, while summers are roughly the same.
Weather and climate
Type
Riverside
Rancho Cucamonga
Temperature - Average
66°F
64.5°F
Humidity - Average morning or afternoon humidity
66.7%
65.2%
Humidity - Differences between morning and afternoon humidity
21.4%
20.1%
Humidity - Maximum monthly morning or afternoon humidity
73.5%
71.4%
Humidity - Minimum monthly morning or afternoon humidity
52.1%
51.3%
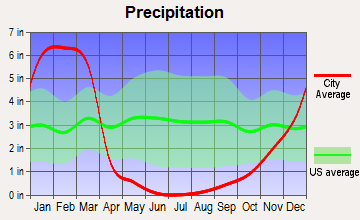
Precipitation - Yearly average
10.3 in
26.9 in
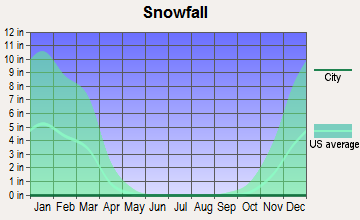
Snowfall - Yearly average
0 in
0 in
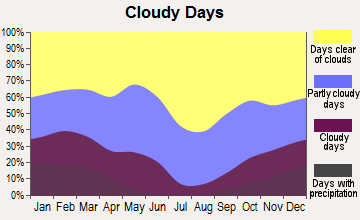
Clouds - Number of days clear of clouds
27.3%
27.6%
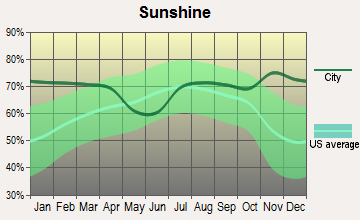
Sunshine amount - Average
78.2%
78.4%
Sunshine amount - Differences during a year
21.5%
21.8%
Sunshine amount - Maximum monthly
84.2%
84.7%
Sunshine amount - Minimum monthly
62.6%
62.9%
Wind speed - Average
4.5 mph
3.9 mph
Average climate in Riverside, California
Average climate in Rancho Cucamonga, California
Air pollution
Type
AQI
CO
NO2
OZONE
PB
PM10
PM25
SO2
Year
Riverside
Rancho Cucamonga
Riverside
Rancho Cucamonga
Riverside
Rancho Cucamonga
Riverside
Rancho Cucamonga
Riverside
Rancho Cucamonga
Riverside
Rancho Cucamonga
Riverside
Rancho Cucamonga
Riverside
Rancho Cucamonga
2018
153
152
0.35
0.37
14.4
15.5
29.8
29.0
0.006
0.006
44.6
34.7
13.6
15.3
0.4
0.4
2017
151
152
0.34
0.43
14.7
15.9
31.5
32.3
0.004
0.005
48.4
34.3
14.8
16.6
0.3
0.2
2016
140
140
0.33
0.39
14.8
16.7
30.9
32.3
0.006
0.006
44.4
28.4
14.5
16.9
0.2
0.4
2015
147
147
0.33
0.36
14.5
16.4
30.8
31.4
0.004
0.005
43.6
30.0
15.4
15.9
0.3
0.3
2014
147
146
0.37
0.36
15.9
17.3
30.7
29.6
0.006
0.006
34.1
32.2
16.5
17.4
0.3
0.3
2013
147
145
0.38
0.34
16.4
18.7
29.2
27.4
0.006
0.006
33.2
32.9
16.4
16.2
0.2
0.4
2012
148
147
0.35
0.38
16.4
19.7
30.2
28.6
0.007
0.006
32.3
33.4
16.0
18.2
0.3
0.6
2011
150
147
0.37
0.39
16.3
19.7
32.0
27.0
0.006
0.006
33.1
31.6
15.2
20.6
0.3
0.5
2010
144
146
0.42
0.40
17.8
20.5
30.9
28.3
0.008
0.008
31.9
29.0
15.5
18.7
1.3
1.0
2009
151
153
0.37
0.38
20.0
22.7
29.0
27.8
0.009
0.008
38.0
26.6
19.6
19.6
1.5
1.0
2008
157
161
0.41
0.45
20.5
22.5
30.0
28.3
0.010
0.009
43.6
30.4
16.3
18.2
0.9
1.5
2007
135
136
0.65
0.54
20.8
26.1
28.3
26.4
0.011
0.011
N/A
N/A
N/A
N/A
1.6
1.7
2006
129
125
0.58
0.60
21.0
29.2
28.0
26.1
0.005
0.007
N/A
N/A
N/A
N/A
1.4
1.8
2005
134
134
0.53
0.64
22.8
30.1
27.3
22.7
0.012
0.012
N/A
N/A
N/A
N/A
3.3
2.3
2004
142
139
0.72
0.68
18.5
29.1
29.5
23.3
0.013
0.012
N/A
N/A
N/A
N/A
3.1
1.3
2003
144
141
0.75
0.48
22.7
32.6
28.5
22.9
0.013
0.019
N/A
N/A
N/A
N/A
2.0
1.0
2002
142
137
0.82
0.39
24.9
34.9
28.5
23.0
0.015
0.018
N/A
N/A
N/A
N/A
0.2
1.1
2001
145
142
0.79
0.94
25.7
35.9
26.1
22.4
0.025
0.034
N/A
N/A
N/A
N/A
0.9
1.3
2000
157
153
0.82
0.99
24.2
36.6
25.0
22.2
0.031
0.038
N/A
N/A
N/A
N/A
1.2
1.9
Natural disasters
Type
Riverside
Rancho Cucamonga
Tornado activity compared to U.S. average
17.4%
17.5%
Earthquake activity compared to U.S. average
7,322.6%
7,430.7%
Natural disasters compared to U.S. average
46%
46%
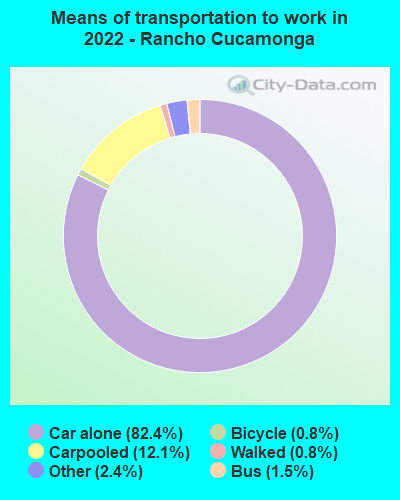
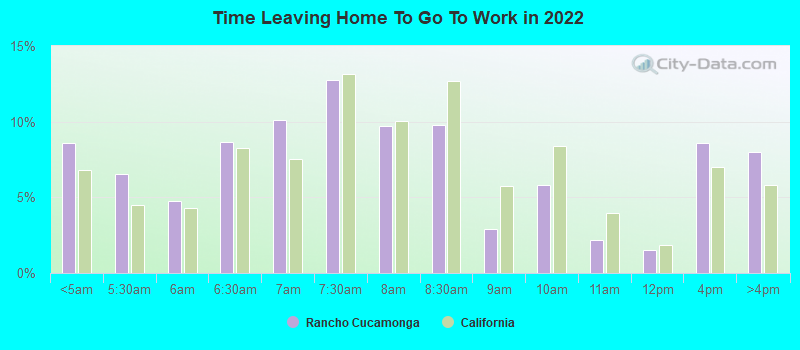
Transportation
Both cities are serviced by Metrolink, California’s commuter rail service. Riverside has a more extensive network of public buses, while Rancho Cucamonga has OmniTrans. Bike lanes and sidewalks are common in both cities for cyclists and pedestrians.
Transport
Type
Riverside
Rancho Cucamonga
Amtrak stations
1
0
Amtrak stations nearby
3
3
FAA registered aircraft
307
98
FAA registered aircraft manufacturers and dealers
15
4
Means of transportation to work
Type
Riverside
Rancho Cucamonga
Bicycle
0.5%
0.2%
Bus
0.9%
0.8%
Carpooled
9%
11.4%
Car alone
85.7%
85.6%
Motorcycle
0.3%
0.2%
Railroad
0.4%
1%
Walked
2.3%
0.9%
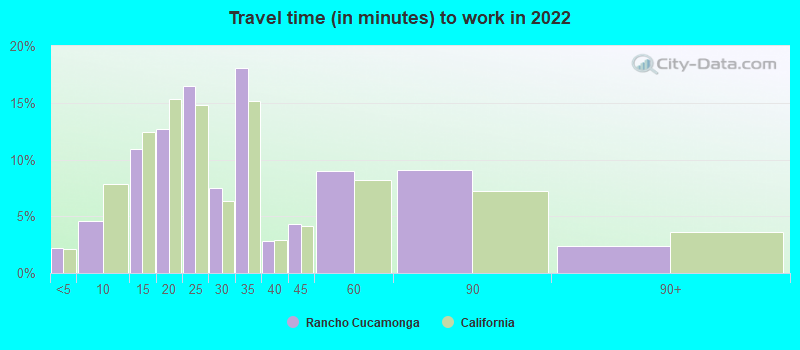
Average travel time to work
Type
Riverside
Rancho Cucamonga
Average
31.3 min
32.9 min
Other means
28.7 min
31.7 min
Public transportation
45.3 min
64 min
Private vehicle occupancy
Type
Riverside
Rancho Cucamonga
Average
1.1
1.2
Drove alone
89.1%
89.8%
In 2 person carpool
8.4%
7.2%
In 3 person carpool
2%
2%
In 4 person carpool
0.2%
0.7%
In 5-6 person carpool
0.2%
0.2%
In 7+ person carpool
0.1%
0.2%
How many people usually rode to work in the car, truck or van.
Real Estate
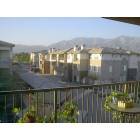
Riverside features a blend of older, historic homes, and newer developments. Rancho Cucamonga, primarily a residential city, hosts newer single-family homes. House prices are generally higher in Rancho Cucamonga than in Riverside.
Neighborhoods
Riverside offers a blend of urban, suburban, and rural neighborhoods, each with a unique character. The city's downtown area is characterized by cultural institutions, independent stores, and restaurants. On the other hand, Rancho Cucamonga is noted for its suburban feel, with offshoots of shopping malls, family-friendly neighborhoods, and convenient amenities.
Houses and residents
Type
Riverside
Rancho Cucamonga
Houses
94,246
59,083
Average household size (people)
3.2
3
Median year apartment built
1982
1989
Median year house/condo built
1974
1986
Length of stay in the house since moving in
14.2 years
13.8 years
Houses occupied
91,110 (96.7%)
57,290 (97%)
Houses occupied by owners
51,211 (56.2%)
33,694 (58.8%)
Houses occupied by renters
39,899 (43.8%)
23,596 (41.2%)
Median rent asked for vacant for-rent units
$1,277
$1,222
Median monthly housing costs
$1,680
$2,005
Median price asked for vacant for-sale houses and condos
$414,585
$551,487
Estimated median house or condo value
$483,300
$632,700
Median numbers of rooms
5.2
5.7
Median number of rooms in apartments
3.9
4.1
Median number of rooms in houses and condos
6.1
6.5
Median house price - detached houses
$548,362
$726,916
Median house price - in 3-to-4-unit structures
$450,463
$405,195
Median house price - in 5 or more unit structures
$408,213
$821,505
Median house price - mobile homes
$81,780
$408,290
Median house price - Townhouses or other attached units
$442,670
$401,850
Median house price - All housing units
$529,360
$691,155
Median house age
44
33
Renting percentage
44.3%
35.2%
Housing density (houses/condos per square mile)
1,206.8
1,577.8
House value disparities
21%
22%
Household income disparities
40.5%
40.8%
Median household income for houses/condes with a mortgage
$104,161
$111,063
Median household income for apartments without a mortgage
$71,925
$79,041
Housing units without a mortgage
393 (1%)
452 (1.8%)
Housing units with both a second mortgage and home equity loan
1,312 (3.3%)
1,873 (7.6%)
Housing units with a mortgage
39,744 (99%)
24,110 (98.2%)
Housing units with a home equity loan
123 (0.3%)
205 (0.8%)
Housing units with a second mortgage
2,112 (5.3%)
2,544 (10.4%)
House/condo owner moved in on average (years ago)
13
13
House/condo renter moved in on average (years ago)
3
3
Housing units lacking complete kitchen facilities
2.5%
1.3%
Housing units lacking complete plumbing facilities
0.4%
0.5%
Housing units in structures
Housing units in structures
Riverside
Rancho Cucamonga
One, detached
63.1%
60.0%
One, attached
5.6%
8.0%
Two
1.1%
1.6%
3 or 4
3.7%
7.3%
5 to 9
6.8%
3.4%
10 to 19
7.0%
1.6%
20 to 49
4.6%
3.3%
50 or more
6.4%
12.9%
Mobile homes
1.8%
1.9%
Median real estate property taxes paid for housing units
Self-employed workers in own not incorporated business
8,164
5,071
State government workers
8,293
2,611
Unpaid family workers
199
0
Industries and Occupations
Riverside’s primary industries include education, healthcare, arts and entertainment, while Rancho Cucamonga leans towards manufacturing, retail, and logistics businesses. Both cities offer a range of job opportunities across various fields, with a significant number of residents working in management, sales, and administrative roles.
Riverside hosts several modern hospitals and health care facilities, such as the Riverside Community Hospital and Kaiser Permanente Riverside Medical Center. Also, Rancho Cucamonga has San Antonio Regional Hospital and several clinics providing high-quality healthcare services.
Health (county statistics)
Type
Riverside
Rancho Cucamonga
General health status score of residents in this county from 1 (poor) to 5 (excellent)
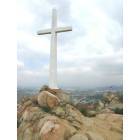
Riverside showcases historical architectural masterpieces combined with modern infrastructure. The city hosts the historic Mission Inn and Riverside Art Museum. Conversely, Rancho Cucamonga, with its more contemporary yet diverse architectural styles, caters to the needs of suburban families. The city also possesses a large central park and library.
HMDA - Conventional home purchase loans - Applications denied
Year
Riverside
Rancho Cucamonga
1999
794
509
2000
375
326
2001
310
299
2002
405
361
2003
1,399
873
2004
1,892
1,152
2005
2,728
1,384
2006
3,235
1,318
2007
1,568
888
2008
544
357
2009
285
201
Culture and Food
Riverside enjoys a rich cultural scene, boasting arts festivals and numerous ethnic restaurants. The city hosts the Festival of Lights, attracting thousands of visitors each year. Rancho Cucamonga also offers diverse dining options and hosts the Grape Harvest Festival, celebrating the city's wine heritage.
Sports Teams
As smaller cities, neither Riverside nor Rancho Cucamonga features professional sports teams. However, both cities maintain a strong interest in sports through youth and adult leagues. Additionally, they're positioned within traveling distance to professional teams in Los Angeles.


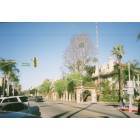
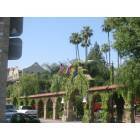

 Riverside, CA
 Rancho Cucamonga, CA