Sacramento, the capital city of California, and Concord, the largest city in Contra Costa County, offer unique living experiences. Family-friendly neighborhoods, education opportunities, diverse economy, and cultural richness define both cities. Sacramento is larger and more politically connected, while Concord has a smaller-town feel with a focus on local businesses and eateries. Here's a comprehensive comparison to aid your decision between relocating or touring these cities.
Distance between
Sacramento, CA and
Concord, CA : 50.3 miles
Sacramento's population is larger by 323%. Its population has grown by 118,023 people (29.0%) since 2000. The population of Concord has grown by 2,294 people (1.9%) during that time.
Statistically, Sacramento has a higher crime rate compared to Concord. However, like many cities, crime rates can vary widely depending on the neighborhood. Concord is generally safer, particularly in the suburban areas. It's recommended both for tourists and potential residents to research local neighborhoods to make informed judgments on safety.
City-data.com crime index counts serious crimes and violent crime more heavily. It adjusts for the number of visitors and daily workers commuting into cities. (higher means more crime, U.S. average = 301.1)
City-data.com crime index counts serious crimes and violent crime more heavily. It adjusts for the number of visitors and daily workers commuting into cities. (higher means more crime, U.S. average = 301.1)
Sex Offenders
According to our data, there are 2,731 registered sex offenders living in Sacramento and 202 registered sex offenders living in . The ratio of residents to sex offenders in Sacramento is 181 to 1; the ratio in Concord is 637 to 1. The number of registered sex offenders compared to the number of residents is much larger in Sacramento than that in Concord.
Cost of Living
The cost of living in Sacramento is generally lower than in Concord, making it more affordable for relocation and long-term residency. Housing, groceries, and overall expenditures are noticeably cheaper in Sacramento, while Concord, being closer to the bay area, tends to have a higher cost of living.
Income Tax
Californian residents pay the same state income tax regardless of city. The rate ranges from 1% to 13.3% based on income, the highest rate among the US states.
Property Tax
Property taxes are similar in both cities, with Sacramento's average rate being 0.84% and Concord's 0.77%. The single-family home median property tax payment is significantly higher in Concord due to the higher property values.
Sales Tax
Both cities sit within California, meaning they share the same state sales tax of 7.25%. However, local taxes bring Sacramento's total sales tax to 8.75% and Concord's to 8.50%.
Income
Type
Sacramento
Concord
Estimated median household income
$75,311
$96,961
Estimated per capita income
$37,916
$46,157
Cost of living index (U.S. average is 100)
102.9
120.9
If you make $50,000 in Sacramento, you will have to make $58,746 in Concord to maintain the same standard of living.
Geographical Conditions
Sacramento is located in the Central Valley, near the Sacramento and American Rivers. Concord is located in the East Bay region, benefiting from its proximity to the scenic Mt. Diablo State Park.
Both Sacramento and Concord offer a variety of public, charter, and private schools. Sacramento, with its larger population, has a wider range of options, including universities such as Sacramento State University. Concord's education system is smaller but well-rated, with great community support.
Sacramento's economy is driven by the governmental sector, healthcare, education, and increasing tech industry presence. The city holds many state government jobs. Concord's economy is a mix of healthcare, retail, and professional services. Both cities offer opportunities for job-seekers, though the industries vary.
Biggest Employers
In Sacramento, the State of California is the largest employer, followed by Sacramento County and healthcare providers like Sutter Health. Concord's biggest employers include John Muir Health, Mount Diablo Unified School District, and the City of Concord.
There were 1,004 building permits issued in Sacramento in 2012 (943 more than in 2011) compared to 60 building permits issued in Concord in 2012 (58 more than in 2011).
In Sacramento (Sacramento County), 58.1% voted for Democrats and 39.1% for Republicans in 2012 Presidential Election. In Concord (Contra Costa County), 66.2% voted for Democrats and 31.1% for Republicans.
Elections
Type
Democrats
Republicans
Other
Year
Sacramento
Concord
Sacramento
Concord
Sacramento
Concord
2020
61.4%
71.8%
36.1%
26.4%
2.5%
1.8%
2016
58.0%
67.5%
33.8%
24.5%
8.3%
8.0%
2012
58.1%
66.2%
39.1%
31.1%
2.8%
2.7%
2008
58.4%
68.0%
39.4%
30.2%
2.2%
1.8%
2004
49.8%
62.6%
49.6%
36.7%
0.6%
0.7%
2000
49.4%
59.0%
45.4%
37.2%
5.2%
3.8%
1996
49.8%
55.7%
40.8%
35.2%
9.4%
9.1%
Breakdown of population affiliated with a religious congregation
Type
Adherents
Congregations
Religion
Sacramento
Concord
Sacramento
Concord
CATHOLIC CHURCH
16.2%
21.8%
5.1%
5.2%
SOUTHERN BAPTIST CONVENTION
1.7%
1.3%
8.6%
10.0%
MUSLIM ESTIMATE
0.9%
1.0%
1.3%
1.4%
NORTH AMERICAN BAPTIST CONFERENCE
0.6%
0.0%
2.2%
0.0%
SEVENTH DAY ADVENTIST CHURCH
0.6%
0.3%
2.1%
1.5%
EVANGELICAL LUTHERAN CHURCH IN AMERICA
0.5%
0.5%
1.8%
2.0%
AMERICAN BAPTIST CHURCHES IN THE USA
0.4%
0.3%
1.7%
2.6%
EPISCOPAL CHURCH
0.3%
0.5%
1.4%
2.3%
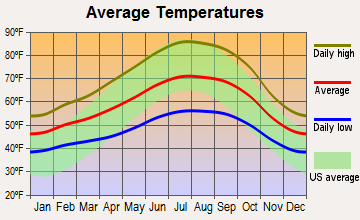
Weather
Sacramento has a hot-summer Mediterranean climate, characterized by hot, dry summers and mild to cool, wet winters. Concord also has a Mediterranean climate but is generally cooler due to its proximity to the San Francisco Bay. This may be preferable for tourists and residents seeking more moderate temperatures.
Weather and climate
Type
Sacramento
Concord
Temperature - Average
62.2°F
59.2°F
Humidity - Average morning or afternoon humidity
66.8%
80.4%
Humidity - Differences between morning and afternoon humidity
58%
31.5%
Humidity - Maximum monthly morning or afternoon humidity
87%
87.5%
Humidity - Minimum monthly morning or afternoon humidity
29%
56%
Precipitation - Yearly average
19 in
21.3 in
Snowfall - Yearly average
0 in
0 in
Clouds - Number of days clear of clouds
31.5%
28.3%
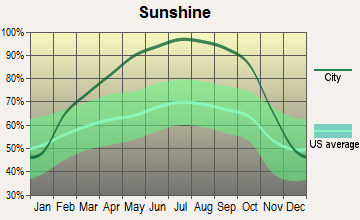
Sunshine amount - Average
83.6%
73.8%
Sunshine amount - Differences during a year
52%
23%
Sunshine amount - Maximum monthly
97%
77.4%
Sunshine amount - Minimum monthly
45%
54.4%
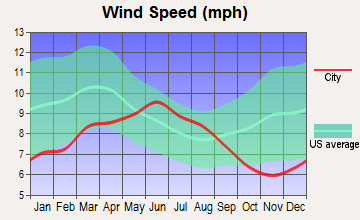
Wind speed - Average
6.8 mph
10.7 mph
Average climate in Sacramento, California
Average climate in Concord, California
Air pollution
Type
AQI
CO
NO2
OZONE
PB
PM10
PM25
SO2
Year
Sacramento
Concord
Sacramento
Concord
Sacramento
Concord
Sacramento
Concord
Sacramento
Concord
Sacramento
Sacramento
Concord
Sacramento
Concord
2018
121
105
0.32
0.31
9.7
6.5
24.7
21.9
0.002
N/A
28.9
N/A
12.7
13.3
N/A
0.6
2017
117
101
0.33
0.29
9.0
6.6
25.2
26.2
0.002
N/A
22.1
N/A
8.8
12.1
N/A
0.6
2016
103
86
0.44
0.27
8.0
6.2
25.3
25.4
0.002
N/A
14.0
N/A
9.0
6.4
N/A
0.8
2015
105
94
0.25
0.33
9.7
7.3
24.9
26.0
0.002
N/A
16.2
N/A
10.9
8.7
N/A
0.5
2014
99
95
0.24
0.34
10.2
7.5
24.9
25.4
0.002
N/A
15.6
N/A
9.6
6.7
N/A
0.5
2013
102
93
0.29
0.34
11.1
9.1
23.2
21.6
0.002
N/A
21.3
N/A
11.9
7.6
N/A
0.5
2012
107
89
0.31
0.32
10.5
8.4
25.2
25.4
0.002
N/A
15.2
N/A
7.9
8.4
N/A
0.3
2011
106
92
0.29
0.35
11.2
8.8
24.0
23.1
0.002
N/A
17.7
N/A
10.8
9.9
N/A
0.6
2010
109
88
0.29
0.32
11.2
8.3
22.8
23.2
N/A
0.017
16.9
N/A
9.3
8.3
0.5
0.4
2009
118
101
0.40
0.31
12.4
9.3
23.3
23.8
0.003
0.006
20.6
N/A
11.4
9.8
0.5
0.6
2008
130
120
0.40
0.37
14.9
10.1
25.4
26.3
N/A
0.005
24.3
N/A
13.6
12.2
0.5
0.8
2007
129
104
0.39
0.36
14.8
10.7
23.7
24.1
0.005
N/A
19.9
N/A
13.5
10.0
0.6
0.7
2006
124
107
0.49
0.39
15.4
10.8
22.7
26.1
N/A
N/A
23.7
N/A
13.0
12.0
0.5
0.8
2005
125
102
0.42
0.43
15.9
11.6
20.0
22.8
N/A
N/A
22.1
N/A
13.5
11.1
0.6
1.0
2004
119
110
0.49
0.46
15.8
12.4
19.1
22.7
N/A
N/A
22.7
N/A
13.3
12.4
0.6
1.0
2003
119
83
0.47
0.50
16.8
13.4
20.3
23.1
N/A
N/A
23.1
N/A
N/A
N/A
0.9
0.6
2002
114
88
0.50
0.51
18.1
14.7
21.2
23.4
0.004
N/A
25.1
N/A
N/A
N/A
1.5
0.8
2001
111
89
0.43
0.56
18.0
15.4
21.2
22.2
0.004
N/A
20.7
N/A
N/A
N/A
1.4
1.1
2000
107
94
0.55
0.68
17.9
16.0
19.5
20.9
0.004
N/A
19.1
N/A
N/A
N/A
1.4
1.6
Natural disasters
Type
Sacramento
Concord
Tornado activity compared to U.S. average
8.8%
9.4%
Earthquake activity compared to U.S. average
7,798.9%
7,805.6%
Natural disasters compared to U.S. average
18%
18%
Transportation
As a larger city, Sacramento has more extensive public transit with buses, light rail, and ample bike lanes. Concord has a smaller but efficient bus system and BART (Bay Area Rapid Transit) for commuting into San Francisco.
Transport
Type
Sacramento
Concord
Amtrak stations
1
0
Amtrak stations nearby
3
3
FAA registered aircraft
414
91
FAA registered aircraft manufacturers and dealers
20
4
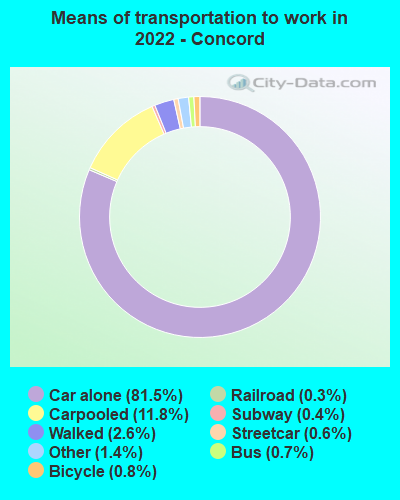
Means of transportation to work
Type
Sacramento
Concord
Bicycle
1.1%
0.8%
Bus
1%
0.8%
Carpooled
12%
12.4%
Car alone
80%
80.6%
Motorcycle
0.2%
0.2%
Railroad
0.4%
0.2%
Streetcar
0.1%
0.9%
Subway
0.1%
0.4%
Taxicab
0.1%
0.2%
Walked
2.8%
2%
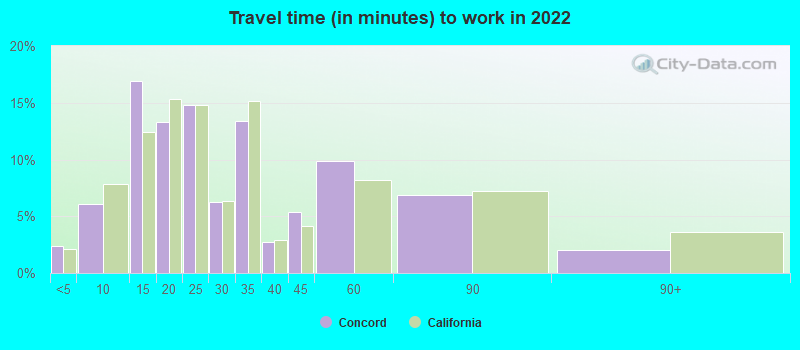
Average travel time to work
Type
Sacramento
Concord
Average
28.5 min
30 min
Other means
22.8 min
30.2 min
Public transportation
39 min
59.3 min
Private vehicle occupancy
Type
Sacramento
Concord
Average
1.2
1.3
Drove alone
88.5%
87.1%
In 2 person carpool
9.4%
7.6%
In 3 person carpool
1.2%
1.3%
In 4 person carpool
0.4%
2.5%
In 5-6 person carpool
0.5%
1%
In 7+ person carpool
0%
0.5%
How many people usually rode to work in the car, truck or van.
Real Estate
Real estate is generally more affordable in Sacramento than in Concord. Concord is closer to the high-demand San Francisco Bay Area, which raises its home prices. Sacramento offers more variety and affordability for homebuyers and renters.
Neighborhoods
Sacramento is known for its diverse and distinct neighborhoods, each with unique cultural identities. Conversely, Concord is smaller with a family-oriented feel and includes peaceful suburban neighborhoods.
Houses and residents
Type
Sacramento
Concord
Houses
210,715
47,251
Average household size (people)
2.6
2.7
Median year apartment built
1977
1976
Median year house/condo built
1978
1969
Length of stay in the house since moving in
12.8 years
15.5 years
Houses occupied
202,093 (95.9%)
46,375 (98.1%)
Houses occupied by owners
103,994 (51.5%)
26,282 (56.7%)
Houses occupied by renters
98,099 (48.5%)
20,093 (43.3%)
Median rent asked for vacant for-rent units
$976.09
$1,785
Median monthly housing costs
$1,558
$2,121
Median price asked for vacant for-sale houses and condos
$398,191
$556,419
Estimated median house or condo value
$449,600
$719,000
Median numbers of rooms
5
5.2
Median number of rooms in apartments
4.1
4
Median number of rooms in houses and condos
5.8
6.1
Median house price - detached houses
$496,462
$795,615
Median house price - in 2-unit structures
$630,561
$323,860
Median house price - in 3-to-4-unit structures
$205,310
$343,713
Median house price - in 5 or more unit structures
$382,635
$300,600
Median house price - mobile homes
$104,325
$117,259
Median house price - Townhouses or other attached units
$463,571
$460,145
Median house price - All housing units
$481,210
$702,091
Median house age
44
48
Renting percentage
50.6%
38.9%
Housing density (houses/condos per square mile)
2,168.8
1,567.9
House value disparities
25.5%
22%
Household income disparities
44%
41.5%
Median household income for houses/condes with a mortgage
$109,432
$136,711
Median household income for apartments without a mortgage
$82,443
$97,542
Housing units without a mortgage
1,166 (1.6%)
246 (1.2%)
Housing units with both a second mortgage and home equity loan
4,385 (6.1%)
1,954 (9.4%)
Housing units with a mortgage
70,415 (98.4%)
20,460 (98.8%)
Housing units with a home equity loan
204 (0.3%)
159 (0.8%)
Housing units with a second mortgage
5,362 (7.5%)
2,679 (12.9%)
House/condo owner moved in on average (years ago)
10
14
House/condo renter moved in on average (years ago)
3
3
Housing units lacking complete kitchen facilities
1.2%
1.1%
Housing units lacking complete plumbing facilities
0.3%
0.6%
Housing units in structures
Housing units in structures
Sacramento
Concord
One, detached
61.7%
58.2%
One, attached
6.8%
6.8%
Two
1.8%
1.1%
3 or 4
4.8%
4.2%
5 to 9
6.9%
1.9%
10 to 19
4.9%
6.0%
20 to 49
3.5%
8.9%
50 or more
7.6%
10.8%
Mobile homes
1.9%
1.9%
Boats, RVs, vans, etc.
0.0%
0.1%
Median real estate property taxes paid for housing units
Self-employed workers in own not incorporated business
12,891
5,095
State government workers
40,274
1,911
Unpaid family workers
755
169
Industries and Occupations
Sacramento is home to many administrative and government-related jobs due to its status as the state's capital. Concord's workforce primarily falls into the sectors of healthcare, retail, and manufacturing.
Sacramento is a hub for quality healthcare with top-rated hospitals like UC Davis Medical Center. Concord has excellent healthcare with John Muir Health and Kaiser Permanente Medical Center servicing the city and surrounding communities.
Health (county statistics)
Type
Sacramento
Concord
General health status score of residents in this county from 1 (poor) to 5 (excellent)
Sacramento's infrastructure caters to its larger population, with more extensive public transportation and freeway systems. Concord, while smaller, has a functional transportation system that intimately connects its neighborhoods and commercial areas.
Infrastructure
Type
Sacramento
Concord
Hospitals
17
7
TV stations
23
23
Bank branches located here
127
25
Bank institutions located here
31
13
Main business address for public companies
5
3
Drinking water stations with no reported violations in the past
26
3
Drinking water stations with reported violations in the past
HMDA - Conventional home purchase loans - Applications denied
Year
Sacramento
Concord
1999
1,003
362
2000
1,155
381
2001
983
376
2002
1,197
395
2003
2,258
554
2004
3,872
773
2005
4,610
1,039
2006
4,276
1,115
2007
2,386
619
2008
1,381
335
2009
647
183
Culture and Food
Sacramento has been labeled the "Farm-to-Fork Capital" for its focus on locally-sourced food, with a diverse range of cuisines reflecting its cultural diversity. Meanwhile, Concord offers a blend of cuisines and a charming downtown area known for its local eateries and breweries.
Sports Teams
Sacramento is home to the NBA's Sacramento Kings. Soccer fans can cheer on the Sacramento Republic FC. Concord does not have major sports teams but is near the San Francisco Bay Area, home to multiple professional sports teams.


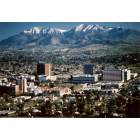
 Sacramento, CA
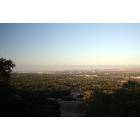
 Concord, CA