San Antonio, Texas and Lexington-Fayette, Kentucky, offer different experiences for residents and visitors. Both have their distinct characteristics in terms of climate, economy, cost of living, education, health care, and more. San Antonio, being the larger and more multifaceted city, provides a more cosmopolitan lifestyle with a rich blend of cultures, advanced infrastructures, and an array of industries. On the other hand, Lexington-Fayette is known for its serene landscapes, horse racing culture, and a robust agricultural-based economy. This comparison will help you understand the specifics of each city across a range of aspects.
Distance between
San Antonio, TX and
Lexington-Fayette, KY : 998.0 miles
San Antonio's population is larger by 351%. Its population has grown by 307,207 people (26.8%) since 2000. The population of Lexington-Fayette has grown by 61,281 people (23.5%) during that time.
When looking at crime rates, both San Antonio and Lexington-Fayette have areas to improve. San Antonio's crime rates are higher than the U.S. average, mostly due to property crimes. It's worth noting, though, that like any city, some neighborhoods are safer than others. Lexington-Fayette has a considerably lower crime rate than San Antonio, but still slightly above the national average. However, Lexington-Fayette is statistically safer than majority of U.S. cities of its size.
Cost of Living
The cost of living in Lexington-Fayette is slightly lower than the U.S. average, making it an affordable option. San Antonio is also relatively affordable, with a cost of living index below the national average. But keep in mind that specific expenses, such as housing and utilities, may vary between the two cities. Generally speaking, both cities are good options for those seeking lower costs of living.
Income Tax
San Antonio residents enjoy a significant tax advantage as Texas does not impose a state income tax. Conversely, Kentucky does levy a state income tax rate of 5% for all taxpayers, affecting Lexington-Fayette residents.
Property Tax
The property tax in San Antonio is approximately 2.1% of assessed home value, which is relatively high. Lexington-Fayette has a lower property tax rate averaging around 1.1% of assessed home value.
Sales Tax
Texas, including San Antonio, doesn't have a state sales tax, but it has a city sales tax of 8.25%. On the other hand, Lexington-Fayette in Kentucky has a state sales tax of 6.00% and no additional city sales tax.
Income
Type
San Antonio
Lexington-Fayette
Estimated median household income
$54,923
$60,942
Estimated per capita income
$28,860
$37,011
Cost of living index (U.S. average is 100)
87.7
89.3
If you make $50,000 in San Antonio, you will have to make $50,912 in Lexington-Fayette to maintain the same standard of living.
Geographical Conditions
San Antonio is tucked in the southern part of Texas, characterized by flat to gently rolling terrain. Lexington-Fayette is located within the lush, rolling landscape of the Bluegrass Region of Kentucky, known for its robust horse farms, and is close to the Appalachian Mountains.
San Antonio has strong educational institutions ranging from public schools to private institutions and several highly-ranked universities, like the University of Texas at San Antonio. On the other hand, Lexington-Fayette offers a well-respected education system, with the University of Kentucky being among the top employers in the city. Both cities are home to several other colleges and technical schools, providing a range of educational opportunities.
San Antonio boasts a diversified economy with a focus on military, health care, government services, financial services, oil and gas, and tourism. Lexington's economy, on the other hand, is anchored by the public sector, education, health care, and manufacturing. It's also known for its strong agricultural sector, particularly in horse and livestock production.
Biggest Employers
In San Antonio, the largest employers include the Military (U.S. Department of Defense), H-E-B (a grocery chain), and the local school district. In Lexington, the University of Kentucky, Fayette County Public Schools, and Lexmark (a technology company) are among the biggest employers.
There were 6,567 building permits issued in San Antonio in 2012 (4973 more than in 2011) compared to 792 building permits issued in Lexington-Fayette in 2012 (279 more than in 2011).
In San Antonio (Bexar County), 51.6% voted for Democrats and 47.1% for Republicans in 2012 Presidential Election. In Lexington-Fayette (Fayette County), 49.3% voted for Democrats and 48.3% for Republicans.
Elections
Type
Democrats
Republicans
Other
Year
San Antonio
Lexington-Fayette
San Antonio
Lexington-Fayette
San Antonio
Lexington-Fayette
2020
58.3%
59.4%
40.1%
38.6%
1.5%
1.9%
2016
54.2%
51.3%
40.8%
41.8%
5.0%
6.9%
2012
51.6%
49.3%
47.1%
48.3%
1.4%
2.3%
2008
52.3%
51.7%
46.7%
46.9%
1.0%
1.3%
2004
44.5%
46.3%
55.0%
53.1%
0.6%
0.6%
2000
44.9%
45.0%
52.3%
51.8%
2.7%
3.2%
1996
49.7%
47.1%
44.6%
46.3%
5.7%
6.6%
Breakdown of population affiliated with a religious congregation
Type
Adherents
Congregations
Religion
San Antonio
Lexington-Fayette
San Antonio
Lexington-Fayette
CATHOLIC CHURCH
30.8%
8.8%
8.6%
3.0%
SOUTHERN BAPTIST CONVENTION
6.8%
13.7%
23.5%
19.5%
MUSLIM ESTIMATE
1.2%
0.2%
0.8%
0.8%
LUTHERAN CHURCH
0.7%
0.3%
1.0%
1.1%
EPISCOPAL CHURCH
0.6%
0.9%
1.6%
2.3%
EVANGELICAL LUTHERAN CHURCH IN AMERICA
0.6%
0.4%
2.2%
1.1%
SEVENTH DAY ADVENTIST CHURCH
0.2%
0.3%
1.3%
1.5%
PRESBYTERIAN CHURCH IN AMERICA
0.1%
0.3%
0.3%
0.8%
VINEYARD USA
0.0%
0.4%
0.2%
0.4%
Weather
Weather differs significantly between these two cities. San Antonio boasts a hot, humid climate characterized by mild winters and long, hot summers, while Lexington-Fayette enjoys a humid subtropical climate. This climate includes cool, wet winters and hot, humid summers. For those who thrive in more extreme elements of heat, San Antonio is a better option. However, if you prefer a climate with a greater balance of seasons, Lexington-Fayette is more suitable.
Weather and climate
Type
San Antonio
Lexington-Fayette
Temperature - Average
68.7°F
55.3°F
Humidity - Average morning or afternoon humidity
74.9%
75.8%
Humidity - Differences between morning and afternoon humidity
37%
31%
Humidity - Maximum monthly morning or afternoon humidity
87%
85%
Humidity - Minimum monthly morning or afternoon humidity
50%
54%
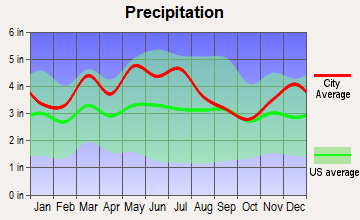
Precipitation - Yearly average
32.2 in
45.9 in
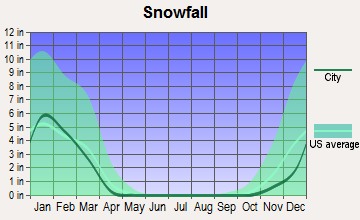
Snowfall - Yearly average
1.2 in
35.2 in
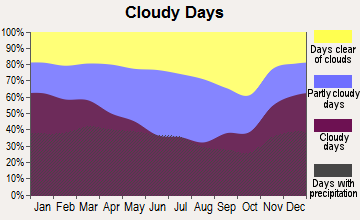
Clouds - Number of days clear of clouds
17.5%
14.9%
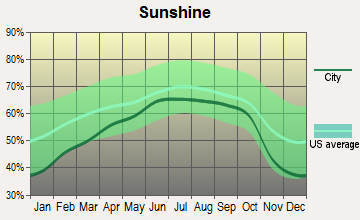
Sunshine amount - Average
62.4%
59.9%
Sunshine amount - Differences during a year
24%
25.5%
Sunshine amount - Maximum monthly
72%
66.2%
Sunshine amount - Minimum monthly
48%
40.7%
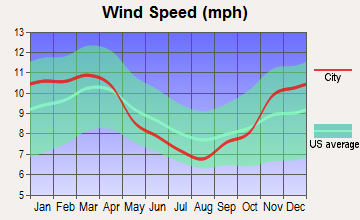
Wind speed - Average
8.9 mph
8.6 mph
Average climate in San Antonio, Texas
Average climate in Lexington-Fayette, Kentucky
Air pollution
Type
AQI
CO
NO2
OZONE
PM10
PM25
SO2
Year
San Antonio
Lexington-Fayette
San Antonio
Lexington-Fayette
San Antonio
Lexington-Fayette
San Antonio
Lexington-Fayette
San Antonio
San Antonio
Lexington-Fayette
San Antonio
Lexington-Fayette
2018
83
63
N/A
N/A
4.9
3.1
25.6
31.6
N/A
N/A
8.0
9.7
0.2
0.1
2017
85
64
N/A
N/A
5.1
4.9
26.9
32.1
N/A
N/A
8.4
7.2
1.7
0.1
2016
79
68
N/A
N/A
5.2
6.6
25.7
33.3
N/A
N/A
8.2
6.9
0.8
0.1
2015
76
71
N/A
N/A
4.7
6.7
25.4
31.4
N/A
N/A
9.2
7.3
0.7
0.1
2014
84
68
N/A
N/A
5.5
6.8
27.3
34.1
N/A
N/A
9.5
7.6
0.6
0.3
2013
79
69
N/A
N/A
4.1
7.3
28.2
31.7
N/A
N/A
9.0
10.0
0.7
0.2
2012
77
81
N/A
N/A
4.5
8.1
27.5
34.9
18.1
N/A
9.2
10.6
N/A
0.8
2011
85
78
N/A
N/A
4.6
8.3
29.2
34.6
18.9
N/A
9.9
11.3
N/A
2.1
2010
75
76
0.21
N/A
7.2
9.5
25.8
34.9
17.1
N/A
9.2
10.0
N/A
2.2
2009
74
75
0.23
N/A
8.3
8.5
25.7
31.1
19.5
N/A
9.8
9.2
0.4
2.7
2008
84
72
0.26
N/A
9.3
7.8
26.8
36.4
19.8
N/A
10.1
9.1
0.5
2.4
2007
83
92
0.49
N/A
9.3
10.9
26.3
37.9
23.4
N/A
10.3
12.9
N/A
4.0
2006
86
65
0.51
N/A
9.7
11.8
32.7
32.8
24.8
N/A
9.8
N/A
N/A
3.8
2005
86
77
0.53
N/A
10.7
12.1
30.8
34.0
22.3
N/A
10.1
N/A
N/A
4.4
2004
76
60
0.48
N/A
10.4
11.6
29.6
28.6
22.4
N/A
N/A
N/A
N/A
3.2
2003
77
67
0.57
N/A
10.3
12.2
28.5
30.3
26.7
N/A
N/A
N/A
N/A
3.5
2002
88
76
0.52
0.04
11.2
12.1
30.3
31.3
N/A
N/A
N/A
N/A
N/A
3.6
2001
78
69
0.57
0.07
11.9
13.2
29.3
30.9
N/A
N/A
N/A
N/A
N/A
4.4
2000
82
79
0.52
0.14
11.7
13.4
29.6
32.7
N/A
N/A
N/A
N/A
N/A
5.0
Natural disasters
Type
San Antonio
Lexington-Fayette
Tornado activity compared to U.S. average
91.5%
126.8%
Earthquake activity compared to U.S. average
73.7%
171.6%
Natural disasters compared to U.S. average
21%
14%
Transportation
San Antonio's VIA Metropolitan Transit provides public transportation with an extensive bus system. However, most locals prefer using personal vehicles. Lexington-Fayette offers public transport services through Lextran, which operates bus routes throughout the city. However, like San Antonio, many residents prefer to drive.
Transport
Type
San Antonio
Lexington-Fayette
Amtrak stations
1
0
Amtrak stations nearby
1
0
FAA registered aircraft
987
0
FAA registered aircraft manufacturers and dealers
29
0
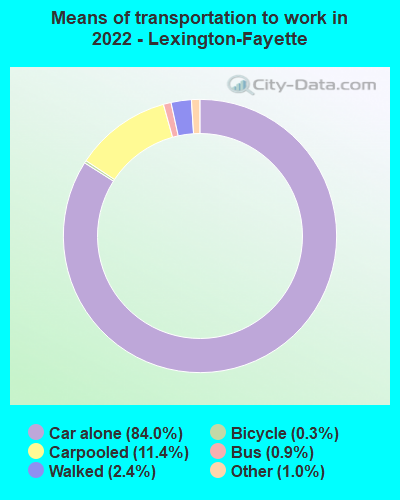
Means of transportation to work
Type
San Antonio
Lexington-Fayette
Bicycle
0.2%
0.6%
Bus
1.6%
1.2%
Carpooled
12.9%
8.3%
Car alone
81.9%
86.5%
Motorcycle
0.1%
0.1%
Taxicab
0.1%
0.1%
Walked
1.6%
2.6%
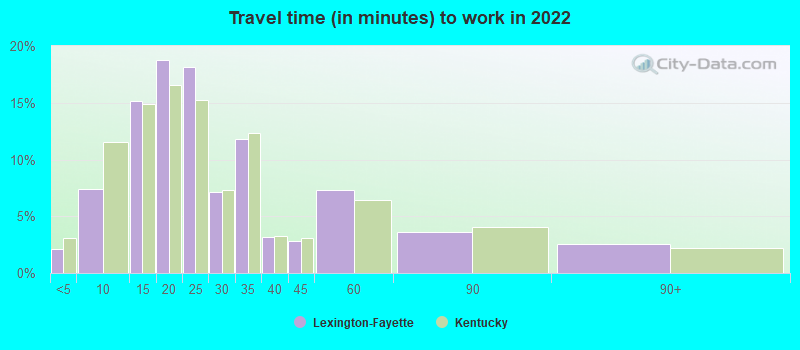
Average travel time to work
Type
San Antonio
Lexington-Fayette
Average
27 min
26.5 min
Other means
23.4 min
20.2 min
Public transportation
43.5 min
35 min
Private vehicle occupancy
Type
San Antonio
Lexington-Fayette
Average
1.2
1.1
Drove alone
84.6%
90.6%
In 2 person carpool
10.4%
7.7%
In 3 person carpool
3.3%
1.2%
In 4 person carpool
1%
0.3%
In 5-6 person carpool
0.6%
0.1%
How many people usually rode to work in the car, truck or van.
Real Estate
The real estate market in San Antonio is dynamic, with a variety of residential, commercial, and rental options. The market is slightly competitive, with home values trending upward. In Lexington, home prices are lower, and the market is less competitive. Both cities offer a mix of urban and suburban living options.
Neighborhoods
San Antonio offers various neighborhoods for different lifestyles, from the bustling Downtown area to the charming, historic district of Alamo Heights. Lexington-Fayette offers a blend of city and country living, with neighborhoods like the recently revitalized Downtown area or the quieter, more family-oriented Beaumont neighborhood.
Houses and residents
Type
San Antonio
Lexington-Fayette
Houses
603,670
147,590
Average household size (people)
2.7
2.3
Median year apartment built
1987
1983
Median year house/condo built
1981
1985
Length of stay in the house since moving in
14.3 years
12 years
Houses occupied
549,245 (91%)
139,303 (94.4%)
Houses occupied by owners
290,123 (52.8%)
75,129 (53.9%)
Houses occupied by renters
259,122 (47.2%)
64,174 (46.1%)
Median rent asked for vacant for-rent units
$1,143
$1,514
Median monthly housing costs
$1,101
$1,026
Median price asked for vacant for-sale houses and condos
$189,213
$229,178
Estimated median house or condo value
$197,600
$242,400
Median numbers of rooms
5.1
5.4
Median number of rooms in apartments
4
4
Median number of rooms in houses and condos
6.2
7
Median house price - detached houses
$238,319
$300,664
Median house price - in 2-unit structures
$407,491
$297,942
Median house price - in 3-to-4-unit structures
$120,363
$165,223
Median house price - in 5 or more unit structures
$163,867
$179,160
Median house price - mobile homes
$105,850
$37,529
Median house price - Townhouses or other attached units
$188,542
$232,720
Median house price - All housing units
$234,615
$289,099
Median house age
37
37
Renting percentage
43.5%
44.1%
Housing density (houses/condos per square mile)
1,481.2
518.7
House value disparities
33.6%
33%
Household income disparities
44.7%
46.3%
Median household income for houses/condes with a mortgage
$87,382
$95,171
Median household income for apartments without a mortgage
$60,785
$74,841
Housing units without a mortgage
5,815 (3.5%)
2,236 (4.2%)
Housing units with both a second mortgage and home equity loan
6,350 (3.8%)
6,457 (12.1%)
Housing units with a mortgage
160,674 (96.5%)
51,182 (95.8%)
Housing units with a home equity loan
129 (0.1%)
156 (0.3%)
Housing units with a second mortgage
7,761 (4.7%)
7,551 (14.1%)
House/condo owner moved in on average (years ago)
13
9
House/condo renter moved in on average (years ago)
1
1
Housing units lacking complete kitchen facilities
2.1%
1.3%
Housing units lacking complete plumbing facilities
1.3%
0.4%
Housing units in structures
Housing units in structures
San Antonio
Lexington-Fayette
One, detached
60.4%
58.7%
One, attached
2.7%
6.4%
Two
2.2%
3.0%
3 or 4
4.9%
4.9%
5 to 9
7.8%
7.5%
10 to 19
8.5%
8.4%
20 to 49
5.4%
4.3%
50 or more
6.6%
5.6%
Mobile homes
1.5%
1.3%
Median real estate property taxes paid for housing units
Self-employed workers in own not incorporated business
46,328
9,814
State government workers
29,486
15,501
Unpaid family workers
657
346
Industries and Occupations
San Antonio's key industries include healthcare, education, and tourism, with occupations spread across these industries. There's also an emphasis on military jobs due to the presence of multiple military bases. Lexington harbors a healthy job market due to its robust agricultural sector, educational institutions, and a growing tech industry.
San Antonio offers highly-rated healthcare systems, including Methodist Healthcare and University Health System. Lexington-Fayette also provides excellent healthcare with leading hospitals such as the University of Kentucky Chandler Hospital and the Baptist Health Lexington.
Health (county statistics)
Type
San Antonio
Lexington-Fayette
General health status score of residents in this county from 1 (poor) to 5 (excellent)
San Antonio has a more robust and modern infrastructure as it is one of the fastest-growing cities in the U.S. It demonstrates excellence in highway connectivity, healthcare facilities, and public utilities. Lexington-Fayette, while smaller, has sound infrastructure appropriate to its size, including a regional airport, good intercity highways, and efficient public utilities.
HMDA - Conventional home purchase loans - Applications denied
Year
San Antonio
Lexington-Fayette
1999
6,847
756
2000
2,930
655
2001
2,383
568
2002
2,313
463
2003
3,759
529
2004
5,180
777
2005
6,554
997
2006
6,983
751
2007
4,562
517
2008
1,781
325
2009
847
230
Culture and Food
With its unique blend of Mexican and Texan culture, San Antonio offers a diverse culinary and cultural scene. Notable events include the San Antonio Stock Show & Rodeo and Fiesta San Antonio. Lexington, known as "Horse Capital of the World," is rich in Southern culture and offers distinct culinary experiences, such as the famous Kentucky bourbon and barbecue.
Sports Teams
San Antonio is home to the NBA's San Antonio Spurs. Other sports include minor league baseball and soccer teams. Lexington-Fayette does not have any major professional sports teams but takes immense local pride in the University of Kentucky's Wildcats basketball and football teams.


 San Antonio, TX
 Lexington-Fayette, KY