San Antonio, Texas, and Santa Ana, California, are both vibrant US cities, each with their unique allure. While San Antonio boasts of a rich cultural heritage, low cost of living, and a vibrant economy, Santa Ana offers an attractive climate, diverse culture, and proximity to many of California's famous attractions. However, both cities also have their considerations in terms of taxes, real estate, and cost of living. The differences and resemblances offer an interesting cross-section of life in both cities.
Distance between
San Antonio, TX and
Santa Ana, CA : 1,175.7 miles
San Antonio's population is larger by 369%. Its population has grown by 307,207 people (26.8%) since 2000. The population of Santa Ana has decreased by 28,536 people (8.4%) during that time.
While both cities work to ensure the safety of their inhabitants, crime rates can vary. San Antonio’s crime rate sits above the national average but varies by neighborhood. On the other hand, Santa Ana also has higher crime rates compared to the national average but has seen a decline in recent years. Both cities have a strong police presence with community outreach programs.
City-data.com crime index counts serious crimes and violent crime more heavily. It adjusts for the number of visitors and daily workers commuting into cities. (higher means more crime, U.S. average = 301.1)
City-data.com crime index counts serious crimes and violent crime more heavily. It adjusts for the number of visitors and daily workers commuting into cities. (higher means more crime, U.S. average = 301.1)
Sex Offenders
According to our data, there are 3,771 registered sex offenders living in San Antonio and 415 registered sex offenders living in . The ratio of residents to sex offenders in San Antonio is 396 to 1; the ratio in Santa Ana is 805 to 1. The number of registered sex offenders compared to the number of residents is larger in San Antonio than in Santa Ana.
Cost of Living
San Antonio's cost of living is lower than the US national average, whereas Santa Ana is higher, influenced by California's high cost of living. Everything from groceries, housing, gas, and healthcare is more expensive in Santa Ana compared to San Antonio.
Income Tax
Texas does not levy a state income tax, which can result in considerable savings for San Antonio residents. In contrast, California has a progressive income tax rate—the maximum being 13.3%.
Property Tax
Property taxes are higher in Texas, with San Antonio's rate being about 1.79% of the assessed home value. In Santa Ana, the property tax rate is lower, averaging 0.73% of a home's assessed value.
Sales Tax
Texas’s sales tax is 6.25% but can reach up to 8.25% with local surtaxes, while California’s state sales tax is at 7.25%, and Santa Ana's rate is 8.25%. Thus, sales tax is comparatively higher in Santa Ana.
Income
Type
San Antonio
Santa Ana
Estimated median household income
$54,923
$80,265
Estimated per capita income
$28,860
$26,691
Cost of living index (U.S. average is 100)
87.7
88.6
If you make $50,000 in San Antonio, you will have to make $50,513 in Santa Ana to maintain the same standard of living.
Geographical Conditions
San Antonio is characterised by its riverside settings, primarily flat with gently rolling hills. Santa Ana is coastal, situated in Southern California, characterised by mild terrain surrounded by mountains and the Pacific Ocean.
Both cities take education seriously. San Antonio is home to more than 20 higher education institutions, including the University of Texas at San Antonio. Santa Ana houses the notable Santa Ana College and is close to renowned universities like UC Irvine. In both locations, public and private schools provide choices for K-12 education.
San Antonio's economy is robust and diverse, with sectors like healthcare, tourism, and military having a massive presence. Conversely, Santa Ana has a vibrant employment scene dominated by industries like education, healthcare, retail and manufacturing. Both cities offer plenty of job opportunities and steady economies.
Biggest Employers
Major employers in San Antonio include USAA, the city's school districts, and the military. For Santa Ana, the school district, county, and Ingram Micro are among the top employers. Both have a good mix of public and private sector employers.
There were 6,567 building permits issued in San Antonio in 2012 (4973 more than in 2011) compared to 231 building permits issued in Santa Ana in 2012 (189 more than in 2011).
In San Antonio (Bexar County), 51.6% voted for Democrats and 47.1% for Republicans in 2012 Presidential Election. In Santa Ana (Orange County), 45.8% voted for Democrats and 52.0% for Republicans.
Elections
Type
Democrats
Republicans
Other
Year
San Antonio
Santa Ana
San Antonio
Santa Ana
San Antonio
Santa Ana
2020
58.3%
53.6%
40.1%
44.6%
1.5%
1.8%
2016
54.2%
50.9%
40.8%
42.4%
5.0%
6.7%
2012
51.6%
45.8%
47.1%
52.0%
1.4%
2.3%
2008
52.3%
47.8%
46.7%
50.3%
1.0%
1.9%
2004
44.5%
39.3%
55.0%
60.2%
0.6%
0.5%
2000
44.9%
40.4%
52.3%
55.9%
2.7%
3.7%
1996
49.7%
37.9%
44.6%
51.7%
5.7%
10.5%
Breakdown of population affiliated with a religious congregation
Type
Adherents
Congregations
Religion
San Antonio
Santa Ana
San Antonio
Santa Ana
CATHOLIC CHURCH
30.8%
26.5%
8.6%
4.4%
SOUTHERN BAPTIST CONVENTION
6.8%
2.3%
23.5%
8.8%
MUSLIM ESTIMATE
1.2%
0.8%
0.8%
1.3%
LUTHERAN CHURCH
0.7%
0.6%
1.0%
2.0%
EPISCOPAL CHURCH
0.6%
0.4%
1.6%
1.4%
EVANGELICAL LUTHERAN CHURCH IN AMERICA
0.6%
0.4%
2.2%
2.3%
SEVENTH DAY ADVENTIST CHURCH
0.2%
0.4%
1.3%
1.3%
Weather
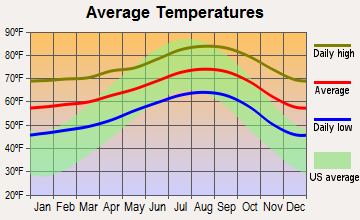
San Antonio experiences more variations in weather, with hot summers and mildly cold winters while Santa Ana enjoys a Mediterranean climate with warm summers and mild winters. Santa Ana’s temperate climate is popular with residents and visitors alike, making it an attractive destination all year round. San Antonio, with its hot summers, may be less comfortable for some.
Weather and climate
Type
San Antonio
Santa Ana
Temperature - Average
68.7°F
65.4°F
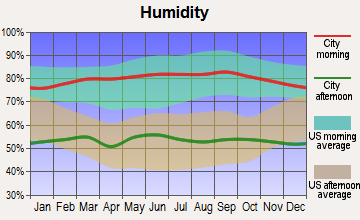
Humidity - Average morning or afternoon humidity
74.9%
69.9%
Humidity - Differences between morning and afternoon humidity
37%
26.2%
Humidity - Maximum monthly morning or afternoon humidity
87%
78.3%
Humidity - Minimum monthly morning or afternoon humidity
50%
52%
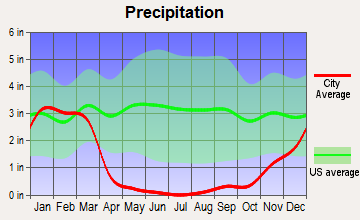
Precipitation - Yearly average
32.2 in
13.8 in
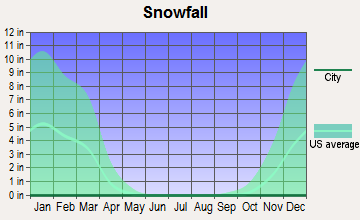
Snowfall - Yearly average
1.2 in
0 in
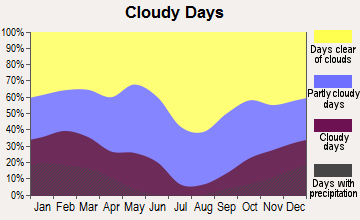
Clouds - Number of days clear of clouds
17.5%
26.5%
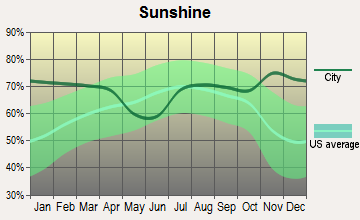
Sunshine amount - Average
62.4%
78.4%
Sunshine amount - Differences during a year
24%
21.9%
Sunshine amount - Maximum monthly
72%
84.8%
Sunshine amount - Minimum monthly
48%
62.9%
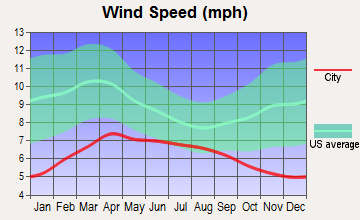
Wind speed - Average
8.9 mph
5.9 mph
Average climate in San Antonio, Texas
Average climate in Santa Ana, California
Air pollution
Type
AQI
CO
NO2
OZONE
PB
PM10
PM25
SO2
Year
San Antonio
Santa Ana
San Antonio
Santa Ana
San Antonio
Santa Ana
San Antonio
Santa Ana
Santa Ana
San Antonio
Santa Ana
San Antonio
Santa Ana
San Antonio
Santa Ana
2018
83
124
N/A
0.34
4.9
14.2
25.6
27.0
N/A
N/A
N/A
27.5
8.0
12.3
0.2
0.7
2017
85
129
N/A
0.35
5.1
13.9
26.9
29.1
N/A
N/A
N/A
26.7
8.4
13.6
1.7
0.5
2016
79
107
N/A
0.35
5.2
12.6
25.7
29.2
N/A
N/A
N/A
24.1
8.2
12.7
0.8
0.2
2015
76
128
N/A
0.32
4.7
13.4
25.4
29.6
N/A
N/A
N/A
25.0
9.2
14.7
0.7
0.2
2014
84
127
N/A
0.29
5.5
13.2
27.3
28.6
N/A
N/A
N/A
26.7
9.5
15.9
0.6
0.4
2013
79
123
N/A
0.34
4.1
13.9
28.2
27.6
0.003
N/A
N/A
28.8
9.0
14.0
0.7
0.3
2012
77
115
N/A
0.31
4.5
12.9
27.5
26.7
0.004
N/A
18.1
27.5
9.2
14.5
N/A
0.1
2011
85
118
N/A
0.31
4.6
14.8
29.2
27.1
0.006
N/A
18.9
27.5
9.9
15.9
N/A
0.7
2010
75
107
0.21
0.34
7.2
14.4
25.8
26.5
0.011
N/A
17.1
23.5
9.2
14.6
N/A
0.6
2009
74
133
0.23
0.35
8.3
16.0
25.7
27.7
0.010
N/A
19.5
24.4
9.8
14.9
0.4
1.1
2008
84
138
0.26
0.38
9.3
17.1
26.8
28.2
0.010
N/A
19.8
30.1
10.1
21.6
0.5
1.1
2007
83
121
0.49
0.36
9.3
17.0
26.3
27.1
0.012
N/A
23.4
N/A
10.3
N/A
N/A
0.8
2006
86
120
0.51
0.40
9.7
17.7
32.7
26.6
0.007
N/A
24.8
N/A
9.8
N/A
N/A
1.3
2005
86
119
0.53
0.40
10.7
18.2
30.8
28.3
0.013
N/A
22.3
N/A
10.1
N/A
N/A
1.3
2004
76
128
0.48
0.50
10.4
19.4
29.6
31.2
0.014
N/A
22.4
N/A
N/A
N/A
N/A
1.6
2003
77
139
0.57
0.64
10.3
22.3
28.5
28.3
0.029
N/A
26.7
N/A
N/A
N/A
N/A
1.1
2002
88
122
0.52
0.66
11.2
22.3
30.3
25.1
0.019
N/A
N/A
N/A
N/A
N/A
N/A
1.7
2001
78
120
0.57
0.76
11.9
22.6
29.3
25.1
0.036
N/A
N/A
N/A
N/A
N/A
N/A
1.5
2000
82
127
0.52
0.80
11.7
25.7
29.6
23.7
0.028
N/A
N/A
N/A
N/A
N/A
N/A
1.9
Natural disasters
Type
San Antonio
Santa Ana
Tornado activity compared to U.S. average
91.5%
19.1%
Earthquake activity compared to U.S. average
73.7%
6,931.4%
Natural disasters compared to U.S. average
21%
32%
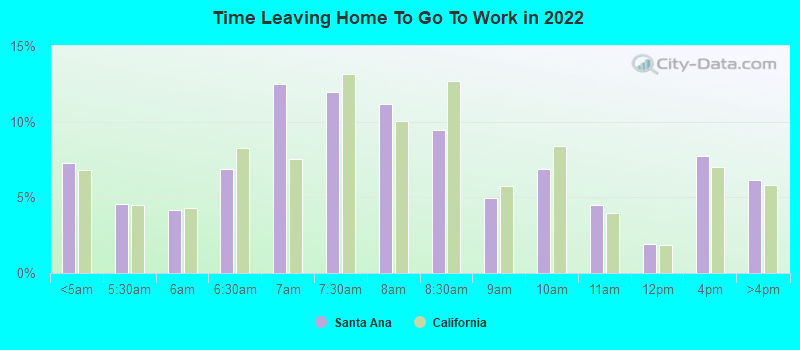
Transportation
San Antonio and Santa Ana have well-developed public transportation systems. San Antonio has an extensive bus network, while Santa Ana offers buses, trains, and ride-shares. Commutes can be longer in Santa Ana due to higher traffic levels common in the Los Angeles metro area.
Transport
Type
San Antonio
Santa Ana
Amtrak stations
1
1
Amtrak stations nearby
1
3
FAA registered aircraft
987
150
FAA registered aircraft manufacturers and dealers
29
15
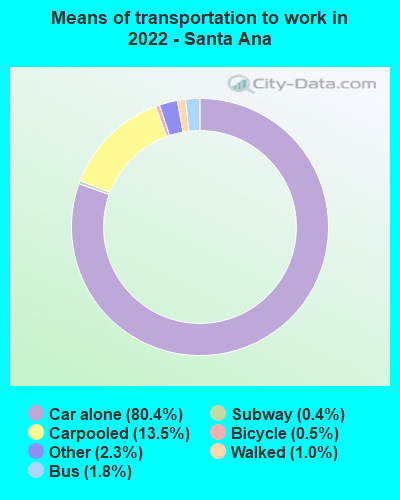
Means of transportation to work
Type
San Antonio
Santa Ana
Bicycle
0.2%
0.2%
Bus
1.6%
0.9%
Carpooled
12.9%
12%
Car alone
81.9%
83.6%
Motorcycle
0.1%
0.1%
Walked
1.6%
1.4%
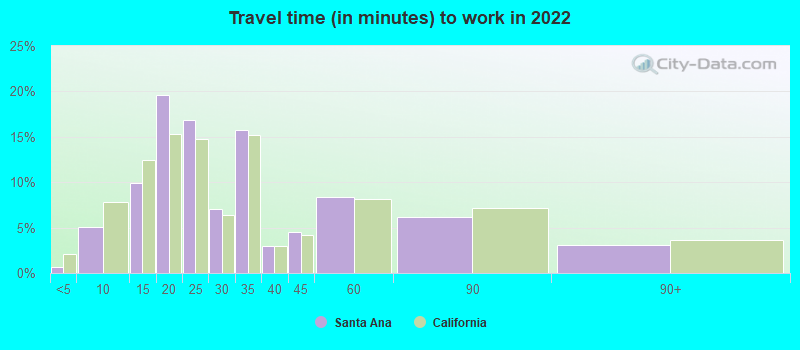
Average travel time to work
Type
San Antonio
Santa Ana
Average
27 min
30.4 min
Other means
23.4 min
25.5 min
Public transportation
43.5 min
48.1 min
Private vehicle occupancy
Type
San Antonio
Santa Ana
Average
1.2
1.2
Drove alone
84.6%
84.6%
In 2 person carpool
10.4%
11.7%
In 3 person carpool
3.3%
2.7%
In 4 person carpool
1%
0.6%
In 5-6 person carpool
0.6%
0.4%
How many people usually rode to work in the car, truck or van.
Real Estate
Real estate is more affordable in San Antonio compared to Santa Ana. Santa Ana's home prices are much higher, reflecting the overall trend in California. Renting is also more expensive in Santa Ana.
Neighborhoods
Both cities have their own distinct neighborhoods. San Antonio features the vibrant downtown area, the historic Alamo Heights, and the family-friendly Stone Oak. Just as diverse, Santa Ana offers the artistic Downtown, the historic Floral Park, and the culturally rich Santa Anita.
Houses and residents
Type
San Antonio
Santa Ana
Houses
603,670
80,604
Average household size (people)
2.7
4.4
Median year apartment built
1987
1974
Median year house/condo built
1981
1962
Length of stay in the house since moving in
14.3 years
15.9 years
Houses occupied
549,245 (91%)
78,674 (97.6%)
Houses occupied by owners
290,123 (52.8%)
35,317 (44.9%)
Houses occupied by renters
259,122 (47.2%)
43,357 (55.1%)
Median rent asked for vacant for-rent units
$1,143
$1,407
Median monthly housing costs
$1,101
$1,836
Median price asked for vacant for-sale houses and condos
$189,213
$976,981
Estimated median house or condo value
$197,600
$623,000
Median numbers of rooms
5.1
4.5
Median number of rooms in apartments
4
3.9
Median number of rooms in houses and condos
6.2
5.6
Median house price - detached houses
$238,319
$724,856
Median house price - in 2-unit structures
$407,491
$512,474
Median house price - in 3-to-4-unit structures
$120,363
$351,406
Median house price - in 5 or more unit structures
$163,867
$406,926
Median house price - mobile homes
$105,850
$125,004
Median house price - Townhouses or other attached units
$188,542
$492,339
Median house price - All housing units
$234,615
$648,392
Median house age
37
53
Renting percentage
43.5%
52.5%
Housing density (houses/condos per square mile)
1,481.2
2,969.6
House value disparities
33.6%
21.7%
Household income disparities
44.7%
40.4%
Median household income for houses/condes with a mortgage
$87,382
$120,617
Median household income for apartments without a mortgage
$60,785
$74,449
Housing units without a mortgage
5,815 (3.5%)
318 (1.2%)
Housing units with both a second mortgage and home equity loan
6,350 (3.8%)
1,175 (4.6%)
Housing units with a mortgage
160,674 (96.5%)
25,378 (98.8%)
Housing units with a home equity loan
129 (0.1%)
23 (0.1%)
Housing units with a second mortgage
7,761 (4.7%)
1,438 (5.6%)
House/condo owner moved in on average (years ago)
13
14
House/condo renter moved in on average (years ago)
1
5
Housing units lacking complete kitchen facilities
2.1%
3.3%
Housing units in structures
Housing units in structures
San Antonio
Santa Ana
One, detached
60.4%
46.4%
One, attached
2.7%
5.8%
Two
2.2%
3.6%
3 or 4
4.9%
7.3%
5 to 9
7.8%
5.7%
10 to 19
8.5%
8.8%
20 to 49
5.4%
6.3%
50 or more
6.6%
11.0%
Mobile homes
1.5%
4.9%
Median real estate property taxes paid for housing units
Self-employed workers in own not incorporated business
46,328
13,591
State government workers
29,486
3,716
Unpaid family workers
657
355
Industries and Occupations
In San Antonio, the healthcare, tourism, and military sectors are prominent. Santa Ana also boasts a similar variety, but with prominence in retail, manufacturing, and education. Both cities provide diverse job opportunities for residents.
San Antonio offers top-rated medical facilities, including the Methodist Hospital and Baptist Medical Center. Similarly, Santa Ana has notable health facilities like the Children’s Hospital of Orange County and UC Irvine Medical Center nearby.
Health (county statistics)
Type
San Antonio
Santa Ana
General health status score of residents in this county from 1 (poor) to 5 (excellent)
San Antonio boasts robust infrastructure, including historical architecture, malls, parks, and an evolving tech scene. Santa Ana, on the other hand, is known for its beautiful architecture, well-planned roads, and infrastructure supporting an active arts and music scene.
Infrastructure
Type
San Antonio
Santa Ana
Hospitals
130
9
TV stations
30
2
Bank branches located here
333
31
Bank institutions located here
41
13
Main business address for public companies
23
15
Drinking water stations with no reported violations in the past
7
0
Drinking water stations with reported violations in the past
HMDA - Conventional home purchase loans - Applications denied
Year
San Antonio
Santa Ana
1999
6,847
955
2000
2,930
834
2001
2,383
725
2002
2,313
933
2003
3,759
1,222
2004
5,180
1,657
2005
6,554
2,302
2006
6,983
2,615
2007
4,562
1,456
2008
1,781
694
2009
847
399
Culture and Food
San Antonio reflects Texas’s cowboy culture, combined with a large Hispanic influence visible in its food, music, and festivals. Santa Ana showcases a rich mix of cultures, resulting in a diverse culinary scene, a robust arts sector, and numerous cultural events.
Sports Teams
San Antonio sports fans enjoy rooting for the NBA's San Antonio Spurs. Santa Ana does not host any major sports teams within the city limits, but residents frequently support the neighbouring Los Angeles and Anaheim teams.


 San Antonio, TX
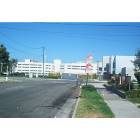
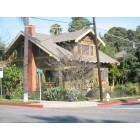
 Santa Ana, CA