San Francisco and Irvine are two contrasting Californian cities with their unique vibes and lifestyles. With San Francisco's iconic culture and bustling lifestyle versus Irvine's quiet suburban setting, the choice to live in or visit these cities might depend on individual preferences and lifestyle requirements. Both cities offer excellent education, business opportunities, and lifestyle features but vary quite a bit in terms of weather, cost of living, economy, and culture.
Distance between
San Francisco, CA and
Irvine, CA : 383.5 miles
San Francisco's population is larger by 164%. Its population has grown by 38,468 people (5.0%) since 2000. The population of Irvine has grown by 165,959 people (116.0%) during that time.
While both San Francisco and Irvine are renowned for their unique lifestyle offerings, they differ dramatically when it comes to crime and safety. Irvine is known to be one of the safest cities in the US, with crime rates well below national averages. This not only attracts families but also makes it a safe city for tourists to visit. On the contrary, San Francisco has higher crime rates, which could be concerning for potential residents and tourists alike. However, San Francisco's crime largely concentrates in specific areas and the city is quite safe in general.
City-data.com crime index counts serious crimes and violent crime more heavily. It adjusts for the number of visitors and daily workers commuting into cities. (higher means more crime, U.S. average = 301.1)
City-data.com crime index counts serious crimes and violent crime more heavily. It adjusts for the number of visitors and daily workers commuting into cities. (higher means more crime, U.S. average = 301.1)
Sex Offenders
According to our data, there are 829 registered sex offenders living in San Francisco and 44 registered sex offenders living in . The ratio of residents to sex offenders in San Francisco is 1,051 to 1; the ratio in Irvine is 6,048 to 1. The number of registered sex offenders compared to the number of residents is much larger in San Francisco than that in Irvine.
Cost of Living
San Francisco is infamous for its high cost of living, primarily due to costly housing. The city has some of the steepest rents and property prices in the country. Groceries, health care, transportation, and almost every other living expense in San Francisco is also significantly higher than in Irvine. Though Irvine is not cheap - it's more expensive than most national averages - it is considerably less expensive than San Francisco.
Income Tax
Both cities, being in California, adhere to the same state income tax rates. The rates are graduated, ranging from 1% to up to 13.3% for the highest income earners.
Property Tax
In both San Francisco and Irvine, the property tax rates hover around the 1% mark of the total assessed property value, being in line with California's Proposition 13.
Sales Tax
The sales tax rates are high in both cities. As of 2021, San Francisco's total sales tax rate is 8.5%, while Irvine has a rate of 7.75%.
Income
Type
San Francisco
Irvine
Estimated median household income
$121,826
$105,774
Estimated per capita income
$80,383
$54,053
Cost of living index (U.S. average is 100)
141.1
89.8
If you make $50,000 in Irvine, you will have to make $78,563 in San Francisco to maintain the same standard of living.
Geographical Conditions
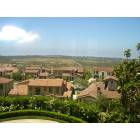
San Francisco is known for its stunning bay, steep rolling hills, and cool summers. Irvine, nestled in the heart of Orange County, offers almost constant sunshine, flat terrain, and close proximity to beaches.
Both cities have a strong commitment to education. San Francisco houses universities like the University of San Francisco and San Francisco State University, while Irvine is home to the University of California, Irvine. The quality of public education is high in both cities, although Irvine often ranks among the top in the nation due to its well-funded schools and dedicated school district.
San Francisco's economy is dynamic and growing, primarily driven by sectors like tech, finance, and tourism. On the flip side, Irvine's economy is bolstered by industries like technology, healthcare, and education. While job opportunities abound in both cities, the average salaries in San Francisco tend to be higher due to the higher cost of living.
Biggest Employers
San Francisco's tech boom has resulted in large companies like Uber, Twitter, and Salesforce calling the city home. Meanwhile, Irvine is a suburban tech hub with companies like Broadcom, Edwards Lifesciences, and Blizzard Entertainment operating out of the city. The University of California, Irvine, is also a significant employer in the city.
There were 33 building permits issued in San Francisco in 2012 (2 more than in 2011) compared to 1,129 building permits issued in Irvine in 2012 (272 more than in 2011).
In San Francisco (San Francisco County), 83.5% voted for Democrats and 13.0% for Republicans in 2012 Presidential Election. In Irvine (Orange County), 45.8% voted for Democrats and 52.0% for Republicans.
Elections
Type
Democrats
Republicans
Other
Year
San Francisco
Irvine
San Francisco
Irvine
San Francisco
Irvine
2020
85.3%
53.6%
12.7%
44.6%
2.0%
1.8%
2016
84.6%
50.9%
9.2%
42.4%
6.2%
6.7%
2012
83.5%
45.8%
13.0%
52.0%
3.4%
2.3%
2008
84.4%
47.8%
13.7%
50.3%
2.0%
1.9%
2004
83.0%
39.3%
15.2%
60.2%
1.8%
0.5%
2000
75.7%
40.4%
16.1%
55.9%
8.1%
3.7%
1996
72.2%
37.9%
15.7%
51.7%
12.1%
10.5%
Breakdown of population affiliated with a religious congregation
Type
Adherents
Congregations
Religion
San Francisco
Irvine
San Francisco
Irvine
CATHOLIC CHURCH
15.0%
26.5%
9.6%
4.4%
EPISCOPAL CHURCH
0.8%
0.4%
3.5%
1.4%
MUSLIM ESTIMATE
0.8%
0.8%
1.2%
1.3%
SOUTHERN BAPTIST CONVENTION
0.7%
2.3%
8.4%
8.8%
AMERICAN BAPTIST CHURCHES IN THE USA
0.6%
0.2%
2.5%
1.7%
EVANGELICAL LUTHERAN CHURCH IN AMERICA
0.2%
0.4%
1.7%
2.3%
LUTHERAN CHURCH
0.2%
0.6%
1.5%
2.0%
REFORMED CHURCH IN AMERICA
0.2%
0.3%
0.2%
0.2%
SEVENTH DAY ADVENTIST CHURCH
0.2%
0.4%
1.9%
1.3%
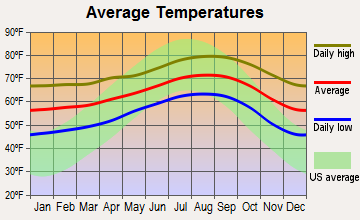
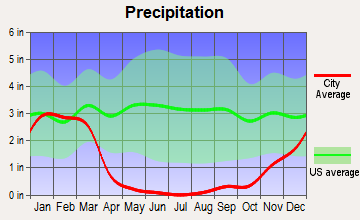
Weather
The weather varies significantly between these two cities. San Francisco is known for its cool and foggy weather, with moderate temperatures throughout the year. Additionally, sudden changes in weather are common, leading to a saying, "the coldest winter I ever spent was a summer in San Francisco". Irvine, on the other hand, enjoys a Mediterranean climate with hot, dry summers and mild, wet winters. This sunny weather may be more enticing for those who enjoy outdoor activities.
Weather and climate
Type
San Francisco
Irvine
Temperature - Average
58.3°F
63.6°F
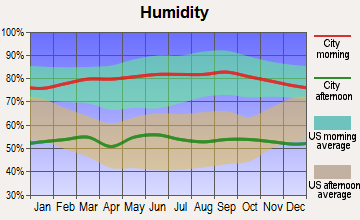
Humidity - Average morning or afternoon humidity
84.3%
69.5%
Humidity - Differences between morning and afternoon humidity
29%
25.7%
Humidity - Maximum monthly morning or afternoon humidity
91%
77.7%
Humidity - Minimum monthly morning or afternoon humidity
62%
52%
Precipitation - Yearly average
22.2 in
13.1 in
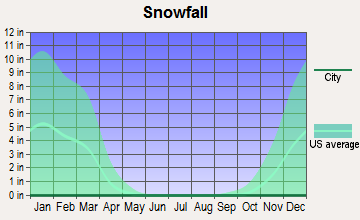
Snowfall - Yearly average
0 in
0 in
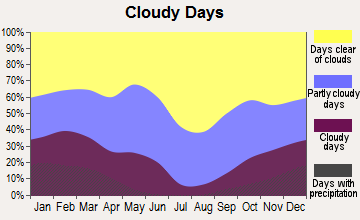
Clouds - Number of days clear of clouds
26.8%
26.6%
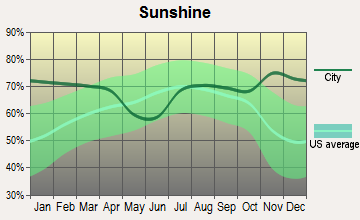
Sunshine amount - Average
73%
78.3%
Sunshine amount - Differences during a year
22%
21.7%
Sunshine amount - Maximum monthly
77%
84.4%
Sunshine amount - Minimum monthly
55%
62.7%
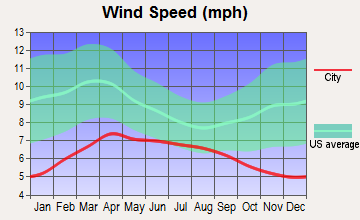
Wind speed - Average
11.4 mph
5.7 mph
Average climate in San Francisco, California
Average climate in Irvine, California
Air pollution
Type
AQI
CO
NO2
OZONE
PB
PM10
PM25
SO2
Year
San Francisco
Irvine
San Francisco
Irvine
San Francisco
Irvine
San Francisco
Irvine
San Francisco
Irvine
Irvine
San Francisco
Irvine
San Francisco
Irvine
2018
104
119
0.35
0.25
11.3
13.5
23.4
31.5
0.012
N/A
27.5
N/A
11.9
12.5
0.4
N/A
2017
96
116
0.40
0.27
11.4
13.1
22.5
32.5
0.008
N/A
26.7
N/A
9.9
13.7
0.6
N/A
2016
68
102
0.39
0.24
10.6
11.6
22.4
31.6
0.005
N/A
24.1
N/A
7.9
12.6
0.8
0.1
2015
85
104
0.41
0.21
12.1
12.6
22.5
31.3
0.004
N/A
25.0
N/A
7.9
14.6
0.8
0.1
2014
85
109
0.38
0.20
12.1
12.3
21.8
30.1
0.005
N/A
26.7
N/A
7.7
15.8
0.6
0.3
2013
88
107
0.40
0.25
13.9
13.1
20.4
28.8
0.004
0.003
29.2
N/A
10.2
14.1
0.5
0.2
2012
75
103
0.40
0.28
12.8
12.1
22.7
28.1
0.003
0.004
27.9
N/A
8.2
14.4
1.1
0.1
2011
86
109
0.24
0.24
14.1
13.8
21.3
28.6
0.003
0.006
27.6
N/A
9.5
15.9
1.7
0.3
2010
84
102
0.21
0.27
13.4
13.4
22.0
28.4
0.004
0.011
23.6
N/A
10.6
14.3
1.0
0.6
2009
95
118
0.30
0.26
15.1
15.3
20.4
29.3
0.005
0.009
24.3
N/A
12.8
14.7
1.1
1.1
2008
94
124
0.43
0.33
15.6
16.0
21.7
29.8
0.007
0.008
29.7
N/A
11.7
21.6
0.9
1.1
2007
84
100
0.45
0.31
15.6
15.9
20.5
28.6
0.007
0.010
N/A
N/A
8.9
N/A
1.2
0.8
2006
86
109
0.52
0.36
16.1
16.7
21.5
28.1
N/A
0.005
N/A
N/A
8.7
N/A
1.6
1.3
2005
89
91
0.39
0.35
14.8
17.0
20.5
28.8
N/A
0.011
N/A
N/A
8.8
N/A
1.3
1.3
2004
93
118
0.44
0.42
16.1
18.3
20.9
31.8
0.004
0.012
N/A
N/A
11.2
N/A
2.5
1.6
2003
65
116
0.64
0.53
18.4
21.1
19.7
29.9
N/A
0.046
N/A
N/A
N/A
N/A
1.7
1.1
2002
62
103
0.69
0.54
18.6
20.7
19.6
26.5
0.008
0.010
N/A
N/A
N/A
N/A
1.4
1.6
2001
64
109
0.72
0.65
19.2
20.7
19.0
26.5
0.008
0.011
N/A
N/A
N/A
N/A
1.4
1.4
2000
60
116
0.71
0.67
20.3
23.6
17.1
24.1
0.017
0.016
N/A
N/A
N/A
N/A
2.0
1.9
Natural disasters
Type
San Francisco
Irvine
Tornado activity compared to U.S. average
7.7%
18.7%
Earthquake activity compared to U.S. average
7,468.1%
6,900.9%
Natural disasters compared to U.S. average
6%
32%
Transportation
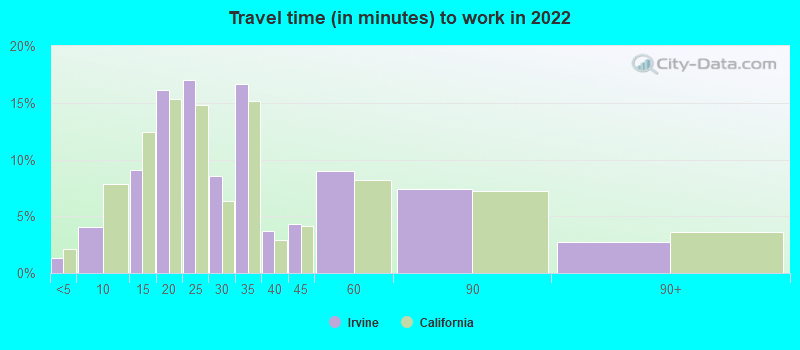
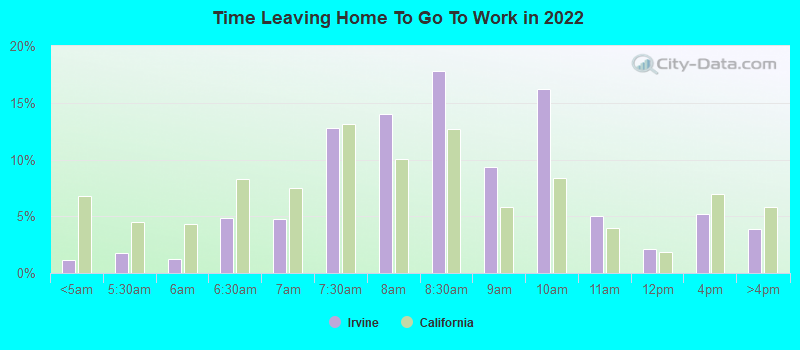
San Francisco's public transportation system, including BART and MUNI, is well-established and extensively covers the city, making it doable to live without a car. Meanwhile, Irvine has the Irvine Station for train services, but the city is less walkable, and a car is more or less a necessity.
Transport
Type
San Francisco
Irvine
Amtrak stations
4
1
Amtrak stations nearby
3
3
FAA registered aircraft
453
173
FAA registered aircraft manufacturers and dealers
9
2
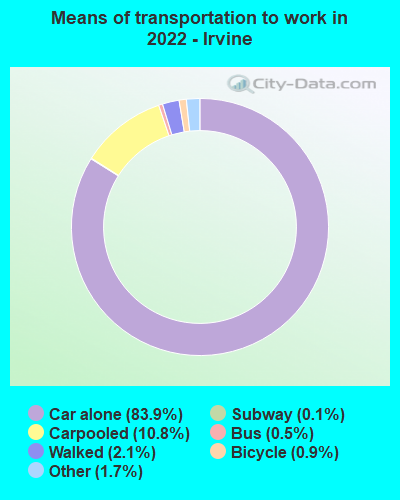
Means of transportation to work
Type
San Francisco
Irvine
Bicycle
2.7%
1.2%
Bus
11.4%
0.2%
Carpooled
9.1%
9.5%
Car alone
53.9%
84.4%
Ferryboat
0.4%
0%
Motorcycle
0.9%
0.2%
Railroad
0.7%
0.1%
Streetcar
7.9%
0%
Subway
1.6%
0.1%
Taxicab
0.4%
0%
Walked
8.3%
2.2%
Average travel time to work
Type
San Francisco
Irvine
Average
38 min
30.7 min
Other means
28.3 min
23.7 min
Public transportation
39.7 min
42.7 min
Private vehicle occupancy
Type
San Francisco
Irvine
Average
1.2
1.1
Drove alone
85.5%
90.2%
In 2 person carpool
10.1%
7.8%
In 3 person carpool
3.2%
1.2%
In 4 person carpool
0.9%
0.4%
In 5-6 person carpool
0.2%
0.3%
In 7+ person carpool
0.1%
0.1%
How many people usually rode to work in the car, truck or van.
Real Estate
San Francisco’s real estate market is renowned for its high prices and competitive bidding processes. On the other hand, while home prices in Irvine are above the national average, they are significantly more cost-effective compared to San Francisco.
Neighborhoods
San Francisco boasts numerous distinct neighborhoods, from the trendy Mission District to the posh Pacific Heights. On the other hand, Irvine is a master-planned city with safe, well-structured neighborhoods, known for their cleanliness and family-friendly environment.
Houses and residents
Type
San Francisco
Irvine
Houses
412,269
122,260
Average household size (people)
2.3
2.6
Median year apartment built
1953
2000
Median year house/condo built
1942
1996
Length of stay in the house since moving in
16.3 years
11.4 years
Houses occupied
350,796 (85.1%)
111,648 (91.3%)
Houses occupied by owners
140,809 (40.1%)
49,861 (44.7%)
Houses occupied by renters
209,987 (59.9%)
61,787 (55.3%)
Median rent asked for vacant for-rent units
$3,809
$3,151
Median monthly housing costs
$2,337
$2,500
Median price asked for vacant for-sale houses and condos
$1,670,841
$948,000
Estimated median house or condo value
Over $1,000,000
$970,500
Median numbers of rooms
3.9
4.5
Median number of rooms in apartments
3.2
3.8
Median number of rooms in houses and condos
5.6
5.9
Median house price - detached houses
Over $1,000,000
Over $1,000,000
Median house price - in 2-unit structures
Over $1,000,000
$860,411
Median house price - in 3-to-4-unit structures
Over $1,000,000
$621,769
Median house price - in 5 or more unit structures
Over $1,000,000
$678,675
Median house price - mobile homes
$517,939
$398,841
Median house price - Townhouses or other attached units
Over $1,000,000
$825,112
Median house price - All housing units
Over $1,000,000
Over $1,000,000
Median house age
76
21
Renting percentage
64.2%
49.8%
Housing density (houses/condos per square mile)
8,829.1
2,647.3
House value disparities
18.7%
18.8%
Household income disparities
41.7%
41.8%
Median household income for houses/condes with a mortgage
$210,544
$185,171
Median household income for apartments without a mortgage
$99,969
$97,123
Housing units without a mortgage
1,778 (1.9%)
316 (1%)
Housing units with both a second mortgage and home equity loan
7,687 (8.3%)
2,738 (8.4%)
Housing units with a mortgage
91,236 (98.1%)
32,261 (99%)
Housing units with a home equity loan
471 (0.5%)
0 (0%)
Housing units with a second mortgage
9,395 (10.1%)
3,066 (9.4%)
House/condo owner moved in on average (years ago)
14
8
House/condo renter moved in on average (years ago)
4
1
Housing units lacking complete kitchen facilities
4.7%
2.2%
Housing units lacking complete plumbing facilities
2.7%
0.1%
Housing units in structures
Housing units in structures
San Francisco
Irvine
One, detached
19.1%
37.3%
One, attached
12.1%
20.1%
Two
9.0%
1.1%
3 or 4
11.4%
4.5%
5 to 9
9.0%
5.9%
10 to 19
9.3%
5.1%
20 to 49
11.3%
5.0%
50 or more
18.7%
20.0%
Mobile homes
0.1%
0.8%
Boats, RVs, vans, etc.
0.0%
0.1%
Median real estate property taxes paid for housing units
Self-employed workers in own not incorporated business
30,288
9,200
State government workers
22,691
9,735
Unpaid family workers
399
399
Industries and Occupations
The prominent industries in San Francisco are technology, healthcare, finance, and tourism. Similarly, Irvine boasts strength in the technology sector, as well as a strong presence in the healthcare, finance, and education fields.
Both cities have high-quality healthcare facilities. San Francisco's hospitals, like the UCSF Medical Center and San Francisco General Hospital, are nationally ranked. Irvine also has high-ranking healthcare systems, particularly the UCI Health system.
Health (county statistics)
Type
San Francisco
Irvine
General health status score of residents in this county from 1 (poor) to 5 (excellent)
San Francisco is known for its iconic and historic infrastructure, including the Golden Gate Bridge and cable car system. However, concerns have been raised about the city's aging and increasingly strained infrastructure. Conversely, Irvine, being a relatively newer and planned city, boasts modern infrastructure with an ample amount of parks and open spaces.
Infrastructure
Type
San Francisco
Irvine
Hospitals
16
4
TV stations
18
2
Arenas or stadiums
2
1
Bank branches located here
281
98
Bank institutions located here
52
47
Main business address for public companies
68
65
Nuclear power plants nearby
0
2
Drinking water stations with no reported violations in the past
5
0
Drinking water stations with reported violations in the past
HMDA - Conventional home purchase loans - Applications denied
Year
San Francisco
Irvine
1999
1,402
704
2000
1,000
417
2001
733
271
2002
870
242
2003
1,576
609
2004
2,147
835
2005
2,344
899
2006
2,511
897
2007
2,117
576
2008
1,575
344
2009
952
210
Culture and Food
San Francisco boasts a rich cultural scene with numerous art galleries, museums, music festivals, and food spots. The city has made noteworthy contributions to the arts and counterculture movements. Irvine, while quieter, has a rapidly growing cultural scene and a diverse food landscape catering to various Asian cuisines, reflecting its multicultural population.
Sports Teams
San Francisco is home to professional sports teams like the San Francisco 49ers (NFL) and Giants (MLB). In contrast, Irvine doesn't have major professional teams but is close to Anaheim, home to the Angels (MLB) and Ducks (NHL).


 San Francisco, CA
 Irvine, CA