San Francisco, CA, and Staten Island, NY, are two vibrant American cities on opposite coasts of the country. Both offer unique opportunities and challenges to residents and tourists alike. In this comparison, we'll delve into numerous facets of each city, including safety, weather, cost of living, education, economy, and more. This comprehensive examination will provide an invaluable guide for those considering moving to either city and help tourists understand what they might expect when they visit.
San Francisco has higher crime rates compared to Staten Island. While no city is free of crime, the rates in San Francisco, especially for property crime, are notably higher. Staten Island, being one of the five boroughs of New York City, experiences crime but at a lower rate - making it relatively safer. Tourists visiting either city should be cautious and informed, as with any tourist location.
Cost of Living
San Francisco consistently sports one of the highest costs of living in the United States. High housing costs are the main culprit, followed by transportation and food. In comparison, Staten Island is significantly more affordable — though still expensive in relation to other US cities. However, due to lower housing costs compared to the rest of New York City, Staten Island offers a more affordable option for living in the New York metropolitan area.
Income Tax
California’s top marginal income tax rate of 13.3% is the highest in the U.S. While New York also has high state taxes (up to 8.82%), being in New York City adds an additional tax, bringing the top rate to approximately 12.7% for Staten Island inhabitants.
Property Tax
New York City, and subsequently Staten Island, has lower property tax rates when compared to most of the nation, averaging around 0.88%. On the other hand, San Francisco has a higher property tax rate, usually over 1%. Both rates, however, are lower than the national average of 1.07%.
Sales Tax
Both cities have similar sales tax rates. San Francisco, California, has a combined city/state sales tax rate of 8.5%. Staten Island, being a part of New York City, has a total sales tax rate of 8.875%. For both residents and tourists, the slight difference in tax may have minimal impact on overall living costs.
Income
Type
San Francisco
Staten Island
Estimated median household income
$121,826
$86,054
Estimated per capita income
$80,383
$38,678
Cost of living index (U.S. average is 100)
141.1
164.1
If you make $50,000 in San Francisco, you will have to make $58,150 in Staten Island to maintain the same standard of living.
Geographical Conditions
San Francisco boasts a picturesque bay setting, with steep rolling hills and cool maritime climate; however, it's also located on the San Andreas fault line, increasing the city's risk of earthquakes. Staten Island is a mix of suburban and urban settings, with a number of beaches, parklands, and the remarkable Greenbelt - a continuous group of parks and natural areas in the heart of the island. However, being an island, it is also susceptible to flooding issues during heavy rain and storms.
Geographical information
Type
San Francisco
Staten Island
Land area
46.7 sq. miles
58.5 sq. miles
Population density
17,458 people per sq. mile
8,225.7 people per sq. mile
Relative area comparison
San Francisco, CA Staten Island, NY
Education
Both cities boast strong educational systems. San Francisco is home to top-rated universities, including the University of California, San Francisco. Additionally, public and private schools in the Bay Area are known for their quality. Staten Island has less prestigious universities, but its access to the vast number of world-class institutions in nearby Manhattan is a considerable advantage. Staten Island's public school system is also part of the greater New York City Department of Education, the largest school system in the nation.
San Francisco's economy is booming, driven by the tech industry. It's home to many large tech companies like Twitter, Uber, and Salesforce, along with numerous start-ups. The job market is competitive but offers high salaries. Staten Island's economy is more diverse, with jobs spread across several industries like healthcare, retail, and education. Staten Island residents often commute to Manhattan for work, broadening their job prospects.
Biggest Employers
In San Francisco, the largest employers are the City of San Francisco, Salesforce, and UCSF. Other notable employers include Twitter, Yelp, and GAP. The Staten Island University Hospital and Richmond University Medical Center lead the way as the top employers on Staten Island, along with the city government and education sectors.
In San Francisco (San Francisco County), 83.5% voted for Democrats and 13.0% for Republicans in 2012 Presidential Election. In Staten Island (Richmond County), 50.8% voted for Democrats and 48.3% for Republicans.
Elections
Type
Democrats
Republicans
Other
Year
San Francisco
Staten Island
San Francisco
Staten Island
San Francisco
Staten Island
2020
85.3%
42.2%
12.7%
57.1%
2.0%
0.7%
2016
84.6%
41.0%
9.2%
56.1%
6.2%
2.9%
2012
83.5%
50.8%
13.0%
48.3%
3.4%
0.9%
2008
84.4%
47.8%
13.7%
51.9%
2.0%
0.4%
2004
83.0%
42.8%
15.2%
56.5%
1.8%
0.7%
2000
75.7%
52.1%
16.1%
45.1%
8.1%
2.9%
1996
72.2%
50.5%
15.7%
40.8%
12.1%
8.7%
Breakdown of population affiliated with a religious congregation
Type
Adherents
Congregations
Religion
San Francisco
Staten Island
San Francisco
Staten Island
CATHOLIC CHURCH
15.0%
54.2%
9.6%
20.6%
EPISCOPAL CHURCH
0.8%
0.4%
3.5%
5.0%
MUSLIM ESTIMATE
0.8%
1.7%
1.2%
3.0%
SOUTHERN BAPTIST CONVENTION
0.7%
0.2%
8.4%
3.5%
AMERICAN BAPTIST CHURCHES IN THE USA
0.6%
0.6%
2.5%
1.0%
EVANGELICAL LUTHERAN CHURCH IN AMERICA
0.2%
0.6%
1.7%
4.0%
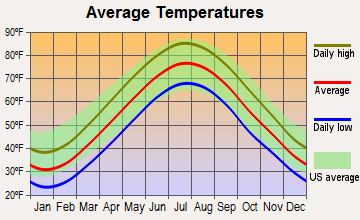
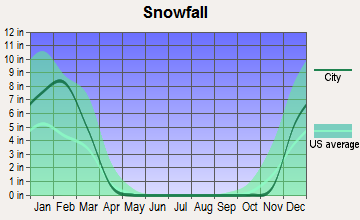
Weather
The climates in these cities are vastly different. San Francisco's Bay Area is known for its mild, foggy climate. Even in the summer, temperatures will rarely rise above 75 degrees Fahrenheit. Staten Island's weather, however, is quite the opposite with hot and humid summers and cold winters. The island experiences all four seasons, delivering a greater variety of weather for both residents and tourists.
Weather and climate
Type
San Francisco
Staten Island
Temperature - Average
58.3°F
54.1°F
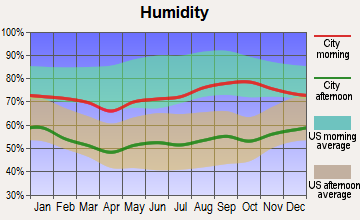
Humidity - Average morning or afternoon humidity
84.3%
67.4%
Humidity - Differences between morning and afternoon humidity
29%
29.9%
Humidity - Maximum monthly morning or afternoon humidity
91%
77%
Humidity - Minimum monthly morning or afternoon humidity
62%
47.2%
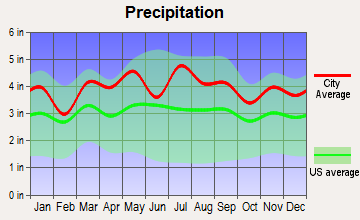
Precipitation - Yearly average
22.2 in
47.4 in
Snowfall - Yearly average
0 in
60 in
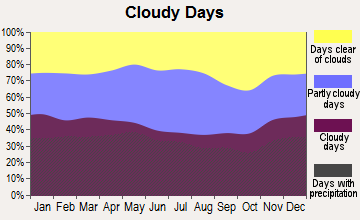
Clouds - Number of days clear of clouds
26.8%
15.8%
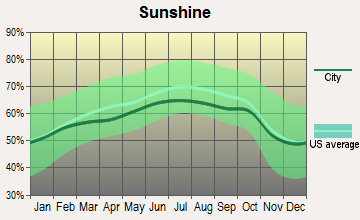
Sunshine amount - Average
73%
60.2%
Sunshine amount - Differences during a year
22%
20%
Sunshine amount - Maximum monthly
77%
64%
Sunshine amount - Minimum monthly
55%
44%
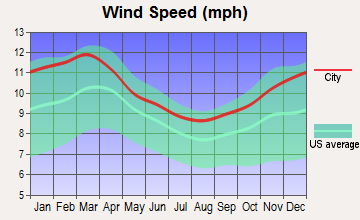
Wind speed - Average
11.4 mph
10.5 mph
Average climate in San Francisco, California
Average climate in Staten Island, New York
Air pollution
Type
AQI
CO
NO2
OZONE
PB
PM10
PM25
SO2
Year
San Francisco
Staten Island
San Francisco
Staten Island
San Francisco
Staten Island
San Francisco
Staten Island
San Francisco
Staten Island
Staten Island
San Francisco
Staten Island
San Francisco
Staten Island
2018
104
94
0.35
0.35
11.3
17.1
23.4
24.1
0.012
N/A
N/A
N/A
11.9
7.9
0.4
0.4
2017
96
98
0.40
0.32
11.4
17.0
22.5
27.0
0.008
N/A
N/A
N/A
9.9
7.6
0.6
0.2
2016
68
94
0.39
0.37
10.6
17.9
22.4
28.5
0.005
N/A
N/A
N/A
7.9
7.7
0.8
0.2
2015
85
102
0.41
0.39
12.1
18.9
22.5
27.3
0.004
N/A
N/A
N/A
7.9
8.6
0.8
0.4
2014
85
97
0.38
0.38
12.1
19.2
21.8
25.6
0.005
N/A
N/A
N/A
7.7
8.3
0.6
0.7
2013
88
99
0.40
0.39
13.9
19.6
20.4
27.8
0.004
N/A
N/A
N/A
10.2
8.5
0.5
0.8
2012
75
102
0.40
0.42
12.8
19.3
22.7
26.9
0.003
N/A
N/A
N/A
8.2
9.2
1.1
1.4
2011
86
108
0.24
0.42
14.1
21.4
21.3
28.1
0.003
N/A
N/A
N/A
9.5
10.2
1.7
2.0
2010
84
114
0.21
0.40
13.4
19.9
22.0
28.7
0.004
N/A
N/A
N/A
10.6
9.4
1.0
1.8
2009
95
105
0.30
0.39
15.1
22.5
20.4
25.3
0.005
N/A
N/A
N/A
12.8
9.5
1.1
2.4
2008
94
111
0.43
0.39
15.6
23.0
21.7
24.3
0.007
0.013
N/A
N/A
11.7
11.3
0.9
3.4
2007
84
123
0.45
0.44
15.6
24.2
20.5
23.3
0.007
0.016
N/A
N/A
8.9
12.0
1.2
4.3
2006
86
117
0.52
0.55
16.1
25.6
21.5
24.7
N/A
0.018
N/A
N/A
8.7
13.1
1.6
5.3
2005
89
112
0.39
0.69
14.8
27.3
20.5
23.3
N/A
N/A
N/A
N/A
8.8
N/A
1.3
7.3
2004
93
109
0.44
0.68
16.1
26.4
20.9
22.2
0.004
0.030
N/A
N/A
11.2
N/A
2.5
6.9
2003
65
112
0.64
0.76
18.4
28.0
19.7
22.1
N/A
0.006
26.9
N/A
N/A
N/A
1.7
7.1
2002
62
125
0.69
0.74
18.6
30.6
19.6
24.7
0.008
0.008
26.1
N/A
N/A
N/A
1.4
6.6
2001
64
124
0.72
0.81
19.2
32.4
19.0
24.9
0.008
0.020
26.9
N/A
N/A
N/A
1.4
7.2
2000
60
116
0.71
0.93
20.3
33.0
17.1
23.1
0.017
0.022
22.2
N/A
N/A
N/A
2.0
7.2
Natural disasters
Type
San Francisco
Staten Island
Tornado activity compared to U.S. average
7.7%
61.3%
Earthquake activity compared to U.S. average
7,468.1%
31.2%
Natural disasters compared to U.S. average
6%
19%
Transportation
San Francisco has a robust public transportation system, including BART, MUNI buses, and the world-famous cable cars. However, it struggles with congestion due to its dense population. In contrast, Staten Island's public transportation system is less extensive. The Island relies heavily on buses and the Staten Island Ferry for commuting. It's the only borough in NYC without a connection to the subway system, so many residents often use private cars for transportation.
Transport
Type
San Francisco
Staten Island
Amtrak stations
4
0
Amtrak stations nearby
3
3
FAA registered aircraft
453
39
FAA registered aircraft manufacturers and dealers
9
2
Means of transportation to work
Type
San Francisco
Staten Island
Bicycle
2.7%
0.2%
Bus
11.4%
19.2%
Carpooled
9.1%
12.1%
Car alone
53.9%
54.3%
Ferryboat
0.4%
5.3%
Motorcycle
0.9%
0.1%
Railroad
0.7%
0.9%
Streetcar
7.9%
0%
Subway
1.6%
2.6%
Taxicab
0.4%
0.4%
Walked
8.3%
2.9%
Average travel time to work
Type
San Francisco
Staten Island
Average
38 min
45.3 min
Real Estate
San Francisco is known for its costly real estate, owing largely to its picturesque location and thriving job market. Housing is very expensive, and prices continue to climb. Meanwhile, Staten Island offers more affordable options within the NYC metro area, making it an appealing option for individuals and families looking for a more suburban feel without leaving the city.
Neighborhoods
San Francisco's neighborhoods range from the hipster Mission district to the picturesque, upscale neighborhoods of Pacific Heights and Marina. Staten Island's neighborhoods like St. George, Stapleton, and Tottenville offer more of a suburban, community feel. Tottenville, the southernmost point in New York State, is famous for its historic and picturesque streetscapes.
Houses and residents
Type
San Francisco
Staten Island
Houses
412,269
163,993
Average household size (people)
2.3
2.8
Houses occupied
350,796 (85.1%)
156,341 (95.3%)
Houses occupied by owners
140,809 (40.1%)
99,732 (63.8%)
Houses occupied by renters
209,987 (59.9%)
56,609 (36.2%)
Median rent asked for vacant for-rent units
$3,809
$1,320
Median price asked for vacant for-sale houses and condos
$1,670,841
$369,853
Estimated median house or condo value
Over $1,000,000
$605,500
Median number of rooms in apartments
3.2
3.9
Median number of rooms in houses and condos
5.6
6.1
Renting percentage
64.2%
35.9%
Housing density (houses/condos per square mile)
8,829.1
2,804.3
Household income disparities
41.7%
43.8%
Housing units without a mortgage
1,778 (1.9%)
19,289 (25%)
Housing units with both a second mortgage and home equity loan
7,687 (8.3%)
160 (0.2%)
Housing units with a mortgage
91,236 (98.1%)
57,986 (75%)
Housing units with a home equity loan
471 (0.5%)
5,623 (7.3%)
Housing units with a second mortgage
9,395 (10.1%)
4,499 (5.8%)
Housing units lacking complete kitchen facilities
4.7%
0.6%
Housing units lacking complete plumbing facilities
Self-employed workers in own not incorporated business
30,288
7,611
State government workers
22,691
6,285
Unpaid family workers
399
394
Industries and Occupations
Tech is the leading industry in San Francisco, followed by healthcare, finance, and education. The high-tech job market causes a high demand for jobs in these sectors. Conversely, Staten Island's economy is more diverse. Healthcare is the most significant industry, followed by retail trade and educational services.
San Francisco offers top-notch healthcare facilities, with hospitals like UCSF Medical Center and Kaiser Permanente known nationally for their high standards. Staten Island, while smaller, still offers quality healthcare through systems like the Staten Island University Hospital.
San Francisco's infrastructure is well-developed, but struggles with maintaining its aging systems and accommodating its population growth. The city is also prone to earthquakes which pose a continual challenge. Staten Island, though smaller, has similar issues with aging infrastructure but offers spacious homes and yards not typically found in other NYC boroughs. Staten Island is also the only New York City borough without a subway system, making it less accessible compared to the rest of the city.
Infrastructure
Type
San Francisco
Staten Island
Hospitals
16
25
TV stations
18
30
Bank branches located here
281
104
Bank institutions located here
52
19
Main business address for public companies
68
1
Drinking water stations with no reported violations in the past
5
1
Drinking water stations with reported violations in the past
10
3
Schools
School facilities
Type
San Francisco
Staten Island
Private elementary/middle schools
54
22
Private high schools
33
13
Public elementary/middle schools
90
63
Public high schools
31
16
Colleges/Universities
23
5
Culture and Food
Both San Francisco and Staten Island have rich cultural landscapes. San Francisco is a diverse culinary city, well regarded for its seafood, sourdough bread, and the famous Mission-style burrito. It also boasts a vibrant nightlife and thriving arts scene. Staten Island combines the diversity of NYC cuisine with its unique Italian influence. The island is also known for its distinct cultural landmarks like the Snug Harbor Cultural Center, the Richmond County Bank Ballpark, and the St. George Theatre.
Sports Teams
San Francisco is home to major league sports teams – the Giants (MLB) and the 49ers (NFL). Other teams like the Golden State Warriors (NBA) and the San Jose Sharks (NHL) are nearby. Staten Island doesn't house any major league sports teams but is a short commute from the numerous New York City teams, including the Yankees (MLB), Mets (MLB), Knicks (NBA), Nets (NBA), Giants (NFL), and Jets (NFL).


 San Francisco, CA
 Staten Island, NY