When considering a notable comparison between San Jose, the capital of Silicon Valley and Bakersfield, dubbed as the country music capital of the West Coast. There indeed are some contrasts but also units that make both unique in their ways. From cost of living, climate, among other factors, you'll find varying experiences. This comprehensive breakdown provides a sneak into what life in both cities looks like.
Distance between
San Jose, CA and
Bakersfield, CA : 207.6 miles
San Jose's population is larger by 141%. Its population has grown by 88,546 people (9.9%) since 2000. The population of Bakersfield has grown by 160,558 people (65.0%) during that time.
San Jose and Bakersfield have different crime rates. Although neither city is completely free of crime, San Jose tends to be safer than Bakersfield. San Jose's crime rate is below the national average. It is one of California's safer cities when compared to others of its size. Bakersfield, on the other hand, has a crime rate above the national average. Relocators and tourists should consider their safety first when moving to or visiting either of these cities.
City-data.com crime index counts serious crimes and violent crime more heavily. It adjusts for the number of visitors and daily workers commuting into cities. (higher means more crime, U.S. average = 301.1)
City-data.com crime index counts serious crimes and violent crime more heavily. It adjusts for the number of visitors and daily workers commuting into cities. (higher means more crime, U.S. average = 301.1)
Sex Offenders
According to our data, there are 1,806 registered sex offenders living in San Jose and 1,108 registered sex offenders living in . The ratio of residents to sex offenders in San Jose is 568 to 1; the ratio in Bakersfield is 340 to 1. The number of registered sex offenders compared to the number of residents is a smaller in San Jose than in Bakersfield.
Cost of Living
In terms of cost of living, San Jose ranks much higher, largely due to housing costs. The median home price in San Jose is significantly higher than Bakersfield. Other costs such as groceries, health care and transportation are also slightly higher in San Jose than in Bakersfield, making overall living expenses more costly in San Jose. For individuals considering relocation, San Jose would require a higher budget.
Income Tax
California's income tax applies uniformly across the state, affecting both cities equally. The rate ranges from 1% to 13.3% based on income, the highest state income tax in the nation.
Property Tax
Both cities are subject to California's statewide property tax. However, due to San Jose's significantly higher property values, homeowners in San Jose generally pay more in property taxes than those in Bakersfield, despite having the same tax rate.
Sales Tax
The sales tax rate in San Jose is 9.25%, inclusive of the California state sales tax of 6.00%. Bakersfield, on the other hand, has a slightly higher sales tax rate of 7.25% with the same state base rate.
Income
Type
San Jose
Bakersfield
Estimated median household income
$126,377
$66,666
Estimated per capita income
$57,357
$29,363
Cost of living index (U.S. average is 100)
127.4
92.6
If you make $50,000 in Bakersfield, you will have to make $68,790 in San Jose to maintain the same standard of living.
Geographical Conditions
San Jose lies in Santa Clara Valley and is surrounded by rolling hills. Bakersfield is in the southern part of the Central Valley, bordered by both flat farmland and rolling hills, much of it highly developed due to the area's oil industry.
San Jose boasts highly-rated schools and several renowned universities, including San Jose State University. Bakersfield also offers a good education system with accredited schools and institutions like California State University, Bakersfield. Both cities have plenty of educational opportunities for learners of all ages, though San Jose holds a higher overall ranking compared to Bakersfield.
San Jose's economy has a strong technology sector influence, as it's considered the capital of Silicon Valley with tech giants like Adobe and eBay headquartered here. Bakersfield's economy relies more on agriculture, oil production, and manufacturing industries. The average income in San Jose is higher than in Bakersfield, linked to the tech industry's high-paying jobs.
Biggest Employers
San Jose boasts several big-name employers such as Cisco Systems, eBay, and Adobe. On the other hand, Bakersfield's biggest employers are in the agriculture, healthcare and education sectors, these include Grimmway Farms, Bakersfield Memorial Hospital, and California State University, Bakersfield.
There were 299 building permits issued in San Jose in 2012 (216 more than in 2011) compared to 1,121 building permits issued in Bakersfield in 2012 (699 more than in 2011).
In San Jose (Santa Clara County), 70.0% voted for Democrats and 27.1% for Republicans in 2012 Presidential Election. In Bakersfield (Kern County), 40.3% voted for Democrats and 57.0% for Republicans.
Elections
Type
Democrats
Republicans
Other
Year
San Jose
Bakersfield
San Jose
Bakersfield
San Jose
Bakersfield
2020
72.7%
43.7%
25.2%
53.9%
2.1%
2.4%
2016
72.7%
40.4%
20.6%
53.1%
6.7%
6.5%
2012
70.0%
40.3%
27.1%
57.0%
2.9%
2.7%
2008
69.6%
40.1%
28.6%
57.9%
1.8%
1.9%
2004
64.3%
32.7%
34.8%
67.0%
0.9%
0.3%
2000
60.7%
36.3%
34.4%
60.8%
4.9%
2.9%
1996
56.9%
36.6%
32.2%
53.8%
11.0%
9.7%
Breakdown of population affiliated with a religious congregation
Type
Adherents
Congregations
Religion
San Jose
Bakersfield
San Jose
Bakersfield
CATHOLIC CHURCH
25.1%
29.3%
6.0%
4.9%
MUSLIM ESTIMATE
1.1%
0.5%
1.8%
0.7%
SOUTHERN BAPTIST CONVENTION
0.9%
3.2%
7.7%
12.0%
EPISCOPAL CHURCH
0.5%
0.0%
2.3%
0.7%
SEVENTH DAY ADVENTIST CHURCH
0.4%
0.6%
2.6%
2.9%
EVANGELICAL LUTHERAN CHURCH IN AMERICA
0.3%
0.0%
2.3%
0.3%
LUTHERAN CHURCH
0.2%
0.4%
1.4%
2.0%
Weather
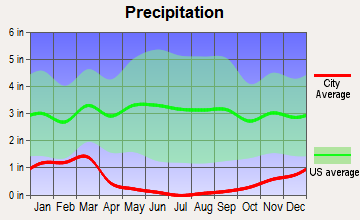
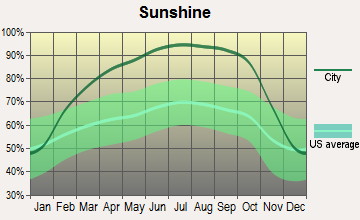
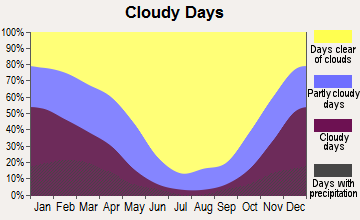
San Jose offers a more temperate climate, with warmer temperatures and less rainfall. The city is known for its sunny, dry summers and mild wet winters. Bakersfield experiences hotter summers with temperatures often exceeding 100 degrees Fahrenheit but cooler winters. Both cities have good air quality, but Bakersfield tends to have more smog due to its geography with nearby oil refineries.
Weather and climate
Type
San Jose
Bakersfield
Temperature - Average
60.9°F
64.9°F
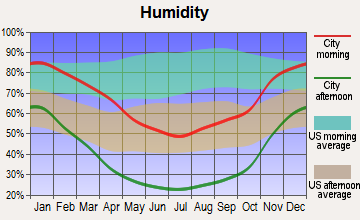
Humidity - Average morning or afternoon humidity
77.3%
53.5%
Humidity - Differences between morning and afternoon humidity
35.5%
59%
Humidity - Maximum monthly morning or afternoon humidity
87%
80%
Humidity - Minimum monthly morning or afternoon humidity
51.6%
21%
Precipitation - Yearly average
16.1 in
6.5 in
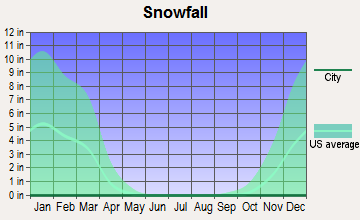
Snowfall - Yearly average
0 in
0 in
Clouds - Number of days clear of clouds
27.4%
31.8%
Sunshine amount - Average
73.8%
80.8%
Sunshine amount - Differences during a year
23%
31.1%
Sunshine amount - Maximum monthly
77.4%
89.5%
Sunshine amount - Minimum monthly
54.4%
58.4%
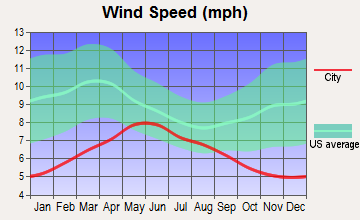
Wind speed - Average
10.3 mph
6.8 mph
Average climate in San Jose, California
Average climate in Bakersfield, California
Air pollution
Type
AQI
CO
NO2
OZONE
PB
PM10
PM25
SO2
Year
San Jose
Bakersfield
San Jose
Bakersfield
San Jose
Bakersfield
San Jose
Bakersfield
San Jose
Bakersfield
Bakersfield
San Jose
Bakersfield
San Jose
2018
94
135
0.49
0.28
14.5
12.3
22.2
32.3
0.006
0.004
53.7
N/A
12.5
15.7
0.2
N/A
2017
91
141
0.50
0.29
14.6
12.7
23.5
32.9
0.004
0.004
68.2
N/A
10.2
15.8
0.2
N/A
2016
69
127
0.47
0.27
13.7
11.7
22.4
31.0
0.003
0.004
N/A
N/A
8.8
14.5
0.2
N/A
2015
84
144
0.52
0.29
15.4
11.8
22.3
32.2
0.004
0.003
N/A
N/A
9.2
16.2
0.3
N/A
2014
83
141
0.40
0.28
13.9
13.3
21.5
31.5
0.004
N/A
53.0
N/A
8.2
17.9
0.2
N/A
2013
90
134
0.41
0.30
15.2
14.3
20.8
31.0
0.005
0.003
N/A
N/A
12.4
21.7
0.3
N/A
2012
74
145
0.35
N/A
13.3
14.6
21.8
32.4
0.003
0.004
N/A
N/A
10.1
17.2
0.3
N/A
2011
83
126
0.37
N/A
14.8
15.0
20.6
29.3
0.003
0.004
43.9
N/A
12.3
17.8
0.3
N/A
2010
88
147
0.35
N/A
14.4
14.4
20.4
29.3
0.004
0.003
39.2
N/A
9.0
17.2
0.4
N/A
2009
89
170
0.40
0.37
14.7
16.6
18.2
28.0
0.004
0.005
41.5
N/A
9.3
20.8
0.3
N/A
2008
100
171
0.45
0.48
16.7
17.4
20.6
27.8
N/A
N/A
57.0
N/A
12.6
22.7
N/A
N/A
2007
92
167
0.44
0.55
16.6
18.5
20.0
26.2
0.009
0.007
43.0
N/A
11.1
23.0
N/A
N/A
2006
100
157
0.46
0.56
18.0
19.2
21.8
29.6
N/A
N/A
N/A
N/A
11.1
18.0
N/A
N/A
2005
95
165
0.68
0.53
18.6
19.3
20.0
28.2
N/A
N/A
N/A
N/A
11.6
21.5
N/A
N/A
2004
98
163
0.63
0.51
18.5
19.9
20.4
27.1
N/A
N/A
N/A
N/A
9.9
21.3
N/A
N/A
2003
87
170
0.73
0.56
20.6
21.2
19.1
29.1
N/A
N/A
N/A
N/A
N/A
24.4
N/A
N/A
2002
78
170
0.65
0.60
19.5
22.5
18.0
26.9
0.006
0.006
N/A
N/A
N/A
29.5
N/A
N/A
2001
75
150
0.61
0.73
18.5
18.2
16.8
29.6
0.008
0.006
39.6
N/A
N/A
N/A
N/A
N/A
2000
65
130
0.66
0.77
18.9
23.4
15.6
28.8
0.009
0.006
39.6
N/A
N/A
N/A
N/A
N/A
Natural disasters
Type
San Jose
Bakersfield
Tornado activity compared to U.S. average
9%
2.7%
Earthquake activity compared to U.S. average
7,785.3%
7,870.5%
Natural disasters compared to U.S. average
19%
29%
Transportation
San Jose offers diverse transportation options, from light rail systems, buses, bike lanes, and multiple freeways for commuting purposes. The city is also home to the Mineta San Jose International Airport. Bakersfield also offers public transportation services, including bus routes, Amtrak service, and highways, but it is more limited in comparison.
Transport
Type
San Jose
Bakersfield
Amtrak stations
1
1
Amtrak stations nearby
3
1
FAA registered aircraft
553
433
FAA registered aircraft manufacturers and dealers
13
12
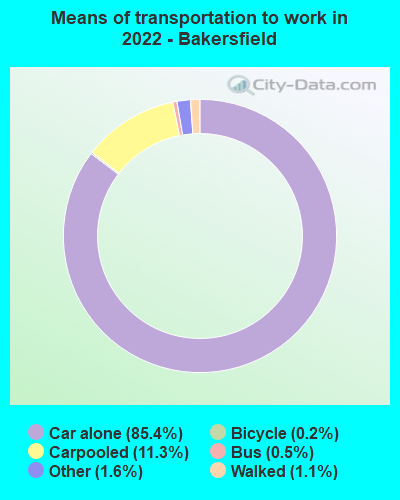
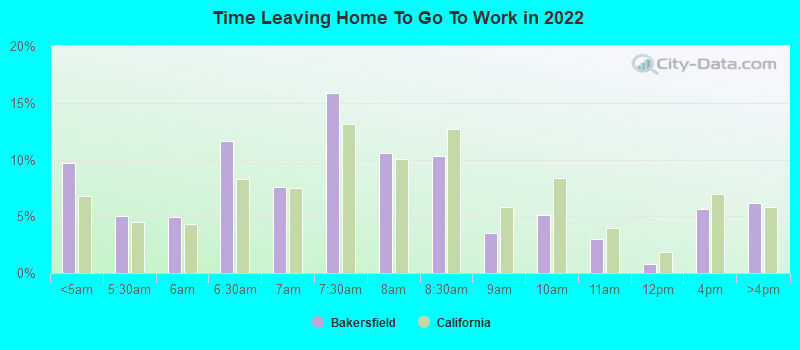
Means of transportation to work
Type
San Jose
Bakersfield
Bicycle
1%
0.2%
Bus
1.1%
0.3%
Carpooled
11.4%
8.7%
Car alone
80.5%
87.4%
Motorcycle
0.2%
0.3%
Railroad
0.2%
0%
Subway
0.2%
0%
Walked
3.3%
0.8%
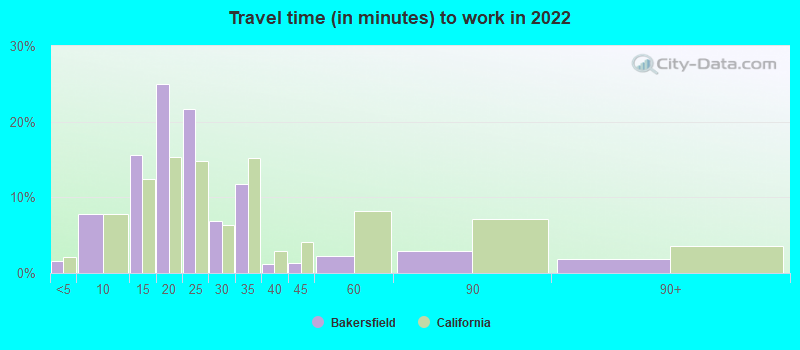
Average travel time to work
Type
San Jose
Bakersfield
Average
29.2 min
21.5 min
Other means
27.9 min
22.2 min
Public transportation
48.5 min
44.6 min
Private vehicle occupancy
Type
San Jose
Bakersfield
Average
1.2
1.2
Drove alone
87.3%
89.3%
In 2 person carpool
8.9%
6.2%
In 3 person carpool
1.9%
2.9%
In 4 person carpool
1.1%
1%
In 5-6 person carpool
0.6%
0.5%
In 7+ person carpool
0.2%
0.1%
How many people usually rode to work in the car, truck or van.
Real Estate
There's a significant difference in the real estate markets of these two cities. San Jose's real estate is far pricier, skewed by its high tech job market and location within Silicon Valley. The median house price in Bakersfield is less expensive, making it more affordable for more people.
Neighborhoods
San Jose boasts affluent neighborhoods like Silver Creek, Rose Garden, and Almaden Valley. Bakersfield has charming neighborhoods like Seven Oaks, Rio Bravo, and Laurelglen. Each city offers a mix of urban, suburban, and rural living opportunities.
Houses and residents
Type
San Jose
Bakersfield
Houses
340,561
134,270
Average household size (people)
3.1
3.1
Median year apartment built
1979
1984
Median year house/condo built
1973
1994
Length of stay in the house since moving in
15.6 years
11.8 years
Houses occupied
322,881 (94.8%)
128,007 (95.3%)
Houses occupied by owners
179,797 (55.7%)
78,398 (61.2%)
Houses occupied by renters
143,084 (44.3%)
49,609 (38.8%)
Median rent asked for vacant for-rent units
$3,214
$1,220
Median monthly housing costs
$2,463
$1,384
Median price asked for vacant for-sale houses and condos
$1,197,016
$366,859
Estimated median house or condo value
Over $1,000,000
$318,600
Median numbers of rooms
4.9
5.2
Median number of rooms in apartments
3.6
4.1
Median number of rooms in houses and condos
6
5.9
Median house price - detached houses
Over $1,000,000
$371,576
Median house price - in 2-unit structures
$753,788
$254,175
Median house price - in 3-to-4-unit structures
$680,453
$299,855
Median house price - in 5 or more unit structures
$688,625
$221,915
Median house price - mobile homes
$240,963
$92,500
Median house price - Townhouses or other attached units
$892,629
$244,694
Median house price - All housing units
Over $1,000,000
$356,236
Median house age
45
32
Renting percentage
41.5%
40.3%
Housing density (houses/condos per square mile)
1,947.6
1,187.2
House value disparities
21.2%
29.3%
Household income disparities
38.3%
44.3%
Median household income for houses/condes with a mortgage
$197,583
$98,668
Median household income for apartments without a mortgage
$103,711
$60,298
Housing units without a mortgage
2,632 (2.1%)
376 (0.7%)
Housing units with both a second mortgage and home equity loan
13,499 (10.6%)
1,793 (3.1%)
Housing units with a mortgage
124,224 (97.9%)
56,648 (99.3%)
Housing units with a home equity loan
346 (0.3%)
0 (0%)
Housing units with a second mortgage
16,249 (12.8%)
2,474 (4.3%)
House/condo owner moved in on average (years ago)
14
9
House/condo renter moved in on average (years ago)
3
2
Housing units lacking complete kitchen facilities
1.2%
2.1%
Housing units lacking complete plumbing facilities
0.6%
0.2%
Housing units in structures
Housing units in structures
San Jose
Bakersfield
One, detached
50.9%
71.5%
One, attached
11.5%
3.9%
Two
1.1%
1.3%
3 or 4
5.0%
7.8%
5 to 9
5.1%
3.8%
10 to 19
4.5%
2.0%
20 to 49
4.5%
2.2%
50 or more
14.2%
5.1%
Mobile homes
3.1%
2.3%
Boats, RVs, vans, etc.
0.1%
0.0%
Median real estate property taxes paid for housing units
Self-employed workers in own not incorporated business
28,517
11,506
State government workers
10,222
10,997
Unpaid family workers
472
161
Industries and Occupations
In San Jose, the tech industry dominates the employment scene. Software engineers, IT managers are some of the high-demand jobs. Bakersfield's top occupations lean more toward the agricultural and manufacturing sectors with professions in farming, petroleum production and food processing leading the pack.
Both cities offer highly-ranked healthcare facilities. San Jose has some nation-leading health centers including Santa Clara Valley Medical Center, while Bakersfield is home to facilities like the Bakersfield Heart Hospital – noted for its excellent cardiac care.
San Jose has well-developed infrastructure with numerous highways, airports, specialty health care, high-speed internet, and other amenities. Bakersfield also has a robust infrastructure but may not offer the same level of amenities as the larger city of San Jose.
Infrastructure
Type
San Jose
Bakersfield
Hospitals
20
18
TV stations
9
9
Arenas or stadiums
2
1
Bank branches located here
145
65
Bank institutions located here
25
19
Main business address for public companies
74
2
Drinking water stations with no reported violations in the past
21
7
Drinking water stations with reported violations in the past
HMDA - Conventional home purchase loans - Applications denied
Year
San Jose
Bakersfield
1999
3,839
392
2000
2,577
393
2001
1,953
297
2002
1,908
372
2003
3,578
1,104
2004
5,489
2,188
2005
6,994
3,038
2006
6,324
3,393
2007
4,298
2,036
2008
2,419
565
2009
1,631
289
Culture and Food
San Jose offers a vibrant culture rich in arts, music, and cuisine, with influences from around the world due to its diverse population. Bakersfield also prides itself on a strong cultural scene, deeply rooted in country music history with diverse food offerings, including their signature dish, the Basque cuisine.
Sports Teams
San Jose is home to the NHL's "San Jose Sharks" and the MLS "San Jose Earthquakes". Bakersfield hosts minor league teams like the "Bakersfield Condors" (AHL) and the "Bakersfield Blaze" (CAL).


 San Jose, CA
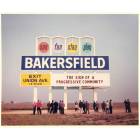
 Bakersfield, CA