Relocating or visiting a new city can be undoubtedly exciting. Both San Jose, CA, and Laredo, TX, present varying lifestyle options, considering differences in crime rates, weather conditions, cost of living, education systems, and economic structure among other factors. While San Jose boasts a thriving tech industry with high income levels, Laredo owns a unique cultural blend deeply rooted in Hispanic traditions. The comparison below will offer a broader perspective on what life looks like in these two distinct American cities.
Distance between
San Jose, CA and
Laredo, TX : 1,464.7 miles
San Jose's population is larger by 284%. Its population has grown by 88,546 people (9.9%) since 2000. The population of Laredo has grown by 79,577 people (45.1%) during that time.
The crime rates in San Jose are much lower than the national average, making it one of the safer places to live in California. On the other hand, Laredo's crime rate, although above the national average, is considered average for Texas. Laredo typically experiences more property crimes than violent crimes. Both cities maintain police departments that invest heavily in maintaining safety and preventing crime.
City-data.com crime index counts serious crimes and violent crime more heavily. It adjusts for the number of visitors and daily workers commuting into cities. (higher means more crime, U.S. average = 301.1)
City-data.com crime index counts serious crimes and violent crime more heavily. It adjusts for the number of visitors and daily workers commuting into cities. (higher means more crime, U.S. average = 301.1)
Sex Offenders
According to our data, there are 1,806 registered sex offenders living in San Jose and 266 registered sex offenders living in . The ratio of residents to sex offenders in San Jose is 568 to 1; the ratio in Laredo is 978 to 1. The number of registered sex offenders compared to the number of residents is larger in San Jose than in Laredo.
Cost of Living
The cost of living in San Jose is significantly higher than in Laredo. This is partly due to the high average incomes in the region due to its robust tech industry. Housing, food, and transport costs are all equally higher. Laredo, by comparison, offers a more affordable cost of living, with housing costs being among the lowest in the country.
Income Tax
California has a progressive income tax system, so San Jose residents may pay higher income taxes depending on their income bracket. Texas, including Laredo, does not have state income tax.
Property Tax
Property taxes in San Jose are relatively high due to high property values. Laredo's property taxes are lower, reflecting the city's more affordable real estate.
Sales Tax
The sales tax in San Jose (which includes the California state sales tax) is 9.25% while in Laredo (inclusive of Texas state sales tax) is 8.25%.
Income
Type
San Jose
Laredo
Estimated median household income
$126,377
$52,438
Estimated per capita income
$57,357
$21,785
Cost of living index (U.S. average is 100)
127.4
82.6
If you make $50,000 in Laredo, you will have to make $77,119 in San Jose to maintain the same standard of living.
Geographical Conditions
San Jose is located in the greater Santa Clara Valley, known for its beautiful landscapes, including the Santa Cruz Mountains. In contrast, Laredo is located in South Texas, experiencing mostly flat topography with the added ambience of the Rio Grande River.
San Jose's schooling system is highly regarded, with a number of renowned school districts, including the Cupertino Union School District and Palo Alto Unified School District. The city is also home to several renowned higher education institutions, including San Jose State University and branches of the University of California. Laredo's schooling system is not as highly ranked, although it has some standout schools and is home to the Texas A&M International University.
San Jose has a strong economy driven largely by the tech industry. The city features many high-tech and IT companies. Laredo's economy is more diverse with retail trade, healthcare, and transportation industries playing key roles.
Biggest Employers
Major employers in San Jose include Cisco Systems, eBay, IBM, and Hitachi. Laredo's biggest employers include United Independent School District, Laredo Independent School District, and Laredo Medical Center.
There were 299 building permits issued in San Jose in 2012 (216 more than in 2011) compared to 1,462 building permits issued in Laredo in 2012 (822 more than in 2011).
In San Jose (Santa Clara County), 70.0% voted for Democrats and 27.1% for Republicans in 2012 Presidential Election. In Laredo (Webb County), 76.4% voted for Democrats and 22.5% for Republicans.
Elections
Type
Democrats
Republicans
Other
Year
San Jose
Laredo
San Jose
Laredo
San Jose
Laredo
2020
72.7%
61.1%
25.2%
37.9%
2.1%
1.0%
2016
72.7%
74.4%
20.6%
22.8%
6.7%
2.9%
2012
70.0%
76.4%
27.1%
22.5%
2.9%
1.1%
2008
69.6%
71.5%
28.6%
28.0%
1.8%
0.4%
2004
64.3%
57.0%
34.8%
42.7%
0.9%
0.3%
2000
60.7%
57.6%
34.4%
41.6%
4.9%
0.8%
1996
56.9%
76.7%
32.2%
19.0%
11.0%
4.3%
Breakdown of population affiliated with a religious congregation
Type
Adherents
Congregations
Religion
San Jose
Laredo
San Jose
Laredo
CATHOLIC CHURCH
25.1%
50.6%
6.0%
18.8%
MUSLIM ESTIMATE
1.1%
1.0%
1.8%
0.7%
SOUTHERN BAPTIST CONVENTION
0.9%
1.2%
7.7%
21.0%
EPISCOPAL CHURCH
0.5%
0.1%
2.3%
0.7%
SEVENTH DAY ADVENTIST CHURCH
0.4%
0.3%
2.6%
2.9%
EVANGELICAL LUTHERAN CHURCH IN AMERICA
0.3%
0.1%
2.3%
1.4%
Weather
San Jose boasts a mild Mediterranean climate, with average temperatures ranging from 50°F to 70°F throughout the year. Laredo, meanwhile, experiences a hot semi-arid climate with hot summers and mild winters. If you prefer warmer, sunnier climates, Laredo's weather conditions might appeal to you more.
Weather and climate
Type
San Jose
Laredo
Temperature - Average
60.9°F
73.9°F
Humidity - Average morning or afternoon humidity
77.3%
80%
Humidity - Differences between morning and afternoon humidity
35.5%
36.1%
Humidity - Maximum monthly morning or afternoon humidity
87%
91.2%
Humidity - Minimum monthly morning or afternoon humidity
51.6%
55.1%
Precipitation - Yearly average
16.1 in
21.5 in
Snowfall - Yearly average
0 in
0.3 in
Clouds - Number of days clear of clouds
27.4%
17.3%
Sunshine amount - Average
73.8%
64.3%
Sunshine amount - Differences during a year
23%
35.1%
Sunshine amount - Maximum monthly
77.4%
78.3%
Sunshine amount - Minimum monthly
54.4%
43.1%
Wind speed - Average
10.3 mph
12.1 mph
Average climate in San Jose, California
Average climate in Laredo, Texas
Air pollution
Type
AQI
CO
NO2
OZONE
PB
PM10
PM25
SO2
Year
San Jose
Laredo
San Jose
Laredo
San Jose
San Jose
Laredo
San Jose
Laredo
Laredo
San Jose
San Jose
2018
94
44
0.49
0.20
14.5
N/A
22.2
24.2
0.006
N/A
N/A
N/A
12.5
N/A
0.2
N/A
2017
91
N/A
0.50
N/A
14.6
N/A
23.5
N/A
0.004
N/A
N/A
N/A
10.2
N/A
0.2
N/A
2016
69
37
0.47
0.37
13.7
N/A
22.4
20.0
0.003
N/A
N/A
N/A
8.8
N/A
0.2
N/A
2015
84
41
0.52
0.26
15.4
N/A
22.3
21.1
0.004
N/A
N/A
N/A
9.2
N/A
0.3
N/A
2014
83
43
0.40
0.24
13.9
N/A
21.5
22.6
0.004
N/A
N/A
N/A
8.2
N/A
0.2
N/A
2013
90
51
0.41
0.12
15.2
N/A
20.8
23.5
0.005
N/A
N/A
N/A
12.4
N/A
0.3
N/A
2012
74
N/A
0.35
N/A
13.3
N/A
21.8
N/A
0.003
N/A
N/A
N/A
10.1
N/A
0.3
N/A
2011
83
55
0.37
N/A
14.8
N/A
20.6
28.3
0.003
N/A
N/A
N/A
12.3
N/A
0.3
N/A
2010
88
54
0.35
0.40
14.4
N/A
20.4
22.4
0.004
N/A
22.3
N/A
9.0
N/A
0.4
N/A
2009
89
50
0.40
0.41
14.7
N/A
18.2
22.3
0.004
N/A
25.1
N/A
9.3
N/A
0.3
N/A
2008
100
62
0.45
0.40
16.7
N/A
20.6
20.5
N/A
0.009
28.0
N/A
12.6
N/A
N/A
N/A
2007
92
63
0.44
0.54
16.6
N/A
20.0
22.2
0.009
0.009
29.5
N/A
11.1
N/A
N/A
N/A
2006
100
116
0.46
0.52
18.0
N/A
21.8
21.6
N/A
0.010
39.3
N/A
11.1
N/A
N/A
N/A
2005
95
66
0.68
0.53
18.6
N/A
20.0
22.3
N/A
0.013
27.5
N/A
11.6
N/A
N/A
N/A
2004
98
57
0.63
0.57
18.5
N/A
20.4
22.4
N/A
0.012
24.2
N/A
9.9
N/A
N/A
N/A
2003
87
62
0.73
0.79
20.6
N/A
19.1
24.0
N/A
0.011
N/A
N/A
N/A
N/A
N/A
N/A
2002
78
58
0.65
0.84
19.5
N/A
18.0
24.5
0.006
0.008
N/A
N/A
N/A
N/A
N/A
N/A
2001
75
55
0.61
0.85
18.5
N/A
16.8
22.8
0.008
0.013
N/A
N/A
N/A
N/A
N/A
N/A
2000
65
60
0.66
0.95
18.9
N/A
15.6
22.5
0.009
0.020
N/A
N/A
N/A
N/A
N/A
N/A
Natural disasters
Type
San Jose
Laredo
Tornado activity compared to U.S. average
9%
9.6%
Earthquake activity compared to U.S. average
7,785.3%
58.7%
Natural disasters compared to U.S. average
19%
16%
Transportation
San Jose is served by an extensive public transportation system, including buses, light rail, and train services. Laredo has a smaller, but effective transportation system, primarily served by buses.
Transport
Type
San Jose
Laredo
Amtrak stations
1
1
Amtrak stations nearby
3
1
FAA registered aircraft
553
135
FAA registered aircraft manufacturers and dealers
13
7
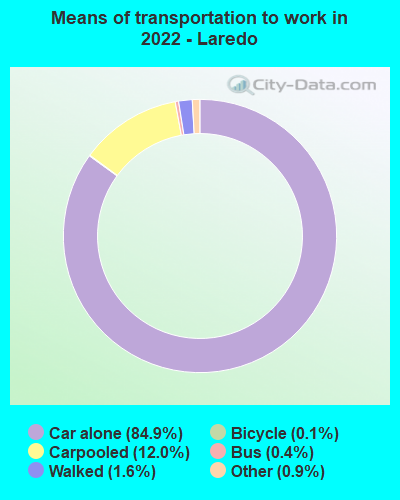
Means of transportation to work
Type
San Jose
Laredo
Bicycle
1%
0.1%
Bus
1.1%
1.2%
Carpooled
11.4%
12%
Car alone
80.5%
83.1%
Motorcycle
0.2%
0.1%
Railroad
0.2%
0%
Streetcar
0%
0.1%
Subway
0.2%
0%
Walked
3.3%
1.2%
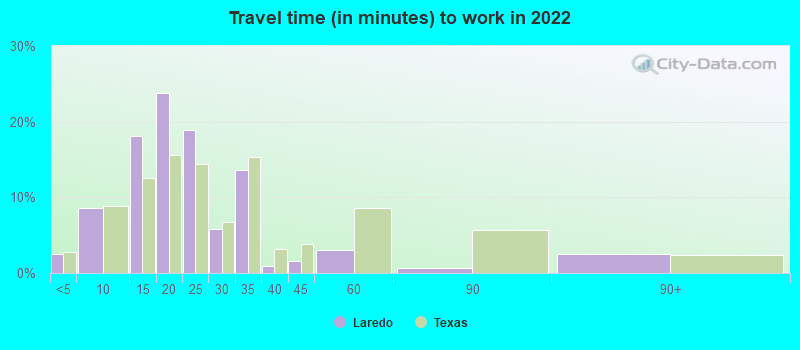
Average travel time to work
Type
San Jose
Laredo
Average
29.2 min
21.3 min
Other means
27.9 min
21.3 min
Public transportation
48.5 min
40.7 min
Private vehicle occupancy
Type
San Jose
Laredo
Average
1.2
1.2
Drove alone
87.3%
87%
In 2 person carpool
8.9%
8.8%
In 3 person carpool
1.9%
2.8%
In 4 person carpool
1.1%
0.8%
In 5-6 person carpool
0.6%
0.4%
In 7+ person carpool
0.2%
0.1%
How many people usually rode to work in the car, truck or van.
Real Estate
Real estate is significantly more expensive in San Jose, driven by high demand and limited supply. In comparison, Laredo's real estate market offers more affordable options, especially for first-time buyers.
Neighborhoods
San Jose has diverse neighborhoods ranging from upscale areas like Willow Glen and Silver Creek to eclectic areas like Japantown. Laredo’s neighborhoods such as San Isidro and Del Mar are family-friendly and culturally rich with a sense of tight-knit community.
Houses and residents
Type
San Jose
Laredo
Houses
340,561
82,105
Average household size (people)
3.1
3.7
Median year apartment built
1979
1993
Median year house/condo built
1973
1999
Length of stay in the house since moving in
15.6 years
14.3 years
Houses occupied
322,881 (94.8%)
76,095 (92.7%)
Houses occupied by owners
179,797 (55.7%)
48,145 (63.3%)
Houses occupied by renters
143,084 (44.3%)
27,950 (36.7%)
Median rent asked for vacant for-rent units
$3,214
$660.71
Median monthly housing costs
$2,463
$895
Median price asked for vacant for-sale houses and condos
$1,197,016
$131,192
Estimated median house or condo value
Over $1,000,000
$157,400
Median numbers of rooms
4.9
5.1
Median number of rooms in apartments
3.6
4.1
Median number of rooms in houses and condos
6
5.7
Median house price - detached houses
Over $1,000,000
$200,897
Median house price - in 2-unit structures
$753,788
$236,063
Median house price - in 3-to-4-unit structures
$680,453
$131,179
Median house price - in 5 or more unit structures
$688,625
$140,731
Median house price - mobile homes
$240,963
$84,838
Median house price - Townhouses or other attached units
$892,629
$167,216
Median house price - All housing units
Over $1,000,000
$187,779
Median house age
45
25
Renting percentage
41.5%
36.3%
Housing density (houses/condos per square mile)
1,947.6
1,046.5
House value disparities
21.2%
37.1%
Household income disparities
38.3%
46.4%
Median household income for houses/condes with a mortgage
$197,583
$78,507
Median household income for apartments without a mortgage
$103,711
$53,572
Housing units without a mortgage
2,632 (2.1%)
313 (1.2%)
Housing units with both a second mortgage and home equity loan
13,499 (10.6%)
431 (1.6%)
Housing units with a mortgage
124,224 (97.9%)
25,985 (98.8%)
Housing units with a home equity loan
346 (0.3%)
3 (0%)
Housing units with a second mortgage
16,249 (12.8%)
605 (2.3%)
House/condo owner moved in on average (years ago)
14
13
House/condo renter moved in on average (years ago)
3
1
Housing units lacking complete kitchen facilities
1.2%
3%
Housing units lacking complete plumbing facilities
0.6%
2.6%
Housing units in structures
Housing units in structures
San Jose
Laredo
One, detached
50.9%
66.4%
One, attached
11.5%
2.3%
Two
1.1%
1.7%
3 or 4
5.0%
5.7%
5 to 9
5.1%
3.9%
10 to 19
4.5%
2.6%
20 to 49
4.5%
1.5%
50 or more
14.2%
5.6%
Mobile homes
3.1%
9.8%
Boats, RVs, vans, etc.
0.1%
0.6%
Median real estate property taxes paid for housing units
Self-employed workers in own not incorporated business
28,517
5,131
State government workers
10,222
4,703
Unpaid family workers
472
395
Industries and Occupations
In San Jose, technology, healthcare, and education are some of the key industries that employ a significant portion of the populace. In Laredo, key industries include trade, transportation, and utilities.
San Jose offers a rich network of health care facilities including the Stanford University Medical Center. Laredo residents have access to Doctors Hospital of Laredo and Gateway Community Health Center among other local facilities.
Health (county statistics)
Type
San Jose
Laredo
General health status score of residents in this county from 1 (poor) to 5 (excellent)
San Jose boasts state-of-the-art infrastructure, reflecting its status as a high-tech hub. Infrastructure in Laredo is satisfactory with constant improvements being made to meet growing population demands.
Infrastructure
Type
San Jose
Laredo
Hospitals
20
11
TV stations
9
7
Arenas or stadiums
2
1
Bank branches located here
145
56
Bank institutions located here
25
13
Main business address for public companies
74
1
Drinking water stations with no reported violations in the past
21
2
Drinking water stations with reported violations in the past
HMDA - Conventional home purchase loans - Applications denied
Year
San Jose
Laredo
1999
3,839
2,067
2000
2,577
823
2001
1,953
343
2002
1,908
155
2003
3,578
330
2004
5,489
450
2005
6,994
645
2006
6,324
720
2007
4,298
564
2008
2,419
174
2009
1,631
64
Culture and Food
San Jose offers a diverse cultural scene, with many museums, art galleries, and restaurants offering international cuisine. Laredo is known for its Mexican and Tex-Mex food culture, reflecting its border-city status.
Sports Teams
San Jose boasts several professional sports teams, including the San Jose Sharks in the NHL and the San Jose Earthquakes in MLS. Laredo does not have any major professional sports teams but is home to several college and semiprofessional teams.


 San Jose, CA
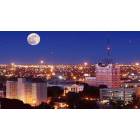
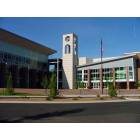
 Laredo, TX