Comparing San Jose, California, and Lubbock, Texas, reveals that each city holds unique attractions and offerings. These considerations span across areas such as crime and safety, weather, cost of living, education, work and economy, among other factors. This detailed comparison will assist those planning to relocate, as well as people interested in visiting these two cities.
Distance between
San Jose, CA and
Lubbock, TX : 1,152.5 miles
San Jose's population is larger by 277%. Its population has grown by 88,546 people (9.9%) since 2000. The population of Lubbock has grown by 61,429 people (30.8%) during that time.
San Jose, known for its relatively low crime rates, is generally safer than most American cities of its size. On the other hand, Lubbock, Texas, has a higher crime rate, though it's concentrated in certain parts of the city. In both cities, residents and tourists alike should take proper precautions and stay aware of their surroundings. Law enforcement teams in both cities are dedicated to improving public safety and reducing crime.
City-data.com crime index counts serious crimes and violent crime more heavily. It adjusts for the number of visitors and daily workers commuting into cities. (higher means more crime, U.S. average = 301.1)
City-data.com crime index counts serious crimes and violent crime more heavily. It adjusts for the number of visitors and daily workers commuting into cities. (higher means more crime, U.S. average = 301.1)
Sex Offenders
According to our data, there are 1,806 registered sex offenders living in San Jose and 595 registered sex offenders living in . The ratio of residents to sex offenders in San Jose is 568 to 1; the ratio in Lubbock is 424 to 1. The number of registered sex offenders compared to the number of residents is a smaller in San Jose than in Lubbock.
Cost of Living
San Jose, as a hub of the tech industry, has a significantly higher cost of living compared to Lubbock. Housing costs in San Jose are among the highest in the nation. On the contrary, Lubbock's cost of living is much lower, with affordable housing and lower prices for goods and services.
Income Tax
California imposes a state income tax, which can range from 1% to 13.3%, making it one of the highest in the country. Texas, including Lubbock, does not have a state income tax.
Property Tax
San Jose's property tax rates are typically around 0.793% while Lubbock has a significantly higher property tax rate which averages around 2.12%.
Sales Tax
California has a 6% state sales tax, but the total can reach as high as 9.25% when combined with local sales taxes. Texas has a 6.25% state sales tax, and with local taxes, the maximum total can reach to 8.25%, lower than in San Jose.
Income
Type
San Jose
Lubbock
Estimated median household income
$126,377
$54,747
Estimated per capita income
$57,357
$30,618
Cost of living index (U.S. average is 100)
127.4
83.8
If you make $50,000 in Lubbock, you will have to make $76,014 in San Jose to maintain the same standard of living.
Geographical Conditions
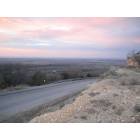
San Jose enjoys a central location in the Santa Clara Valley, surrounded by rolling hills and the seaside just a drive away. Lubbock, located on the flat Llano Estacado, is known for its sunsets and fertile soil.
In terms of education, both cities offer excellent options. San Jose hosts several high-ranking public and private schools and is home to prestigious institutions like San Jose State University. Meanwhile, Lubbock boasts a robust education sector highlighted by Texas Tech University.
The economy of San Jose is driven by the tech industry with a thriving job market, high salaries, and prospects of career advancement. Conversely, Lubbock's economy is more diverse, with healthcare, education, and agriculture being significant sectors.
Biggest Employers
In San Jose, some of the largest employers include tech companies like Apple, Google, Cisco, and Intel. For Lubbock, major employers include Texas Tech University, University Medical Center, and Covenant Health System.
There were 299 building permits issued in San Jose in 2012 (216 more than in 2011) compared to 2,454 building permits issued in Lubbock in 2012 (1825 more than in 2011).
In San Jose (Santa Clara County), 70.0% voted for Democrats and 27.1% for Republicans in 2012 Presidential Election. In Lubbock (Lubbock County), 28.8% voted for Democrats and 69.6% for Republicans.
Elections
Type
Democrats
Republicans
Other
Year
San Jose
Lubbock
San Jose
Lubbock
San Jose
Lubbock
2020
72.7%
33.2%
25.2%
65.4%
2.1%
1.3%
2016
72.7%
28.3%
20.6%
66.4%
6.7%
5.3%
2012
70.0%
28.8%
27.1%
69.6%
2.9%
1.5%
2008
69.6%
31.3%
28.6%
68.1%
1.8%
0.7%
2004
64.3%
24.2%
34.8%
75.4%
0.9%
0.4%
2000
60.7%
24.4%
34.4%
73.9%
4.9%
1.7%
1996
56.9%
30.6%
32.2%
63.5%
11.0%
5.9%
Breakdown of population affiliated with a religious congregation
Type
Adherents
Congregations
Religion
San Jose
Lubbock
San Jose
Lubbock
CATHOLIC CHURCH
25.1%
13.0%
6.0%
5.0%
MUSLIM ESTIMATE
1.1%
1.8%
1.8%
0.6%
SOUTHERN BAPTIST CONVENTION
0.9%
16.1%
7.7%
31.5%
EPISCOPAL CHURCH
0.5%
0.7%
2.3%
0.9%
SEVENTH DAY ADVENTIST CHURCH
0.4%
0.2%
2.6%
0.9%
EVANGELICAL LUTHERAN CHURCH IN AMERICA
0.3%
0.2%
2.3%
1.2%
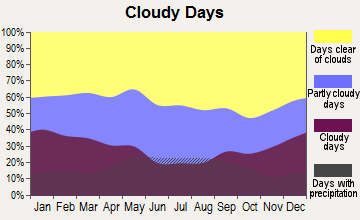
Weather
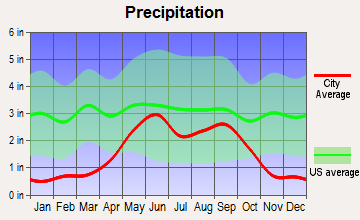
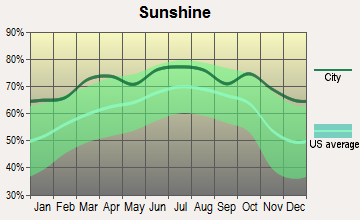
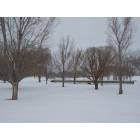
San Jose boasts of a Mediterranean climate, with mild, wet winters and hot, dry summers. It's an ideal location for those who enjoy sunshine, with more than 250 sunny days in a year. Meanwhile, Lubbock experiences a semi-arid climate with mild, short winters and long, hot summers. The city is also susceptible to tornadoes during spring and early summer.
Weather and climate
Type
San Jose
Lubbock
Temperature - Average
60.9°F
59.7°F
Humidity - Average morning or afternoon humidity
77.3%
64.4%
Humidity - Differences between morning and afternoon humidity
35.5%
42.3%
Humidity - Maximum monthly morning or afternoon humidity
87%
79.7%
Humidity - Minimum monthly morning or afternoon humidity
51.6%
37.4%
Precipitation - Yearly average
16.1 in
19 in
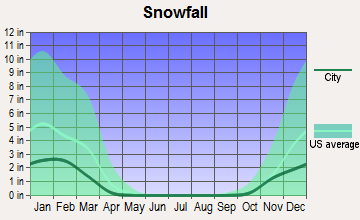
Snowfall - Yearly average
0 in
16.7 in
Clouds - Number of days clear of clouds
27.4%
26.6%
Sunshine amount - Average
73.8%
78.7%
Sunshine amount - Differences during a year
23%
16.7%
Sunshine amount - Maximum monthly
77.4%
80%
Sunshine amount - Minimum monthly
54.4%
63.3%
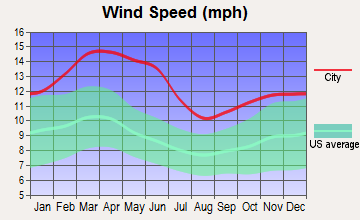
Wind speed - Average
10.3 mph
12.8 mph
Average climate in San Jose, California
Average climate in Lubbock, Texas
Air pollution
Type
AQI
CO
NO2
OZONE
PB
PM25
SO2
Year
San Jose
Lubbock
San Jose
San Jose
San Jose
San Jose
San Jose
Lubbock
San Jose
2018
94
62
0.49
N/A
14.5
N/A
22.2
N/A
0.006
N/A
12.5
6.6
0.2
N/A
2017
91
56
0.50
N/A
14.6
N/A
23.5
N/A
0.004
N/A
10.2
6.3
0.2
N/A
2016
69
N/A
0.47
N/A
13.7
N/A
22.4
N/A
0.003
N/A
8.8
N/A
0.2
N/A
2015
84
N/A
0.52
N/A
15.4
N/A
22.3
N/A
0.004
N/A
9.2
N/A
0.3
N/A
2014
83
61
0.40
N/A
13.9
N/A
21.5
N/A
0.004
N/A
8.2
7.6
0.2
N/A
2013
90
68
0.41
N/A
15.2
N/A
20.8
N/A
0.005
N/A
12.4
7.5
0.3
N/A
2012
74
76
0.35
N/A
13.3
N/A
21.8
N/A
0.003
N/A
10.1
9.0
0.3
N/A
2011
83
81
0.37
N/A
14.8
N/A
20.6
N/A
0.003
N/A
12.3
9.1
0.3
N/A
2010
88
57
0.35
N/A
14.4
N/A
20.4
N/A
0.004
N/A
9.0
6.7
0.4
N/A
2009
89
59
0.40
N/A
14.7
N/A
18.2
N/A
0.004
N/A
9.3
7.0
0.3
N/A
2008
100
N/A
0.45
N/A
16.7
N/A
20.6
N/A
N/A
N/A
12.6
N/A
N/A
N/A
2007
92
N/A
0.44
N/A
16.6
N/A
20.0
N/A
0.009
N/A
11.1
N/A
N/A
N/A
2006
100
N/A
0.46
N/A
18.0
N/A
21.8
N/A
N/A
N/A
11.1
N/A
N/A
N/A
2005
95
N/A
0.68
N/A
18.6
N/A
20.0
N/A
N/A
N/A
11.6
N/A
N/A
N/A
2004
98
N/A
0.63
N/A
18.5
N/A
20.4
N/A
N/A
N/A
9.9
N/A
N/A
N/A
2003
87
N/A
0.73
N/A
20.6
N/A
19.1
N/A
N/A
N/A
N/A
N/A
N/A
N/A
2002
78
N/A
0.65
N/A
19.5
N/A
18.0
N/A
0.006
N/A
N/A
N/A
N/A
N/A
2001
75
N/A
0.61
N/A
18.5
N/A
16.8
N/A
0.008
N/A
N/A
N/A
N/A
N/A
2000
65
N/A
0.66
N/A
18.9
N/A
15.6
N/A
0.009
N/A
N/A
N/A
N/A
N/A
Natural disasters
Type
San Jose
Lubbock
Tornado activity compared to U.S. average
9%
166%
Earthquake activity compared to U.S. average
7,785.3%
535.5%
Natural disasters compared to U.S. average
19%
14%
Transportation
Both cities have robust transportation systems. San Jose, with a more developed transit system, has light rail, bus services, and extensive bike lanes. Lubbock offers a bus service with limited coverage and a more car-dependent lifestyle.
Transport
Type
San Jose
Lubbock
Amtrak stations
1
0
Amtrak stations nearby
3
0
FAA registered aircraft
553
293
FAA registered aircraft manufacturers and dealers
13
0
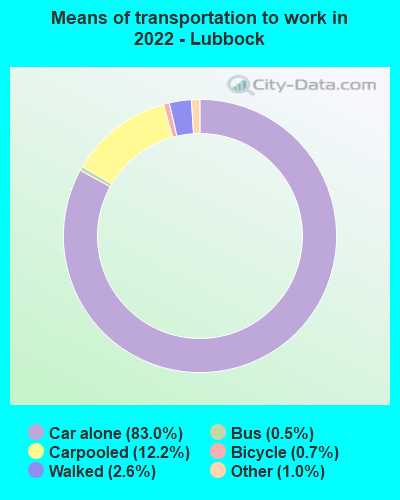
Means of transportation to work
Type
San Jose
Lubbock
Bicycle
1%
0.3%
Bus
1.1%
0.8%
Carpooled
11.4%
9.6%
Car alone
80.5%
86.4%
Motorcycle
0.2%
0.2%
Railroad
0.2%
0%
Subway
0.2%
0%
Walked
3.3%
1.9%
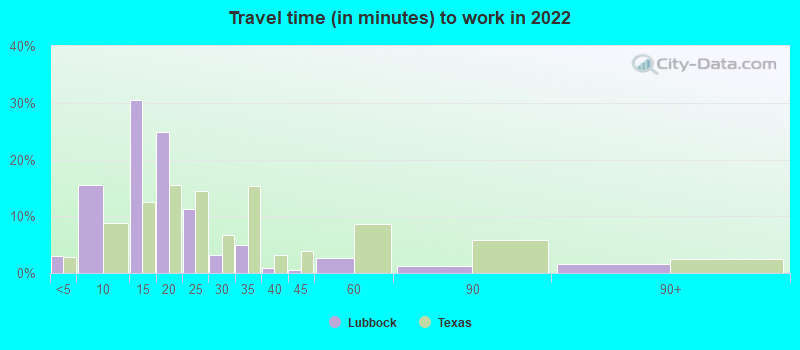
Average travel time to work
Type
San Jose
Lubbock
Average
29.2 min
18.2 min
Other means
27.9 min
18 min
Public transportation
48.5 min
31.3 min
Private vehicle occupancy
Type
San Jose
Lubbock
Average
1.2
1.2
Drove alone
87.3%
89.3%
In 2 person carpool
8.9%
7.9%
In 3 person carpool
1.9%
1%
In 4 person carpool
1.1%
0.6%
In 5-6 person carpool
0.6%
1.2%
In 7+ person carpool
0.2%
0.1%
How many people usually rode to work in the car, truck or van.
Real Estate
Real estate in San Jose is among the priciest in the country with a median home price considerably higher than the national average. In contrast, Lubbock offers a more affordable real estate market, with home prices well below the national average.
Neighborhoods
San Jose boasts upscale neighborhoods like Willow Glen and Silver Creek, while Lubbock features friendly and affordable neighborhoods such as Tech Terrace and Whisperwood.
Houses and residents
Type
San Jose
Lubbock
Houses
340,561
113,800
Average household size (people)
3.1
2.5
Median year apartment built
1979
1985
Median year house/condo built
1973
1985
Length of stay in the house since moving in
15.6 years
12.4 years
Houses occupied
322,881 (94.8%)
104,426 (91.8%)
Houses occupied by owners
179,797 (55.7%)
53,722 (51.4%)
Houses occupied by renters
143,084 (44.3%)
50,704 (48.6%)
Median rent asked for vacant for-rent units
$3,214
$760.15
Median monthly housing costs
$2,463
$1,010
Median price asked for vacant for-sale houses and condos
$1,197,016
$431,965
Estimated median house or condo value
Over $1,000,000
$171,400
Median numbers of rooms
4.9
5.2
Median number of rooms in apartments
3.6
4
Median number of rooms in houses and condos
6
6.2
Median house price - detached houses
Over $1,000,000
$217,964
Median house price - in 2-unit structures
$753,788
$266,863
Median house price - in 3-to-4-unit structures
$680,453
$270,056
Median house price - in 5 or more unit structures
$688,625
$186,477
Median house price - mobile homes
$240,963
$60,138
Median house price - occupied boats, rvs, vans etc.
$55,872
$28,841
Median house price - Townhouses or other attached units
$892,629
$159,383
Median house price - All housing units
Over $1,000,000
$215,105
Median house age
45
37
Renting percentage
41.5%
45.4%
Housing density (houses/condos per square mile)
1,947.6
991.2
House value disparities
21.2%
37.4%
Household income disparities
38.3%
48.2%
Median household income for houses/condes with a mortgage
$197,583
$96,150
Median household income for apartments without a mortgage
$103,711
$60,175
Housing units without a mortgage
2,632 (2.1%)
244 (0.8%)
Housing units with both a second mortgage and home equity loan
13,499 (10.6%)
577 (1.9%)
Housing units with a mortgage
124,224 (97.9%)
29,683 (99.2%)
Housing units with a home equity loan
346 (0.3%)
0 (0%)
Housing units with a second mortgage
16,249 (12.8%)
705 (2.4%)
House/condo owner moved in on average (years ago)
14
9
House/condo renter moved in on average (years ago)
3
1
Housing units lacking complete kitchen facilities
1.2%
2.9%
Housing units lacking complete plumbing facilities
0.6%
1.9%
Housing units in structures
Housing units in structures
San Jose
Lubbock
One, detached
50.9%
64.8%
One, attached
11.5%
2.7%
Two
1.1%
3.6%
3 or 4
5.0%
5.0%
5 to 9
5.1%
6.5%
10 to 19
4.5%
5.4%
20 to 49
4.5%
2.8%
50 or more
14.2%
6.9%
Mobile homes
3.1%
2.2%
Boats, RVs, vans, etc.
0.1%
0.1%
Median real estate property taxes paid for housing units
Self-employed workers in own not incorporated business
28,517
8,411
State government workers
10,222
10,797
Unpaid family workers
472
523
Industries and Occupations
San Jose is at the heart of Silicon Valley, hosting giants like Adobe and eBay. It's foremost in advanced tech, software, and computing industries. Lubbock, on the other hand, focuses on healthcare, education, and agriculture industries.
Both cities offer robust healthcare services. San Jose hosts renowned health institutions such as the Stanford Health Care and Kaiser Permanente. Lubbock is a regional healthcare hub featuring facilities like the University Medical Center and Covenant Children’s Hospital.
Health (county statistics)
Type
San Jose
Lubbock
General health status score of residents in this county from 1 (poor) to 5 (excellent)
San Jose enjoys excellent infrastructure, with a well-developed public transport system, high-speed internet, and an impressive skyline. Lubbock also maintains a strong infrastructure, though with a less developed public transport system.
Infrastructure
Type
San Jose
Lubbock
Hospitals
20
36
TV stations
9
13
Arenas or stadiums
2
3
Bank branches located here
145
97
Bank institutions located here
25
22
Main business address for public companies
74
3
Drinking water stations with no reported violations in the past
21
3
Drinking water stations with reported violations in the past
HMDA - Conventional home purchase loans - Applications denied
Year
San Jose
Lubbock
1999
3,839
1,025
2000
2,577
673
2001
1,953
472
2002
1,908
402
2003
3,578
0
2004
5,489
542
2005
6,994
566
2006
6,324
565
2007
4,298
343
2008
2,419
161
2009
1,631
115
Culture and Food
San Jose offers a mix of international and local Californian cuisine and is celebrated for its cultural and arts scene. Lubbock, known as the Music Crossroads of West Texas, offers a vibrant local music scene and classic Texas cuisine.
Sports Teams
San Jose is home to professional sports teams like the San Jose Sharks (NHL) and Earthquakes (MLS). Lubbock is a college sports town, primarily focused around Texas Tech University's sports teams.


 San Jose, CA
 Lubbock, TX