San Jose, California and Omaha, Nebraska, while both American cities, offer very different living experiences. San Jose is known for its tech-driven economy, temperate weather, and high cost of living, while Omaha offers a relaxed Midwest lifestyle, a diverse economy, and affordability. This comparison takes into account the aspects important to those pondering relocation or a visit, highlighting the unique characteristics of each city.
Distance between
San Jose, CA and
Omaha, NE : 1,404.2 miles
San Jose's population is larger by 102%. Its population has grown by 88,546 people (9.9%) since 2000. The population of Omaha has grown by 97,293 people (24.9%) during that time.
San Jose, as one of the largest cities in California, reports higher crime rates than Omaha, although, it is important to note, the city is safer than the majority of cities in California. Both property and violent crime rates are higher in San Jose compared to Omaha. In contrast, Omaha, a smaller city, has a lower overall crime rate. However, specific neighborhoods in Omaha have higher crime rates, so it's crucial to research before settling down.
City-data.com crime index counts serious crimes and violent crime more heavily. It adjusts for the number of visitors and daily workers commuting into cities. (higher means more crime, U.S. average = 301.1)
City-data.com crime index counts serious crimes and violent crime more heavily. It adjusts for the number of visitors and daily workers commuting into cities. (higher means more crime, U.S. average = 301.1)
Sex Offenders
According to our data, there are 1,806 registered sex offenders living in San Jose and 1,376 registered sex offenders living in . The ratio of residents to sex offenders in San Jose is 568 to 1; the ratio in Omaha is 325 to 1. The number of registered sex offenders compared to the number of residents is a smaller in San Jose than in Omaha.
Cost of Living
San Jose's cost of living is significantly higher than the national average, primarily due to housing costs. This is largely due to its location in Silicon Valley, home to many high-tech companies and high-paying jobs. Conversely, Omaha's cost of living is considerably lower than the national average, making it an attractive place for budget-conscious individuals and families.
Income Tax
California, where San Jose is located, has a progressive income tax system with rates ranging from 1% to 13.3%. Nebraska, home to Omaha, also uses a progressive income tax system, but rates range from 2.46% to 6.84%.
Property Tax
San Jose has a lower property tax rate compared to Omaha. However, due to the high cost of real estate in San Jose, homeowners typically end up paying more in absolute terms than those in Omaha.
Sales Tax
San Jose residents face a higher sales tax burden than their Omaha counterparts. The total sales tax rate in San Jose is currently 9.25%, while Omaha residents pay a total sales tax rate of 7.0%.
Income
Type
San Jose
Omaha
Estimated median household income
$126,377
$62,948
Estimated per capita income
$57,357
$38,062
Cost of living index (U.S. average is 100)
127.4
89.4
If you make $50,000 in Omaha, you will have to make $71,253 in San Jose to maintain the same standard of living.
Geographical Conditions
San Jose is nestled in the Santa Clara Valley, surrounded by rolling hills and close to the Pacific Ocean. Its geography contributes to its pleasant climate. Omaha is located in the Heartland of America, featuring flat plains and the beautiful Missouri River.
San Jose is home to many high-ranking public schools and universities, including San Jose State University. The emphasis on education is seen in the multiple renowned private schools and specialized education programs. Omaha also values education with excellent public school systems and higher education institutions including University of Nebraska at Omaha.
San Jose's economy is tech-focused, driven by Silicon Valley's high-tech industry cluster that includes major companies like Apple, Google, and Facebook. Correspondingly, job growth and wages are impressive, but competition can be fierce. Omaha's economy is more diversified, prominent sectors include healthcare, education, and financial services. Omaha is home to several Fortune 500 companies, such as Berkshire Hathaway and Union Pacific Railroad.
Biggest Employers
San Jose's biggest employers come from the tech industry including Cisco Systems, eBay, and Adobe Systems. On the other hand, Omaha's largest employers are a blend of healthcare providers like Nebraska Medicine and educational institutions like Omaha Public Schools.
There were 299 building permits issued in San Jose in 2012 (216 more than in 2011) compared to 1,620 building permits issued in Omaha in 2012 (460 more than in 2011).
In San Jose (Santa Clara County), 70.0% voted for Democrats and 27.1% for Republicans in 2012 Presidential Election. In Omaha (Douglas County), 47.5% voted for Democrats and 50.6% for Republicans.
Elections
Type
Democrats
Republicans
Other
Year
San Jose
Omaha
San Jose
Omaha
San Jose
Omaha
2020
72.7%
54.4%
25.2%
43.1%
2.1%
2.5%
2016
72.7%
47.3%
20.6%
45.0%
6.7%
7.7%
2012
70.0%
47.5%
27.1%
50.6%
2.9%
1.9%
2008
69.6%
51.7%
28.6%
47.0%
1.8%
1.3%
2004
64.3%
40.4%
34.8%
58.6%
0.9%
1.0%
2000
60.7%
40.1%
34.4%
55.2%
4.9%
4.7%
1996
56.9%
39.3%
32.2%
51.4%
11.0%
9.3%
Breakdown of population affiliated with a religious congregation
Type
Adherents
Congregations
Religion
San Jose
Omaha
San Jose
Omaha
CATHOLIC CHURCH
25.1%
24.0%
6.0%
11.8%
MUSLIM ESTIMATE
1.1%
0.9%
1.8%
0.7%
SOUTHERN BAPTIST CONVENTION
0.9%
1.5%
7.7%
5.2%
EPISCOPAL CHURCH
0.5%
0.5%
2.3%
1.4%
SEVENTH DAY ADVENTIST CHURCH
0.4%
0.3%
2.6%
1.7%
EVANGELICAL LUTHERAN CHURCH IN AMERICA
0.3%
4.1%
2.3%
6.6%
LUTHERAN CHURCH
0.2%
2.5%
1.4%
4.3%
AMERICAN BAPTIST CHURCHES IN THE USA
0.1%
0.5%
1.1%
2.8%
SALVATION ARMY
0.1%
0.4%
0.4%
0.9%
Weather
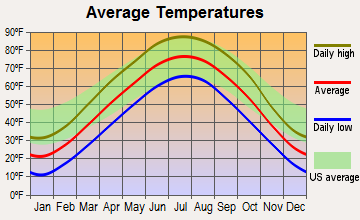
Weather varies greatly between Omaha and San Jose. San Jose enjoys a Mediterranean climate with mild, wet winters and warm, dry summers. It's an attractive feature for those who crave sunshine and temperate weather year-round. On the other hand, Omaha experiences a true four seasons climate, with hot, humid summers and cold, snowy winters. Both cities deal with natural disaster risks - earthquakes in San Jose and tornadoes in Omaha.
Weather and climate
Type
San Jose
Omaha
Temperature - Average
60.9°F
50.6°F
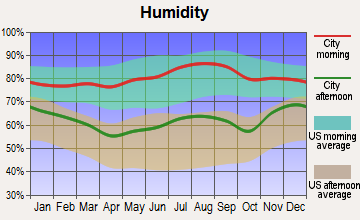
Humidity - Average morning or afternoon humidity
77.3%
75.9%
Humidity - Differences between morning and afternoon humidity
35.5%
35%
Humidity - Maximum monthly morning or afternoon humidity
87%
87%
Humidity - Minimum monthly morning or afternoon humidity
51.6%
52%
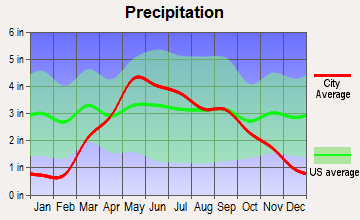
Precipitation - Yearly average
16.1 in
30 in
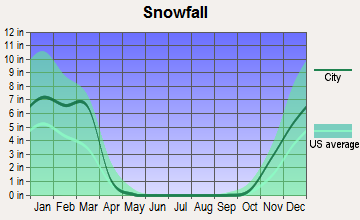
Snowfall - Yearly average
0 in
57.2 in
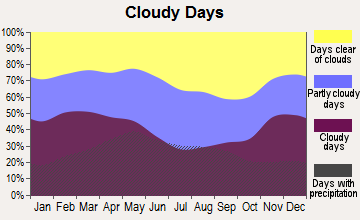
Clouds - Number of days clear of clouds
27.4%
18.4%
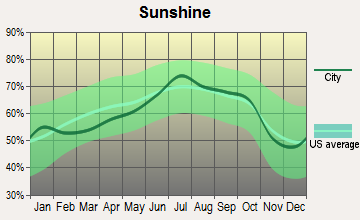
Sunshine amount - Average
73.8%
66.7%
Sunshine amount - Differences during a year
23%
27%
Sunshine amount - Maximum monthly
77.4%
74%
Sunshine amount - Minimum monthly
54.4%
47%
Wind speed - Average
10.3 mph
10.8 mph
Average climate in San Jose, California
Average climate in Omaha, Nebraska
Air pollution
Type
AQI
CO
NO2
OZONE
PB
PM10
PM25
SO2
Year
San Jose
Omaha
San Jose
Omaha
San Jose
San Jose
Omaha
San Jose
Omaha
Omaha
San Jose
Omaha
San Jose
Omaha
2018
94
75
0.49
0.18
14.5
N/A
22.2
26.7
0.006
N/A
19.3
N/A
12.5
8.4
0.2
0.5
2017
91
76
0.50
0.19
14.6
N/A
23.5
26.3
0.004
N/A
21.6
N/A
10.2
9.6
0.2
0.9
2016
69
80
0.47
0.18
13.7
N/A
22.4
26.3
0.003
N/A
19.3
N/A
8.8
8.1
0.2
0.7
2015
84
79
0.52
0.20
15.4
N/A
22.3
26.9
0.004
N/A
20.3
N/A
9.2
9.3
0.3
0.9
2014
83
80
0.40
0.23
13.9
N/A
21.5
27.9
0.004
N/A
23.5
N/A
8.2
8.8
0.2
1.2
2013
90
79
0.41
0.20
15.2
N/A
20.8
28.0
0.005
N/A
26.9
N/A
12.4
9.3
0.3
1.4
2012
74
100
0.35
0.21
13.3
N/A
21.8
27.1
0.003
N/A
39.0
N/A
10.1
8.4
0.3
1.6
2011
83
96
0.37
0.21
14.8
N/A
20.6
25.4
0.003
N/A
32.9
N/A
12.3
9.2
0.3
1.6
2010
88
102
0.35
N/A
14.4
N/A
20.4
28.0
0.004
N/A
43.2
N/A
9.0
10.5
0.4
2.1
2009
89
73
0.40
N/A
14.7
N/A
18.2
24.3
0.004
N/A
28.7
N/A
9.3
N/A
0.3
1.8
2008
100
104
0.45
N/A
16.7
N/A
20.6
26.9
N/A
N/A
45.0
N/A
12.6
18.9
N/A
1.1
2007
92
109
0.44
0.51
16.6
N/A
20.0
29.0
0.009
N/A
N/A
N/A
11.1
16.5
N/A
1.7
2006
100
86
0.46
0.50
18.0
N/A
21.8
30.0
N/A
N/A
N/A
N/A
11.1
13.0
N/A
1.3
2005
95
78
0.68
0.47
18.6
N/A
20.0
32.8
N/A
N/A
N/A
N/A
11.6
12.9
N/A
2.8
2004
98
51
0.63
0.44
18.5
N/A
20.4
30.9
N/A
N/A
N/A
N/A
9.9
N/A
N/A
1.5
2003
87
50
0.73
0.43
20.6
N/A
19.1
26.6
N/A
N/A
N/A
N/A
N/A
N/A
N/A
0.7
2002
78
48
0.65
0.38
19.5
N/A
18.0
27.6
0.006
0.030
N/A
N/A
N/A
N/A
N/A
1.1
2001
75
39
0.61
0.35
18.5
N/A
16.8
25.0
0.008
0.038
N/A
N/A
N/A
N/A
N/A
0.4
2000
65
44
0.66
0.50
18.9
N/A
15.6
26.1
0.009
0.049
N/A
N/A
N/A
N/A
N/A
0.5
Natural disasters
Type
San Jose
Omaha
Tornado activity compared to U.S. average
9%
191.9%
Earthquake activity compared to U.S. average
7,785.3%
415.1%
Natural disasters compared to U.S. average
19%
21%
Transportation
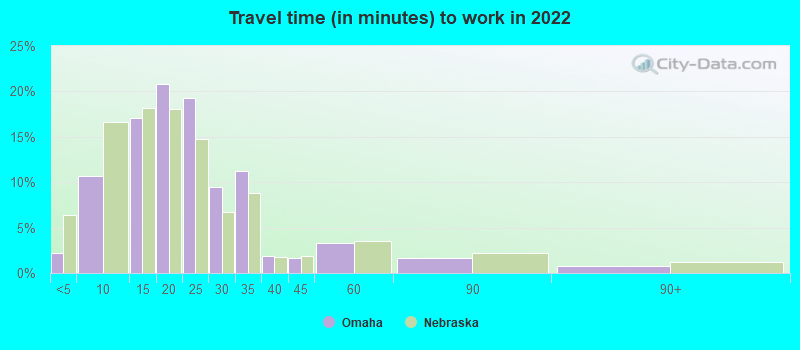
Both cities have extensive transit systems. San Jose has the Valley Transportation Authority, which operates bus and light rail services, Caltrain, and BART. Omaha offers Metro Transit bus services with the recent addition of the ORBT rapid transit lines. Commuting times in San Jose are considerably higher than Omaha due to heavy traffic.
Transport
Type
San Jose
Omaha
Amtrak stations
1
1
Amtrak stations nearby
3
1
FAA registered aircraft
553
405
FAA registered aircraft manufacturers and dealers
13
24
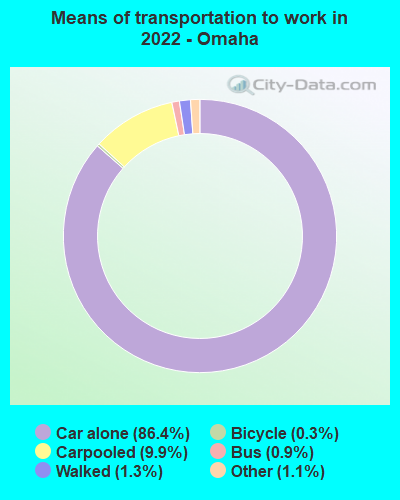
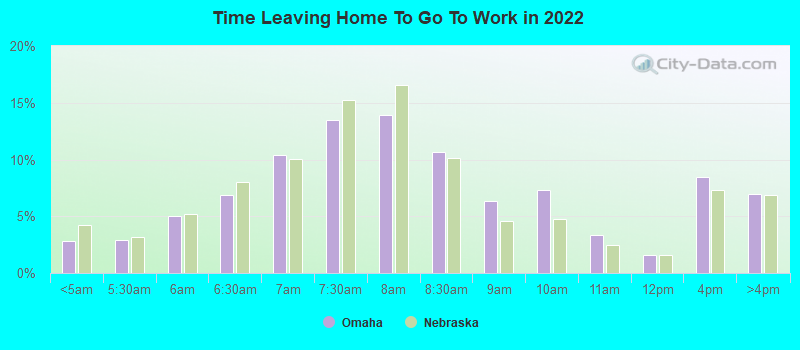
Means of transportation to work
Type
San Jose
Omaha
Bicycle
1%
0.2%
Bus
1.1%
0.7%
Carpooled
11.4%
8.2%
Car alone
80.5%
87.8%
Motorcycle
0.2%
0.1%
Railroad
0.2%
0%
Subway
0.2%
0%
Walked
3.3%
2%
Average travel time to work
Type
San Jose
Omaha
Average
29.2 min
22.5 min
Other means
27.9 min
18.8 min
Public transportation
48.5 min
39 min
Private vehicle occupancy
Type
San Jose
Omaha
Average
1.2
1.1
Drove alone
87.3%
90.4%
In 2 person carpool
8.9%
6.9%
In 3 person carpool
1.9%
1.4%
In 4 person carpool
1.1%
0.7%
In 5-6 person carpool
0.6%
0.6%
In 7+ person carpool
0.2%
0.1%
How many people usually rode to work in the car, truck or van.
Real Estate
Real estate in San Jose is among the most expensive in the country due to high demand and the wealth of tech sector employees. Omaha real estate is significantly less expensive and offers a good mix of urban, suburban, and rural living environments.
Neighborhoods
San Jose offers neighborhoods that cater to a range of lifestyles - from high-energy downtown living to quieter, family-friendly suburbs. The downtown, Willow Glen, and Rose Garden are among the most popular neighborhoods. Omaha presents a diverse range of neighborhoods with the Old Market district and West Omaha being the most sought after.
Houses and residents
Type
San Jose
Omaha
Houses
340,561
212,802
Average household size (people)
3.1
2.5
Median year apartment built
1979
1976
Median year house/condo built
1973
1970
Length of stay in the house since moving in
15.6 years
13.3 years
Houses occupied
322,881 (94.8%)
201,469 (94.7%)
Houses occupied by owners
179,797 (55.7%)
117,404 (58.3%)
Houses occupied by renters
143,084 (44.3%)
84,065 (41.7%)
Median rent asked for vacant for-rent units
$3,214
$892.09
Median monthly housing costs
$2,463
$1,119
Median price asked for vacant for-sale houses and condos
$1,197,016
$261,376
Estimated median house or condo value
Over $1,000,000
$211,900
Median numbers of rooms
4.9
5.8
Median number of rooms in apartments
3.6
4
Median number of rooms in houses and condos
6
7.1
Median house price - detached houses
Over $1,000,000
$249,098
Median house price - in 2-unit structures
$753,788
$191,723
Median house price - in 3-to-4-unit structures
$680,453
$100,661
Median house price - in 5 or more unit structures
$688,625
$319,464
Median house price - mobile homes
$240,963
$35,876
Median house price - Townhouses or other attached units
$892,629
$186,544
Median house price - All housing units
Over $1,000,000
$246,177
Median house age
45
49
Renting percentage
41.5%
41.7%
Housing density (houses/condos per square mile)
1,947.6
1,839.2
House value disparities
21.2%
33.1%
Household income disparities
38.3%
45.6%
Median household income for houses/condes with a mortgage
$197,583
$98,149
Median household income for apartments without a mortgage
$103,711
$71,454
Housing units without a mortgage
2,632 (2.1%)
2,417 (2.9%)
Housing units with both a second mortgage and home equity loan
13,499 (10.6%)
7,375 (8.9%)
Housing units with a mortgage
124,224 (97.9%)
80,503 (97.1%)
Housing units with a home equity loan
346 (0.3%)
335 (0.4%)
Housing units with a second mortgage
16,249 (12.8%)
9,200 (11.1%)
House/condo owner moved in on average (years ago)
14
12
House/condo renter moved in on average (years ago)
3
1
Housing units lacking complete kitchen facilities
1.2%
1.6%
Housing units lacking complete plumbing facilities
0.6%
0.7%
Housing units in structures
Housing units in structures
San Jose
Omaha
One, detached
50.9%
63.2%
One, attached
11.5%
3.9%
Two
1.1%
1.5%
3 or 4
5.0%
2.2%
5 to 9
5.1%
6.8%
10 to 19
4.5%
8.3%
20 to 49
4.5%
5.3%
50 or more
14.2%
8.1%
Mobile homes
3.1%
0.6%
Boats, RVs, vans, etc.
0.1%
0.0%
Median real estate property taxes paid for housing units
Self-employed workers in own not incorporated business
28,517
11,886
State government workers
10,222
7,835
Unpaid family workers
472
205
Industries and Occupations
San Jose is synonymous with technology, information services, and software development. Computing and mathematical occupations are prevalent. Omaha’s economy supports a healthy mix of sectors like finance, insurance, health care, and education.
Both cities have excellent health care facilities. San Jose is close to some of the best medical centers in the country, including Stanford Hospital. Omaha is home to the renowned University of Nebraska Medical Center, known for its research and high-quality care.
Health (county statistics)
Type
San Jose
Omaha
General health status score of residents in this county from 1 (poor) to 5 (excellent)
San Jose's infrastructure is robust, designed to support a large, fast-paced population, and a thriving tech industry. Omaha's infrastructure is also well developed, although the city has a smaller, more spread-out populace. Omaha has made notable strides in developing efficient public systems and structures including renewable energy initiatives.
Infrastructure
Type
San Jose
Omaha
Hospitals
20
23
TV stations
9
19
Arenas or stadiums
2
2
Bank branches located here
145
183
Bank institutions located here
25
31
Main business address for public companies
74
30
Nuclear power plants nearby
0
1
Drinking water stations with no reported violations in the past
21
8
Drinking water stations with reported violations in the past
HMDA - Conventional home purchase loans - Applications denied
Year
San Jose
Omaha
1999
3,839
1,177
2000
2,577
545
2001
1,953
390
2002
1,908
441
2003
3,578
747
2004
5,489
1,022
2005
6,994
1,055
2006
6,324
1,083
2007
4,298
646
2008
2,419
318
2009
1,631
220
Culture and Food
San Jose offers an eclectic blend of cultures reflected in its food scene with numerous fine dining options, wineries, and ethnic cuisines. Omaha, known for its steakhouses, also showcases a diverse food culture with an emerging farm-to-table movement and a bustling craft brewery scene.
Sports Teams
San Jose holds it's own in the sports sphere with the San Jose Sharks (NHL), San Jose Earthquakes (MLS), and close proximity to the San Francisco 49ers (NFL) and Giants (MLB). Omaha doesn't have major league sports teams but takes pride in its college sports, especially the University of Nebraska's Cornhuskers football team. Omaha also hosts the annual College World Series.


 San Jose, CA
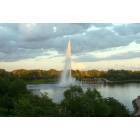
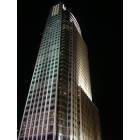
 Omaha, NE