San Jose, located in California, and Orlando, located in Florida, each offers a unique blend of lifestyle, culture, and amenities to both residents and tourists. The sunshine-soaked, tech oriented San Jose contrasts with the theme park-filled and tropical Orlando, with aspects of climate, economy, and cost of living coming to the fore in comparison. The needs of those contemplating relocation will be weighed differently from tourists, but common factors including weather, safety, cost of living, and quality of life are universally valued. This comparison aims to provide detailed and specific insights into what these two cities have to offer.
Distance between
San Jose, CA and
Orlando, FL : 2,406.1 miles
San Jose's population is larger by 218%. Its population has grown by 88,546 people (9.9%) since 2000. The population of Orlando has grown by 123,203 people (66.3%) during that time.
San Jose is generally safer than Orlando. The crime rate in Orlando is higher than San Jose when comparing both violent and property crimes. However, relative safety does vary by neighborhood, and both cities have areas that are considered safer than others. Visitors are encouraged to stay in well-populated areas, especially at night, whereas those planning to permanently relocate should study detailed crime reports of potential residential neighborhoods.
City-data.com crime index counts serious crimes and violent crime more heavily. It adjusts for the number of visitors and daily workers commuting into cities. (higher means more crime, U.S. average = 301.1)
City-data.com crime index counts serious crimes and violent crime more heavily. It adjusts for the number of visitors and daily workers commuting into cities. (higher means more crime, U.S. average = 301.1)
Sex Offenders
According to our data, there are 1,806 registered sex offenders living in San Jose and 2,506 registered sex offenders living in . The ratio of residents to sex offenders in San Jose is 568 to 1; the ratio in Orlando is 111 to 1. The number of registered sex offenders compared to the number of residents is a lot smaller in San Jose than in Orlando.
Cost of Living
The cost of living in San Jose is substantially higher than in Orlando. This is due to various factors, but real estate prices and the overall cost of goods and services are the major contributors. This makes Orlando more affordable for both residents and tourists.
Income Tax
Another important financial consideration is that Florida has no state income tax, which can translate to significant savings for residents of Orlando compared to San Jose, where residents pay California's state income tax.
Property Tax
California's property tax rate is lower than Florida's. However, because home prices in San Jose are higher, homeowners may still end up paying more in property taxes than those in Orlando.
Sales Tax
California has a higher state sales tax than Florida. San Jose has an additional city sales tax on top of California’s state sales tax. Orlando only has Florida's state sales tax, as there's no additional city sales tax.
Income
Type
San Jose
Orlando
Estimated median household income
$126,377
$54,167
Estimated per capita income
$57,357
$36,370
Cost of living index (U.S. average is 100)
127.4
93.5
If you make $50,000 in Orlando, you will have to make $68,128 in San Jose to maintain the same standard of living.
Geographical Conditions
San Jose is located in the Silicon Valley, surrounded by rolling hills and close to the coast. Orlando is flat and landlocked, with many lakes and wetlands.
San Jose is home to several highly ranked universities and public schools, making it an excellent place for education. On the other hand, Orlando also offers quality education, but is particularly known for its top-rated hospitality management programs due to its proximity to major tourist destinations.
San Jose has a robust economy supported by the tech industry. It's often referred to as the capital of Silicon Valley. Orlando's economy thrives on tourism, hospitality, and entertainment. While San Jose offers higher salaries, particularly in tech, Orlando provides many opportunities in service-based roles.
Biggest Employers
In San Jose, big tech companies like Apple, Google, and Cisco are among the biggest employers. Orlando's largest employers include Walt Disney World Resort, Universal Orlando Resort, and other tourism-related businesses.
There were 299 building permits issued in San Jose in 2012 (216 more than in 2011) compared to 990 building permits issued in Orlando in 2012 (682 more than in 2011).
In San Jose (Santa Clara County), 70.0% voted for Democrats and 27.1% for Republicans in 2012 Presidential Election. In Orlando (Orange County), 58.8% voted for Democrats and 40.5% for Republicans.
Elections
Type
Democrats
Republicans
Other
Year
San Jose
Orlando
San Jose
Orlando
San Jose
Orlando
2020
72.7%
61.1%
25.2%
37.9%
2.1%
1.0%
2016
72.7%
60.0%
20.6%
35.5%
6.7%
4.5%
2012
70.0%
58.8%
27.1%
40.5%
2.9%
0.6%
2008
69.6%
59.4%
28.6%
40.6%
1.8%
0.0%
2004
64.3%
50.0%
34.8%
49.7%
0.9%
0.3%
2000
60.7%
50.2%
34.4%
48.1%
4.9%
1.7%
1996
56.9%
45.7%
32.2%
45.9%
11.0%
8.4%
Breakdown of population affiliated with a religious congregation
Type
Adherents
Congregations
Religion
San Jose
Orlando
San Jose
Orlando
CATHOLIC CHURCH
25.1%
12.7%
6.0%
2.5%
MUSLIM ESTIMATE
1.1%
1.1%
1.8%
1.1%
SOUTHERN BAPTIST CONVENTION
0.9%
5.5%
7.7%
14.3%
EPISCOPAL CHURCH
0.5%
0.7%
2.3%
1.9%
SEVENTH DAY ADVENTIST CHURCH
0.4%
1.8%
2.6%
4.7%
EVANGELICAL LUTHERAN CHURCH IN AMERICA
0.3%
0.3%
2.3%
1.2%
LUTHERAN CHURCH
0.2%
0.3%
1.4%
1.0%
Weather
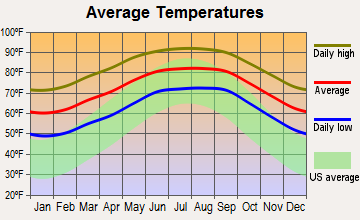
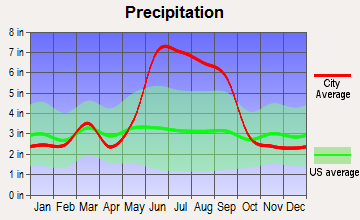
Both cities benefit from a warm climate year-round. San Jose enjoys a Mediterranean climate with mild winters and dry summers. Orlando experiences a humid subtropical climate with heavy rainfall during the summer. Orlando's humid climate can be hard for some to adjust to, particularly those accustomed to the dry heat of San Jose.
Weather and climate
Type
San Jose
Orlando
Temperature - Average
60.9°F
72.4°F
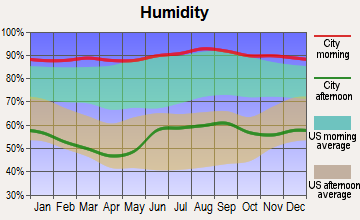
Humidity - Average morning or afternoon humidity
77.3%
77.6%
Humidity - Differences between morning and afternoon humidity
35.5%
44%
Humidity - Maximum monthly morning or afternoon humidity
87%
91%
Humidity - Minimum monthly morning or afternoon humidity
51.6%
47%
Precipitation - Yearly average
16.1 in
48.7 in
Snowfall - Yearly average
0 in
0 in
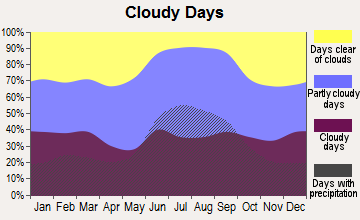
Clouds - Number of days clear of clouds
27.4%
14.8%
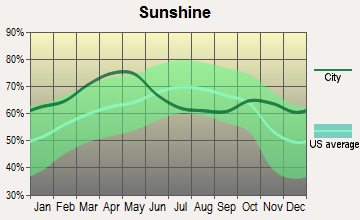
Sunshine amount - Average
73.8%
74.5%
Sunshine amount - Differences during a year
23%
17.8%
Sunshine amount - Maximum monthly
77.4%
79.7%
Sunshine amount - Minimum monthly
54.4%
61.9%
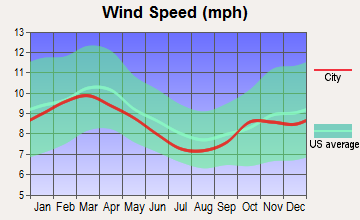
Wind speed - Average
10.3 mph
8.3 mph
Average climate in San Jose, California
Average climate in Orlando, Florida
Air pollution
Type
AQI
CO
NO2
OZONE
PB
PM10
PM25
SO2
Year
San Jose
Orlando
San Jose
Orlando
San Jose
Orlando
San Jose
Orlando
San Jose
Orlando
San Jose
Orlando
San Jose
2018
94
65
0.49
0.49
14.5
4.5
22.2
28.1
0.006
N/A
12.3
N/A
12.5
7.1
0.2
N/A
2017
91
70
0.50
0.46
14.6
4.1
23.5
28.3
0.004
N/A
13.8
N/A
10.2
8.1
0.2
N/A
2016
69
68
0.47
0.48
13.7
4.1
22.4
29.1
0.003
N/A
13.8
N/A
8.8
8.6
0.2
N/A
2015
84
64
0.52
0.51
15.4
4.0
22.3
26.9
0.004
N/A
14.2
N/A
9.2
8.4
0.3
N/A
2014
83
65
0.40
0.45
13.9
4.9
21.5
27.1
0.004
N/A
13.9
N/A
8.2
8.5
0.2
N/A
2013
90
61
0.41
0.29
15.2
4.5
20.8
26.2
0.005
N/A
14.1
N/A
12.4
8.2
0.3
N/A
2012
74
66
0.35
0.38
13.3
5.4
21.8
26.7
0.003
N/A
14.9
N/A
10.1
8.5
0.3
N/A
2011
83
72
0.37
0.43
14.8
5.4
20.6
28.0
0.003
N/A
15.3
N/A
12.3
9.8
0.3
N/A
2010
88
69
0.35
0.40
14.4
5.6
20.4
27.3
0.004
N/A
15.7
N/A
9.0
9.5
0.4
N/A
2009
89
69
0.40
0.33
14.7
5.9
18.2
27.0
0.004
N/A
16.0
N/A
9.3
9.5
0.3
N/A
2008
100
73
0.45
0.25
16.7
6.1
20.6
28.0
N/A
N/A
16.8
N/A
12.6
10.2
N/A
N/A
2007
92
83
0.44
0.37
16.6
6.9
20.0
30.3
0.009
N/A
16.9
N/A
11.1
11.0
N/A
N/A
2006
100
87
0.46
0.39
18.0
8.5
21.8
31.5
N/A
N/A
21.4
N/A
11.1
11.6
N/A
N/A
2005
95
89
0.68
0.56
18.6
8.6
20.0
29.6
N/A
N/A
18.7
N/A
11.6
12.6
N/A
N/A
2004
98
86
0.63
0.52
18.5
9.5
20.4
28.4
N/A
N/A
18.5
N/A
9.9
11.7
N/A
N/A
2003
87
84
0.73
0.44
20.6
11.0
19.1
27.9
N/A
N/A
17.8
N/A
N/A
10.9
N/A
N/A
2002
78
84
0.65
0.47
19.5
11.3
18.0
25.9
0.006
N/A
17.7
N/A
N/A
11.1
N/A
N/A
2001
75
88
0.61
0.64
18.5
12.3
16.8
26.6
0.008
N/A
19.6
N/A
N/A
12.2
N/A
N/A
2000
65
77
0.66
0.72
18.9
12.4
15.6
N/A
0.009
N/A
N/A
N/A
N/A
N/A
N/A
N/A
Natural disasters
Type
San Jose
Orlando
Tornado activity compared to U.S. average
9%
150.1%
Earthquake activity compared to U.S. average
7,785.3%
11.3%
Natural disasters compared to U.S. average
19%
20%
Transportation
Public transportation is more developed in San Jose, with multiple options including the Bay Area Rapid Transit (BART), buses, and light rail. On the other hand, Orlando relies heavily on cars, although buses and a commuter rail system are available.
Transport
Type
San Jose
Orlando
Amtrak stations
1
1
Amtrak stations nearby
3
3
FAA registered aircraft
553
616
FAA registered aircraft manufacturers and dealers
13
61
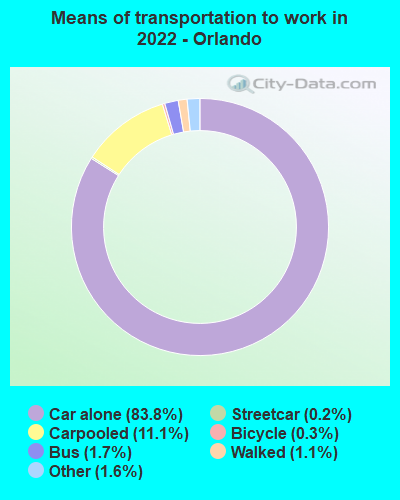
Means of transportation to work
Type
San Jose
Orlando
Bicycle
1%
0.3%
Bus
1.1%
1.7%
Carpooled
11.4%
10.9%
Car alone
80.5%
83.7%
Motorcycle
0.2%
0.2%
Railroad
0.2%
0%
Subway
0.2%
0.1%
Taxicab
0%
0.1%
Walked
3.3%
1.5%
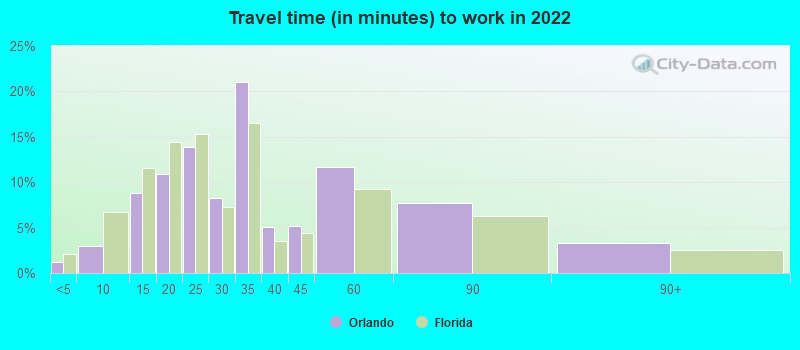
Average travel time to work
Type
San Jose
Orlando
Average
29.2 min
33.2 min
Other means
27.9 min
24.4 min
Public transportation
48.5 min
49.2 min
Private vehicle occupancy
Type
San Jose
Orlando
Average
1.2
1.1
Drove alone
87.3%
89.9%
In 2 person carpool
8.9%
7.2%
In 3 person carpool
1.9%
2%
In 4 person carpool
1.1%
0.4%
In 5-6 person carpool
0.6%
0.3%
In 7+ person carpool
0.2%
0.1%
How many people usually rode to work in the car, truck or van.
Real Estate
Housing in San Jose is significantly more expensive than in Orlando. The vast difference in real estate prices is a key factor in the cost of living divergence between the two cities.
Neighborhoods
San Jose has diverse neighborhoods, ranging from the hustle and bustle of downtown to quiet suburban areas. Orlando has a mix of urban and suburban neighborhoods, with many communities designed around lakes.
Houses and residents
Type
San Jose
Orlando
Houses
340,561
149,940
Average household size (people)
3.1
2.3
Median year apartment built
1979
1992
Median year house/condo built
1973
1987
Length of stay in the house since moving in
15.6 years
10.7 years
Houses occupied
322,881 (94.8%)
130,037 (86.7%)
Houses occupied by owners
179,797 (55.7%)
49,048 (37.7%)
Houses occupied by renters
143,084 (44.3%)
80,989 (62.3%)
Median rent asked for vacant for-rent units
$3,214
$1,141
Median monthly housing costs
$2,463
$1,401
Median price asked for vacant for-sale houses and condos
$1,197,016
$310,225
Estimated median house or condo value
Over $1,000,000
$319,800
Median numbers of rooms
4.9
4.5
Median number of rooms in apartments
3.6
3.9
Median number of rooms in houses and condos
6
5.9
Median house price - detached houses
Over $1,000,000
$429,298
Median house price - in 2-unit structures
$753,788
$232,136
Median house price - in 3-to-4-unit structures
$680,453
$131,385
Median house price - in 5 or more unit structures
$688,625
$225,567
Median house price - mobile homes
$240,963
$190,092
Median house price - Townhouses or other attached units
$892,629
$309,224
Median house price - All housing units
Over $1,000,000
$378,951
Median house age
45
31
Renting percentage
41.5%
60.5%
Housing density (houses/condos per square mile)
1,947.6
1,603.7
House value disparities
21.2%
34.3%
Household income disparities
38.3%
47.8%
Median household income for houses/condes with a mortgage
$197,583
$106,563
Median household income for apartments without a mortgage
$103,711
$44,446
Housing units without a mortgage
2,632 (2.1%)
853 (2.5%)
Housing units with both a second mortgage and home equity loan
13,499 (10.6%)
2,153 (6.4%)
Housing units with a mortgage
124,224 (97.9%)
33,038 (97.5%)
Housing units with a home equity loan
346 (0.3%)
174 (0.5%)
Housing units with a second mortgage
16,249 (12.8%)
2,480 (7.3%)
House/condo owner moved in on average (years ago)
14
6
House/condo renter moved in on average (years ago)
3
1
Housing units lacking complete kitchen facilities
1.2%
0.4%
Housing units lacking complete plumbing facilities
0.6%
0.2%
Housing units in structures
Housing units in structures
San Jose
Orlando
One, detached
50.9%
31.1%
One, attached
11.5%
10.2%
Two
1.1%
2.4%
3 or 4
5.0%
6.2%
5 to 9
5.1%
11.0%
10 to 19
4.5%
14.4%
20 to 49
4.5%
12.5%
50 or more
14.2%
12.1%
Mobile homes
3.1%
0.2%
Boats, RVs, vans, etc.
0.1%
0.0%
Median real estate property taxes paid for housing units
Self-employed workers in own not incorporated business
28,517
9,860
State government workers
10,222
4,084
Unpaid family workers
472
397
Industries and Occupations
San Jose's dominant industries are tech and IT, with occupations in software development, engineering, and IT management. Orlando's economy is heavily concentrated in tourism, hospitality, and entertainment.
Both cities have highly rated hospitals and health care facilities. San Jose is in proximity to renowned medical institutions like Stanford Health Care, while Orlando boasts the AdventHealth network.
Health (county statistics)
Type
San Jose
Orlando
General health status score of residents in this county from 1 (poor) to 5 (excellent)
San Jose benefits from the established infrastructure of the Bay Area. Orlando is mostly flat, with infrastructure centered around tourism, including hotels, theme parks, and convention centers.
Infrastructure
Type
San Jose
Orlando
Hospitals
20
10
TV stations
9
29
Arenas or stadiums
2
2
Bank branches located here
145
194
Bank institutions located here
25
31
Main business address for public companies
74
39
Drinking water stations with no reported violations in the past
21
13
Drinking water stations with reported violations in the past
HMDA - Conventional home purchase loans - Applications denied
Year
San Jose
Orlando
1999
3,839
1,290
2000
2,577
623
2001
1,953
376
2002
1,908
316
2003
3,578
778
2004
5,489
1,264
2005
6,994
2,988
2006
6,324
3,465
2007
4,298
3,112
2008
2,419
1,210
2009
1,631
324
Culture and Food
San Jose has a rich blend of cultures, with a noticeable influence of Latino, Vietnamese and Indian communities. This multiculturalism is reflected in the city's food scene. Orlando is known for its Southern food, comfort fare, and a growing food truck scene.
Sports Teams
San Jose is home to the Sharks (NHL) and Earthquakes (MLS). Orlando hosts the Magic (NBA), Solar Bears (ECHL), City Lions (MLS), and Pride (NWSL).


 San Jose, CA
 Orlando, FL