San Jose and San Bernardino, both nestled within the diverse state of California, each provide unique living experiences. The high-tech hub of San Jose contrasts San Bernardino’s affordability and proximity to nature, appealing to respectively different demographics. Whether your priority lies in economic wealth, outdoor activities, cost of living, or cultural experiences, these cities offer distinct characteristics that affect their residents’ way of life.
Distance between
San Jose, CA and
San Bernardino, CA : 337.7 miles
San Jose's population is larger by 343%. Its population has grown by 88,546 people (9.9%) since 2000. The population of San Bernardino has grown by 36,802 people (19.9%) during that time.
San Jose enjoys a lower crime rate compared to San Bernardino with the latter having rates higher than the national average. While no city is without crime, potential residents and tourists should consider these statistics while making decisions. Both cities are implementing crime prevention measures, and continuous efforts are being made to improve safety.
City-data.com crime index counts serious crimes and violent crime more heavily. It adjusts for the number of visitors and daily workers commuting into cities. (higher means more crime, U.S. average = 301.1)
City-data.com crime index counts serious crimes and violent crime more heavily. It adjusts for the number of visitors and daily workers commuting into cities. (higher means more crime, U.S. average = 301.1)
Sex Offenders
According to our data, there are 1,806 registered sex offenders living in San Jose and 698 registered sex offenders living in . The ratio of residents to sex offenders in San Jose is 568 to 1; the ratio in San Bernardino is 310 to 1. The number of registered sex offenders compared to the number of residents is a smaller in San Jose than in San Bernardino.
Cost of Living
As part of the booming Bay Area, San Jose's cost of living is significantly higher than San Bernardino. The high cost is influenced by housing prices, which are among the highest in the nation. Conversely, San Bernardino is more affordable, making it appealing for individuals and families desiring a Californian lifestyle on a budget.
Income Tax
Income tax in California is progressive and high, affecting both cities equally. The tax rates vary based on income levels with rates ranging from 1% to 13.3%.
Property Tax
Property taxes are also significant in both cities. San Jose, with its higher property values, generally leads to higher property tax bills. San Bernardino homeowners typically pay less due to the lower property value.
Sales Tax
San Jose residents bear a higher tax burden with a combined city and state sales tax rate of 9.25%, while San Bernardino has a lower combined rate of 7.75%.
Income
Type
San Jose
San Bernardino
Estimated median household income
$126,377
$65,311
Estimated per capita income
$57,357
$22,624
Cost of living index (U.S. average is 100)
127.4
82.2
If you make $50,000 in San Bernardino, you will have to make $77,494 in San Jose to maintain the same standard of living.
Geographical Conditions
Nestled in the Santa Clara Valley, San Jose is surrounded by rolling hills and enjoys proximity to the ocean. San Bernardino is located in a valley and is notably close to various national forests and mountain ranges, offering numerous opportunities for outdoor adventures.
San Jose holds an edge in education, housing several higher education institutions including the renowned San Jose State University. The city's high school graduation rate is higher than that of San Bernardino. However, San Bernardino does offer quality education, especially through the California State University, San Bernardino.
San Jose, known as the capital of Silicon Valley, boasts a strong economy, particularly in the tech industry. Unemployment rates are low, and salary ranges are high. On the other hand, while San Bernardino's economy is more modest, it has a more varied job market across sectors like logistics, health care, and education.
Biggest Employers
San Jose's largest employers are primarily tech companies, with giants like Cisco Systems and eBay headquartered there. San Bernardino hosts major employers like the California State University, San Bernardino, and St. Bernardine Medical Center.
There were 299 building permits issued in San Jose in 2012 (216 more than in 2011) compared to 143 building permits issued in San Bernardino in 2012 (119 more than in 2011).
In San Jose (Santa Clara County), 70.0% voted for Democrats and 27.1% for Republicans in 2012 Presidential Election. In San Bernardino (San Bernardino County), 52.3% voted for Democrats and 45.0% for Republicans.
Elections
Type
Democrats
Republicans
Other
Year
San Jose
San Bernardino
San Jose
San Bernardino
San Jose
San Bernardino
2020
72.7%
54.2%
25.2%
43.6%
2.1%
2.2%
2016
72.7%
52.1%
20.6%
41.5%
6.7%
6.4%
2012
70.0%
52.3%
27.1%
45.0%
2.9%
2.6%
2008
69.6%
52.2%
28.6%
45.8%
1.8%
2.0%
2004
64.3%
43.8%
34.8%
55.6%
0.9%
0.6%
2000
60.7%
47.3%
34.4%
48.8%
4.9%
3.9%
1996
56.9%
44.4%
32.2%
43.6%
11.0%
12.1%
Breakdown of population affiliated with a religious congregation
Type
Adherents
Congregations
Religion
San Jose
San Bernardino
San Jose
San Bernardino
CATHOLIC CHURCH
25.1%
21.9%
6.0%
4.3%
MUSLIM ESTIMATE
1.1%
0.6%
1.8%
1.1%
SOUTHERN BAPTIST CONVENTION
0.9%
2.2%
7.7%
9.6%
EPISCOPAL CHURCH
0.5%
0.1%
2.3%
1.3%
SEVENTH DAY ADVENTIST CHURCH
0.4%
1.6%
2.6%
4.6%
EVANGELICAL LUTHERAN CHURCH IN AMERICA
0.3%
0.2%
2.3%
1.5%
Weather
San Jose witnesses a Mediterranean climate, characterized by warm, dry summers and mild, wet winters. San Bernardino, located in California's Inland Empire, sees hotter, drier summers and cooler winters compared to San Jose. Both cities, however, boast plenty of sunshine year-round welcoming tourists and residents alike.
Weather and climate
Type
San Jose
San Bernardino
Temperature - Average
60.9°F
64.8°F
Humidity - Average morning or afternoon humidity
77.3%
65.9%
Humidity - Differences between morning and afternoon humidity
35.5%
20.5%
Humidity - Maximum monthly morning or afternoon humidity
87%
72.2%
Humidity - Minimum monthly morning or afternoon humidity
51.6%
51.7%
Precipitation - Yearly average
16.1 in
17.9 in
Snowfall - Yearly average
0 in
0 in
Clouds - Number of days clear of clouds
27.4%
27.5%
Sunshine amount - Average
73.8%
78.3%
Sunshine amount - Differences during a year
23%
21.4%
Sunshine amount - Maximum monthly
77.4%
84.2%
Sunshine amount - Minimum monthly
54.4%
62.7%
Wind speed - Average
10.3 mph
4.1 mph
Average climate in San Jose, California
Average climate in San Bernardino, California
Air pollution
Type
AQI
CO
NO2
OZONE
PB
PM10
PM25
SO2
Year
San Jose
San Bernardino
San Jose
San Bernardino
San Jose
San Bernardino
San Jose
San Bernardino
San Jose
San Bernardino
San Bernardino
San Jose
San Bernardino
San Jose
San Bernardino
2018
94
153
0.49
0.33
14.5
15.5
22.2
32.1
0.006
0.006
29.9
N/A
12.5
11.7
0.2
0.4
2017
91
148
0.50
0.40
14.6
15.7
23.5
33.9
0.004
0.004
32.0
N/A
10.2
13.3
0.2
0.3
2016
69
140
0.47
0.52
13.7
15.9
22.4
32.0
0.003
0.006
33.9
N/A
8.8
11.8
0.2
0.3
2015
84
147
0.52
0.49
15.4
15.8
22.3
32.3
0.004
0.004
31.5
N/A
9.2
12.7
0.3
0.3
2014
83
147
0.40
0.47
13.9
16.4
21.5
30.8
0.004
0.006
35.0
N/A
8.2
14.3
0.2
0.3
2013
90
147
0.41
0.42
15.2
17.0
20.8
28.8
0.005
0.006
32.2
N/A
12.4
13.2
0.3
0.3
2012
74
148
0.35
0.44
13.3
18.0
21.8
28.8
0.003
0.007
31.8
N/A
10.1
14.2
0.3
0.4
2011
83
150
0.37
0.35
14.8
18.0
20.6
27.9
0.003
0.006
30.6
N/A
12.3
17.7
0.3
0.4
2010
88
144
0.35
0.36
14.4
18.8
20.4
28.1
0.004
0.008
28.8
N/A
9.0
15.5
0.4
1.1
2009
89
151
0.40
0.35
14.7
20.0
18.2
28.1
0.004
0.011
31.9
N/A
9.3
17.5
0.3
1.2
2008
100
152
0.45
0.39
16.7
20.1
20.6
27.7
N/A
0.012
36.9
N/A
12.6
22.0
N/A
1.2
2007
92
132
0.44
0.49
16.6
22.5
20.0
25.9
0.009
0.016
N/A
N/A
11.1
N/A
N/A
1.7
2006
100
128
0.46
0.53
18.0
24.5
21.8
25.4
N/A
0.010
N/A
N/A
11.1
N/A
N/A
1.6
2005
95
132
0.68
0.58
18.6
26.8
20.0
24.4
N/A
0.011
N/A
N/A
11.6
N/A
N/A
2.7
2004
98
140
0.63
0.64
18.5
22.9
20.4
25.0
N/A
0.013
N/A
N/A
9.9
N/A
N/A
2.2
2003
87
143
0.73
0.97
20.6
26.9
19.1
24.3
N/A
0.032
N/A
N/A
N/A
N/A
N/A
1.5
2002
78
140
0.65
0.92
19.5
29.4
18.0
24.0
0.006
0.018
N/A
N/A
N/A
N/A
N/A
0.6
2001
75
144
0.61
0.81
18.5
30.9
16.8
26.4
0.008
0.039
N/A
N/A
N/A
N/A
N/A
1.1
2000
65
155
0.66
0.86
18.9
30.1
15.6
21.9
0.009
0.040
N/A
N/A
N/A
N/A
N/A
1.6
Natural disasters
Type
San Jose
San Bernardino
Tornado activity compared to U.S. average
9%
15.9%
Earthquake activity compared to U.S. average
7,785.3%
7,481.9%
Natural disasters compared to U.S. average
19%
46%
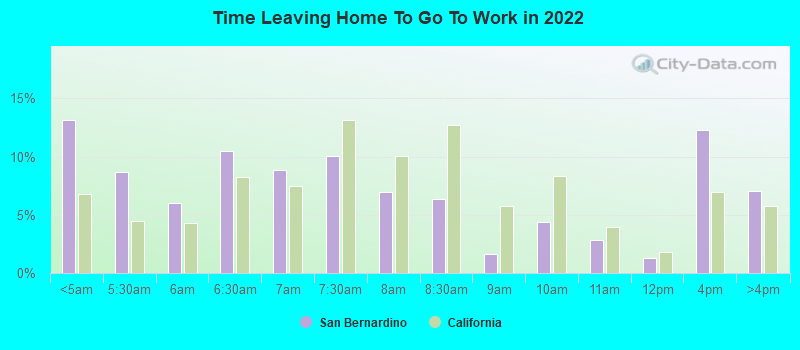
Transportation
Public transportation in San Jose is efficient with multiple options like buses, light rail, and bike-sharing. Commuting is a part of life here given its status as a job hub. San Bernardino, while smaller, has an established public transit system with the Omnitrans bus service and Metrolink trains.
Transport
Type
San Jose
San Bernardino
Amtrak stations
1
1
Amtrak stations nearby
3
3
FAA registered aircraft
553
80
FAA registered aircraft manufacturers and dealers
13
3
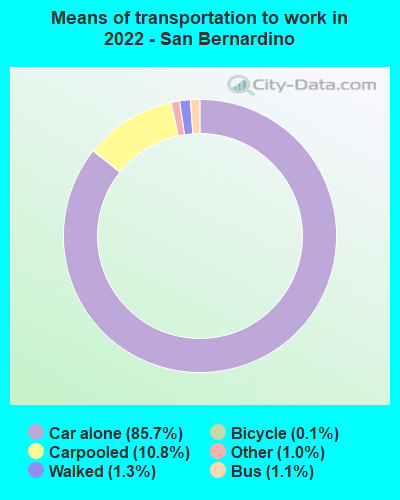
Means of transportation to work
Type
San Jose
San Bernardino
Bicycle
1%
0.4%
Bus
1.1%
0.7%
Carpooled
11.4%
13.2%
Car alone
80.5%
82.9%
Motorcycle
0.2%
0.2%
Railroad
0.2%
0.2%
Subway
0.2%
0%
Walked
3.3%
1.4%
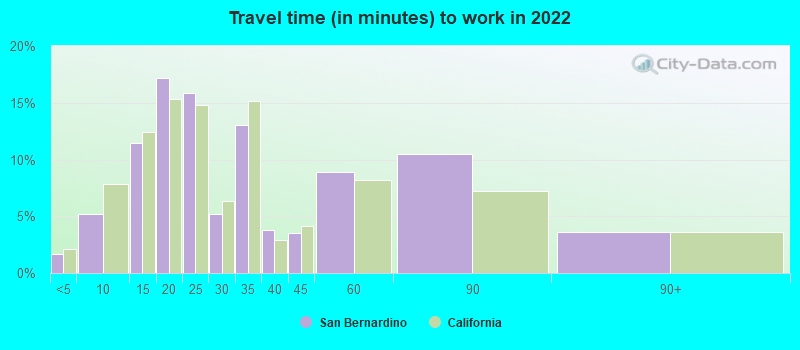
Average travel time to work
Type
San Jose
San Bernardino
Average
29.2 min
30.8 min
Other means
27.9 min
26.8 min
Public transportation
48.5 min
45.7 min
Private vehicle occupancy
Type
San Jose
San Bernardino
Average
1.2
1.2
Drove alone
87.3%
85.5%
In 2 person carpool
8.9%
10.7%
In 3 person carpool
1.9%
2.8%
In 4 person carpool
1.1%
0.3%
In 5-6 person carpool
0.6%
0.5%
In 7+ person carpool
0.2%
0.1%
How many people usually rode to work in the car, truck or van.
Real Estate
San Jose’s real estate market is highly competitive and expensive, reflecting the city's desirability and high median income. San Bernardino’s real estate market offers more affordability, providing a broader range of housing options and greater accessibility for first-time homebuyers.
Neighborhoods
San Jose’s diverse neighborhoods range from the affluent Willow Glen and Silver Creek to the bustling downtown area. San Bernardino offers neighborhoods like the historic downtown district and the quiet, residential Del Rosa, providing a range of lifestyle options.
Houses and residents
Type
San Jose
San Bernardino
Houses
340,561
66,188
Average household size (people)
3.1
3.4
Median year apartment built
1979
1978
Median year house/condo built
1973
1969
Length of stay in the house since moving in
15.6 years
13.1 years
Houses occupied
322,881 (94.8%)
63,331 (95.7%)
Houses occupied by owners
179,797 (55.7%)
32,391 (51.1%)
Houses occupied by renters
143,084 (44.3%)
30,940 (48.9%)
Median rent asked for vacant for-rent units
$3,214
$1,123
Median monthly housing costs
$2,463
$1,342
Median price asked for vacant for-sale houses and condos
$1,197,016
$195,043
Estimated median house or condo value
Over $1,000,000
$350,000
Median numbers of rooms
4.9
5
Median number of rooms in apartments
3.6
4.1
Median number of rooms in houses and condos
6
5.8
Median house price - detached houses
Over $1,000,000
$403,627
Median house price - in 3-to-4-unit structures
$680,453
$150,029
Median house price - in 5 or more unit structures
$688,625
$162,515
Median house price - mobile homes
$240,963
$234,640
Median house price - Townhouses or other attached units
$892,629
$280,582
Median house price - All housing units
Over $1,000,000
$380,769
Median house age
45
47
Renting percentage
41.5%
49.7%
Housing density (houses/condos per square mile)
1,947.6
1,125.4
House value disparities
21.2%
26.6%
Household income disparities
38.3%
41.1%
Median household income for houses/condes with a mortgage
$197,583
$92,118
Median household income for apartments without a mortgage
$103,711
$67,257
Housing units without a mortgage
2,632 (2.1%)
127 (0.6%)
Housing units with both a second mortgage and home equity loan
13,499 (10.6%)
762 (3.4%)
Housing units with a mortgage
124,224 (97.9%)
22,340 (99.4%)
Housing units with a home equity loan
346 (0.3%)
0 (0%)
Housing units with a second mortgage
16,249 (12.8%)
1,041 (4.6%)
House/condo owner moved in on average (years ago)
14
12
House/condo renter moved in on average (years ago)
3
3
Housing units lacking complete kitchen facilities
1.2%
2.8%
Housing units lacking complete plumbing facilities
0.6%
0.6%
Housing units in structures
Housing units in structures
San Jose
San Bernardino
One, detached
50.9%
62.2%
One, attached
11.5%
4.2%
Two
1.1%
0.9%
3 or 4
5.0%
4.1%
5 to 9
5.1%
4.6%
10 to 19
4.5%
4.5%
20 to 49
4.5%
3.0%
50 or more
14.2%
10.3%
Mobile homes
3.1%
6.1%
Boats, RVs, vans, etc.
0.1%
0.1%
Median real estate property taxes paid for housing units
Self-employed workers in own not incorporated business
28,517
5,389
State government workers
10,222
4,741
Unpaid family workers
472
290
Industries and Occupations
While San Jose's economy primarily orbits around the tech industry, San Bernardino supports a diverse range of industries including logistics, healthcare, and public administration. Professionals in technology would be drawn to San Jose while those interested in logistics, manufacturing, or education might find San Bernardino more appealing.
San Jose offers high-quality healthcare with top ranking hospitals like the Stanford Health Care. San Bernardino, while smaller, provides competent healthcare services with establishments such as the Dignity Health – St. Bernardine Medical Center.
Health (county statistics)
Type
San Jose
San Bernardino
General health status score of residents in this county from 1 (poor) to 5 (excellent)
San Jose's infrastructure is well-developed, catering to its large population and tech-oriented lifestyle. San Bernardino, while smaller, has also made significant improvements in its infrastructure, especially in terms of healthcare facilities and transportation networks.
Infrastructure
Type
San Jose
San Bernardino
Hospitals
20
8
TV stations
9
6
Arenas or stadiums
2
1
Bank branches located here
145
18
Bank institutions located here
25
8
Drinking water stations with no reported violations in the past
21
11
Drinking water stations with reported violations in the past
HMDA - Conventional home purchase loans - Applications denied
Year
San Jose
San Bernardino
1999
3,839
586
2000
2,577
503
2001
1,953
470
2002
1,908
707
2003
3,578
1,513
2004
5,489
2,236
2005
6,994
3,147
2006
6,324
3,423
2007
4,298
1,714
2008
2,419
554
2009
1,631
285
Culture and Food
San Jose offers a vibrant cultural experience, with a rich history, diverse population, and thriving arts scene. Its food scene is equally diverse, influenced by various cultures. San Bernardino, though smaller, has a unique charm with numerous festivals, historic sites, and classic Californian cuisine.
Sports Teams
San Jose residents enthusiastically support their local teams such as the San Jose Sharks (NHL) and the Earthquakes (MLS). San Bernardino, lacking major professional sports teams, still enjoys sports through local college teams and minor league franchises.


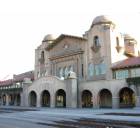

 San Jose, CA
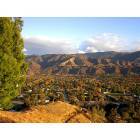
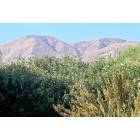
 San Bernardino, CA