When comparing Seattle, WA and Stockton, CA, factors such as cost of living, crime rates, quality of education, and available employment opportunities can greatly differ. The weather, public transportation, healthcare, and cultural experiences can vary between these two cities as well. Whether one is planning to relocate or simply visit, understanding these aspects can help paint a more defined picture of what life is like in each city.
Distance between
Seattle, WA and
Stockton, CA : 668.8 miles
Seattle's population is larger by 128%. Its population has grown by 170,545 people (30.3%) since 2000. The population of Stockton has grown by 78,349 people (32.1%) during that time.
Seattlites generally feel safe in their city. The overall crime rate is just above the national average with high patrols and a comprehensive emergency response system. Meanwhile, Stockton struggles with a higher crime rate which falls significantly above the national average. However, recent efforts have been made to improve public safety, including neighborhood watch programs and a police force expansion.
City-data.com crime index counts serious crimes and violent crime more heavily. It adjusts for the number of visitors and daily workers commuting into cities. (higher means more crime, U.S. average = 301.1)
City-data.com crime index counts serious crimes and violent crime more heavily. It adjusts for the number of visitors and daily workers commuting into cities. (higher means more crime, U.S. average = 301.1)
Sex Offenders
According to our data, there are 481 registered sex offenders living in Seattle and 958 registered sex offenders living in . The ratio of residents to sex offenders in Seattle is 1,464 to 1; the ratio in Stockton is 321 to 1. The number of registered sex offenders compared to the number of residents is a lot smaller in Seattle than in Stockton.
Cost of Living
The cost of living in Seattle is significantly higher than in Stockton. Though higher wages partly balance out the cost, housing remains more expensive. Stockton presents a more affordable option, especially favorable for retirees and families starting up.
Income Tax
Washington state, including Seattle, does not have a state income tax. California, however, does have a state income tax, which impacts Stockton residents.
Property Tax
Property tax in Seattle varies based on location but averages at about 1%. Stockton’s rate is slightly higher at 1.17%.
Sales Tax
Seattle has a relatively high sales tax rate at around 10.1%. Stockton comes in lower at approximately 9%.
Income
Type
Seattle
Stockton
Estimated median household income
$110,781
$69,844
Estimated per capita income
$74,733
$26,811
Cost of living index (U.S. average is 100)
118.5
99.1
If you make $50,000 in Stockton, you will have to make $59,788 in Seattle to maintain the same standard of living.
Geographical Conditions
Seattle is characterized by waterways and mountains, offering numerous outdoor activities. Stockton is located in the Central Valley of California, offering flat terrain and an agricultural landscape with several vineyards and farmlands.
Seattle's education system, including its public schools and universities like the University of Washington, is highly regarded nationally. Stockton is home to the University of the Pacific and Delta College, but school rankings overall trail behind Seattle's.
Seattle's robust economy is driven by a diverse set of industries. Iconic companies like Amazon and Microsoft are headquartered here, providing abundant job opportunities. Stockton's economy is focused on agriculture and manufacturing, though it has faced significant economic challenges in recent years.
Biggest Employers
Seattle's leading employers are Amazon, Microsoft, and the University of Washington. In Stockton, key employers include O'Reilly Auto Parts, Diamond Foods, and San Joaquin Delta College.
There were 264 building permits issued in Seattle in 2012 (52 less than in 2011) compared to 548 building permits issued in Stockton in 2012 (421 more than in 2011).
In Seattle (King County), 69.0% voted for Democrats and 28.5% for Republicans in 2012 Presidential Election. In Stockton (San Joaquin County), 55.6% voted for Democrats and 41.9% for Republicans.
Elections
Type
Democrats
Republicans
Other
Year
Seattle
Stockton
Seattle
Stockton
Seattle
Stockton
2020
75.1%
55.6%
22.3%
41.8%
2.6%
2.6%
2016
70.0%
53.4%
21.1%
39.2%
8.9%
7.5%
2012
69.0%
55.6%
28.5%
41.9%
2.5%
2.5%
2008
70.2%
54.2%
28.1%
43.6%
1.7%
2.2%
2004
65.1%
46.3%
33.8%
53.7%
1.1%
0.0%
2000
60.3%
47.9%
34.5%
49.1%
5.2%
3.0%
1996
56.4%
46.3%
31.4%
44.9%
12.2%
8.8%
Breakdown of population affiliated with a religious congregation
Type
Adherents
Congregations
Religion
Seattle
Stockton
Seattle
Stockton
CATHOLIC CHURCH
14.4%
26.8%
4.9%
4.0%
EVANGELICAL LUTHERAN CHURCH IN AMERICA
1.3%
0.2%
4.7%
0.7%
EPISCOPAL CHURCH
0.8%
0.1%
2.4%
0.7%
AMERICAN BAPTIST CHURCHES IN THE USA
0.6%
0.3%
2.9%
1.1%
MUSLIM ESTIMATE
0.6%
1.5%
1.4%
2.0%
SEVENTH DAY ADVENTIST CHURCH
0.6%
0.7%
2.3%
3.1%
LUTHERAN CHURCH
0.5%
0.4%
2.0%
1.1%
SOUTHERN BAPTIST CONVENTION
0.3%
1.1%
3.8%
10.2%
CHRISTIAN REFORMED CHURCH NORTH AMERICA
0.1%
0.4%
0.8%
1.3%
NORTH AMERICAN BAPTIST CONFERENCE
0.0%
0.6%
0.2%
1.3%
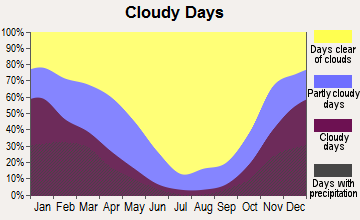
Weather
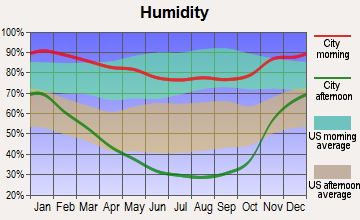
Seattle boasts a marine west coast climate characterized by cool, wet winters and warm, dry summers. On the other hand, Stockton experiences a Mediterranean climate with hot, dry summers and mild, wet winters, offering a sunny alternative for those who prefer less rain.
Weather and climate
Type
Seattle
Stockton
Temperature - Average
52.5°F
60.9°F
Humidity - Average morning or afternoon humidity
78.5%
63.2%
Humidity - Differences between morning and afternoon humidity
38%
59%
Humidity - Maximum monthly morning or afternoon humidity
86%
86%
Humidity - Minimum monthly morning or afternoon humidity
48%
27%
Precipitation - Yearly average
36.6 in
16.6 in
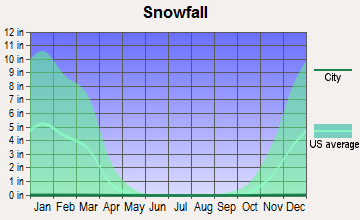
Snowfall - Yearly average
21.4 in
0 in
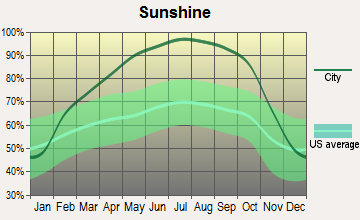
Clouds - Number of days clear of clouds
11.6%
30.7%
Sunshine amount - Average
49.4%
81.6%
Sunshine amount - Differences during a year
44%
44.4%
Sunshine amount - Maximum monthly
64%
91.9%
Sunshine amount - Minimum monthly
20%
47.5%
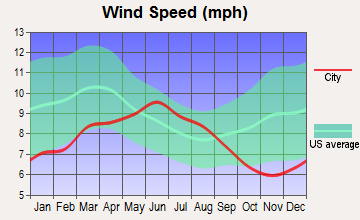
Wind speed - Average
8.6 mph
8.3 mph
Average climate in Seattle, Washington
Average climate in Stockton, California
Air pollution
Type
AQI
CO
NO2
OZONE
PB
PM10
PM25
SO2
Year
Seattle
Stockton
Seattle
Stockton
Seattle
Stockton
Seattle
Stockton
Seattle
Stockton
Seattle
Stockton
Seattle
Stockton
Seattle
Stockton
2018
82
124
0.21
0.30
10.6
12.2
20.7
23.2
N/A
0.006
N/A
30.5
8.3
16.5
0.7
0.8
2017
92
108
0.23
0.29
11.1
11.3
21.0
23.4
N/A
0.005
N/A
27.4
8.8
12.3
0.3
1.5
2016
67
111
0.22
0.26
11.9
12.2
20.3
21.7
N/A
0.005
N/A
22.2
6.6
12.7
0.6
1.5
2015
81
113
0.23
0.27
10.8
11.9
19.3
24.0
N/A
0.005
N/A
26.3
8.5
12.7
0.8
1.0
2014
75
109
0.24
0.26
11.5
13.4
19.5
26.1
N/A
0.005
N/A
26.9
7.4
11.5
N/A
0.8
2013
81
111
0.24
0.31
N/A
15.5
17.4
23.8
N/A
0.005
N/A
29.8
9.1
15.7
0.8
0.6
2012
77
114
0.23
0.19
N/A
14.4
19.5
24.2
N/A
0.005
N/A
24.0
7.7
12.4
1.0
0.7
2011
72
105
0.24
0.25
N/A
15.5
18.6
22.1
N/A
0.003
N/A
23.5
7.5
12.6
1.1
0.9
2010
71
96
0.24
0.14
N/A
13.9
18.0
21.9
N/A
0.003
N/A
14.0
6.7
9.1
1.1
1.1
2009
94
98
0.27
0.20
N/A
15.3
17.7
21.1
N/A
0.005
N/A
15.8
8.0
6.0
1.4
1.0
2008
80
107
0.30
0.26
N/A
16.8
17.8
22.7
N/A
N/A
N/A
24.7
6.5
10.2
1.3
1.1
2007
83
110
0.30
0.34
N/A
16.4
18.2
21.5
N/A
0.009
20.3
19.5
7.9
12.5
1.5
1.1
2006
98
94
N/A
0.41
N/A
18.4
18.3
22.1
N/A
N/A
22.6
N/A
8.7
N/A
N/A
2.1
2005
101
81
0.80
0.44
18.3
17.2
N/A
20.1
N/A
N/A
24.5
N/A
9.5
N/A
3.5
2.0
2004
102
82
0.81
0.47
17.9
17.1
N/A
19.9
N/A
N/A
N/A
25.2
10.3
N/A
3.0
1.6
2003
91
89
0.78
0.55
18.5
18.4
N/A
19.1
N/A
N/A
N/A
26.1
9.9
N/A
2.4
2.2
2002
87
86
0.82
0.53
19.3
20.5
N/A
18.9
N/A
0.007
N/A
29.2
11.7
N/A
2.7
2.5
2001
88
97
0.90
0.54
20.7
19.4
N/A
19.7
0.005
0.006
N/A
28.3
12.3
N/A
3.7
2.1
2000
98
99
1.06
0.64
20.9
21.2
N/A
18.9
N/A
0.007
N/A
25.9
13.3
N/A
3.2
1.6
Natural disasters
Type
Seattle
Stockton
Tornado activity compared to U.S. average
5.5%
10.1%
Earthquake activity compared to U.S. average
1,394.2%
8,060.1%
Natural disasters compared to U.S. average
30%
20%
Transportation
Seattle offers comprehensive public transit including buses, ferries, and a light-rail system. Traffic can be heavy due to population density, but commuting is manageable. Stockton has its own bus and rail system but relies more on car travel.
Transport
Type
Seattle
Stockton
Amtrak stations
1
2
Amtrak stations nearby
2
3
FAA registered aircraft
1
146
FAA registered aircraft manufacturers and dealers
2
9
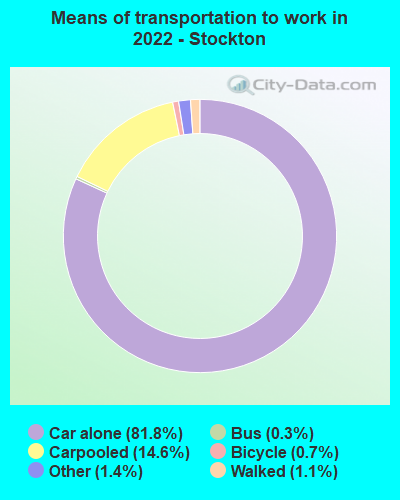
Means of transportation to work
Type
Seattle
Stockton
Bicycle
2.1%
0.2%
Bus
8.9%
0.6%
Carpooled
8.7%
13.3%
Car alone
67.8%
83.6%
Ferryboat
0.7%
0.1%
Motorcycle
0.3%
0.1%
Railroad
1.2%
0.1%
Streetcar
0.3%
0%
Subway
0.6%
0.1%
Taxicab
0.1%
0%
Walked
8%
1%
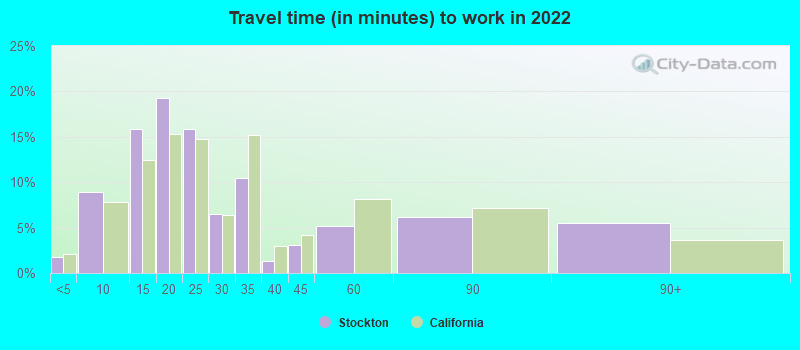
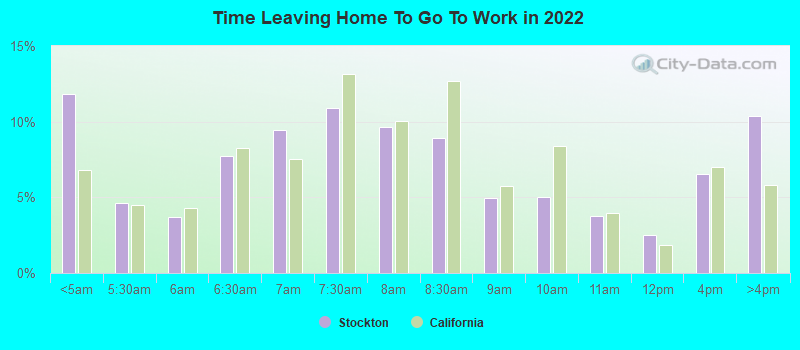
Average travel time to work
Type
Seattle
Stockton
Average
35 min
29.9 min
Other means
23.5 min
26.4 min
Public transportation
35.6 min
44.5 min
Private vehicle occupancy
Type
Seattle
Stockton
Average
1.2
1.2
Drove alone
89%
86.7%
In 2 person carpool
8.7%
8.9%
In 3 person carpool
0.8%
2.5%
In 4 person carpool
0.2%
0.7%
In 5-6 person carpool
1.1%
1%
In 7+ person carpool
0.2%
0.3%
How many people usually rode to work in the car, truck or van.
Real Estate
The real estate market in Seattle is competitive and expensive, with home prices and rents increasing yearly. Stockton offers more affordable options but has seen a recent rise in real-estate prices driven by commuters from the San Francisco Bay Area.
Neighborhoods
Seattle neighborhoods such as Capitol Hill and Ballard offer a vibrant urban experience. In Stockton, the Miracle Mile and Brookside neighborhoods are renowned for their charm and local businesses.
Houses and residents
Type
Seattle
Stockton
Houses
384,799
102,642
Average household size (people)
2.1
3.2
Median year apartment built
1987
1977
Median year house/condo built
1955
1983
Length of stay in the house since moving in
12.4 years
13.2 years
Houses occupied
351,650 (91.4%)
97,447 (94.9%)
Houses occupied by owners
161,587 (46%)
53,081 (54.5%)
Houses occupied by renters
190,063 (54%)
44,366 (45.5%)
Median rent asked for vacant for-rent units
$2,780
$586.05
Median monthly housing costs
$1,984
$1,381
Median price asked for vacant for-sale houses and condos
$860,506
$363,278
Estimated median house or condo value
$848,100
$382,900
Median numbers of rooms
4.1
5.3
Median number of rooms in apartments
3
4.4
Median number of rooms in houses and condos
6.3
6.2
Median house price - detached houses
Over $1,000,000
$374,875
Median house price - in 2-unit structures
$764,579
$434,326
Median house price - in 3-to-4-unit structures
$719,049
$234,826
Median house price - in 5 or more unit structures
$626,370
$243,924
Median house price - mobile homes
$226,727
$146,499
Median house price - Townhouses or other attached units
$925,507
$256,924
Median house price - All housing units
Over $1,000,000
$367,426
Median house age
47
42
Renting percentage
51.9%
48.4%
Housing density (houses/condos per square mile)
4,587.9
1,876.1
House value disparities
20.6%
23.2%
Household income disparities
42.2%
42.3%
Median household income for houses/condes with a mortgage
$189,767
$102,856
Median household income for apartments without a mortgage
$112,771
$70,897
Housing units without a mortgage
2,459 (2.1%)
338 (0.9%)
Housing units with both a second mortgage and home equity loan
12,354 (10.5%)
2,064 (5.6%)
Housing units with a mortgage
115,481 (97.9%)
36,674 (99.1%)
Housing units with a home equity loan
240 (0.2%)
329 (0.9%)
Housing units with a second mortgage
13,881 (11.8%)
2,814 (7.6%)
House/condo owner moved in on average (years ago)
8
11
House/condo renter moved in on average (years ago)
1
4
Housing units lacking complete kitchen facilities
2.2%
2.3%
Housing units lacking complete plumbing facilities
0.4%
1%
Housing units in structures
Housing units in structures
Seattle
Stockton
One, detached
39.6%
68.0%
One, attached
6.0%
6.7%
Two
2.0%
2.6%
3 or 4
3.2%
5.0%
5 to 9
5.7%
4.2%
10 to 19
7.0%
4.3%
20 to 49
11.9%
3.3%
50 or more
24.4%
4.6%
Mobile homes
0.1%
1.3%
Boats, RVs, vans, etc.
0.0%
0.1%
Median real estate property taxes paid for housing units
Self-employed workers in own not incorporated business
24,994
7,637
State government workers
27,235
6,210
Unpaid family workers
947
95
Industries and Occupations
Seattle has a thriving tech industry along with healthcare, manufacturing, and maritime trading. Stockton's economy is deeply rooted in agriculture, retail trade, and education services.
Seattle is a leading city in healthcare, housing some of the top hospitals and medical research institutes in the country. Stockton also holds a good healthcare system with multiple hospitals and health centers, but doesn't rival Seattle's extensive offerings.
Seattle's infrastructure is well-developed and continually updated, with a variety of renewable energy projects and high-speed internet access. Stockton, while growing, does not yet match Seattle's widespread technological infrastructure and thorough public services.
Infrastructure
Type
Seattle
Stockton
Hospitals
22
17
TV stations
17
14
Arenas or stadiums
5
2
Bank branches located here
236
54
Bank institutions located here
37
19
Main business address for public companies
54
2
Drinking water stations with no reported violations in the past
3
14
Drinking water stations with reported violations in the past
HMDA - Conventional home purchase loans - Applications denied
Year
Seattle
Stockton
1999
1,357
548
2000
1,148
606
2001
890
597
2002
840
622
2003
1,421
1,557
2004
1,810
2,481
2005
2,341
3,201
2006
2,789
3,075
2007
2,273
1,611
2008
1,113
744
2009
748
362
Culture and Food
Seattle is known for its artistic culture, diverse food scene, and coffee houses. Stockton offers a rich history with a mix of cuisines influenced by its diverse ethnic communities.
Sports Teams
Seattle is home to the Seahawks (NFL), Sounders (MLS), and Mariners (MLB). The recent introduction of NHL team, the Seattle Kraken, has also excited the community. Stockton has minor league teams and is in proximity to major sports teams in San Francisco and Oakland.

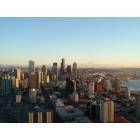

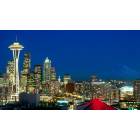
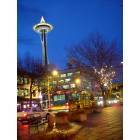
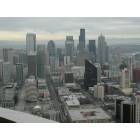
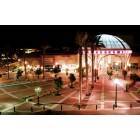
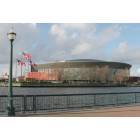
 Seattle, WA
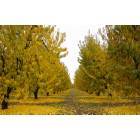
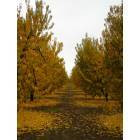
 Stockton, CA