When comparing Staten Island, NY to Cleveland, OH, we must consider a diverse range of factors, from crime rates and education to cost of living and culture. Both cities have their unique perks and quirks. Yet, for those considering a move or planning a visit, understanding the specifics of these parameters will help in making an informed decision.
In terms of crime rates, Cleveland, OH has a higher crime rate than Staten Island, NY. Violent crime rates per 100,000 citizens in Cleveland far surpass those in Staten Island. For visitors and residents alike, it's crucial to study neighborhood-specific crime rates.
Cost of Living
Living costs in Staten Island are notably higher, in part due to NY's overall high cost of living. Housing in Cleveland is significantly more affordable. Grocery costs, general goods and services, and healthcare also tend to be cheaper in Cleveland than in Staten Island.
Income Tax
Ohio, including Cleveland, has a lower overall income tax rate than New York. For high earners, this difference can be significant.
Property Tax
Property tax rates are higher on Staten Island compared to Cleveland. Considering property taxes is essential for potential homebuyers.
Sales Tax
New York City, including Staten Island, has a higher sales tax rate than Cleveland. Thus, products and services can be comparatively more expensive.
Income
Type
Staten Island
Cleveland
Estimated median household income
$86,054
$35,562
Estimated per capita income
$38,678
$24,093
Cost of living index (U.S. average is 100)
164.1
94.3
If you make $50,000 in Cleveland, you will have to make $87,010 in Staten Island to maintain the same standard of living.
Geographical Conditions
Staten Island is an island borough, abundant in parkland and beaches. Cleveland sits along Lake Erie, offering beautiful lakeside views and recreational activities.
Geographical information
Type
Staten Island
Cleveland
Land area
58.5 sq. miles
77.6 sq. miles
Population density
8,225.7 people per sq. mile
4,743.4 people per sq. mile
Relative area comparison
Staten Island, NY Cleveland, OH
Education
In education, Staten Island takes a slight edge with higher test scores and more funding per student. On the other hand, Cleveland offers a diverse range of reputable public and private schools and is home to numerous higher education institutions such as Case Western Reserve University.
Job opportunities between the two cities vary. Staten Island, being part of New York City, offers a vast array of opportunities in finance, tech, and media, among others. Cleveland's economy thrives on healthcare, manufacturing, and biotechnology. Unemployment rates can vary, so it's essential to consider the job market in your field.
Biggest Employers
The largest employers in Staten Island include the City of New York and Staten Island University Hospital. Cleveland Clinic and University Hospitals are among the biggest employers in Cleveland, reflecting the city's healthcare economy.
In Staten Island (Richmond County), 50.8% voted for Democrats and 48.3% for Republicans in 2012 Presidential Election. In Cleveland (Cuyahoga County), 69.7% voted for Democrats and 29.7% for Republicans.
Elections
Type
Democrats
Republicans
Other
Year
Staten Island
Cleveland
Staten Island
Cleveland
Staten Island
Cleveland
2020
42.2%
66.5%
57.1%
32.4%
0.7%
1.1%
2016
41.0%
65.5%
56.1%
30.3%
2.9%
4.1%
2012
50.8%
69.7%
48.3%
29.7%
0.9%
0.5%
2008
47.8%
69.1%
51.9%
30.1%
0.4%
0.8%
2004
42.8%
66.6%
56.5%
32.9%
0.7%
0.5%
2000
52.1%
62.9%
45.1%
33.6%
2.9%
3.5%
1996
50.5%
60.8%
40.8%
29.1%
8.7%
10.1%
Breakdown of population affiliated with a religious congregation
Type
Adherents
Congregations
Religion
Staten Island
Cleveland
Staten Island
Cleveland
CATHOLIC CHURCH
54.2%
28.6%
20.6%
11.3%
MUSLIM ESTIMATE
1.7%
0.3%
3.0%
1.4%
AMERICAN BAPTIST CHURCHES IN THE USA
0.6%
1.6%
1.0%
3.2%
EVANGELICAL LUTHERAN CHURCH IN AMERICA
0.6%
1.1%
4.0%
3.9%
COPTIC ORTHODOX CHURCH
0.5%
0.1%
1.0%
0.1%
EPISCOPAL CHURCH
0.4%
0.6%
5.0%
2.2%
LUTHERAN CHURCH
0.2%
1.4%
1.5%
4.0%
SOUTHERN BAPTIST CONVENTION
0.2%
0.4%
3.5%
3.0%
SEVENTH DAY ADVENTIST CHURCH
0.1%
0.4%
2.5%
1.6%
Weather
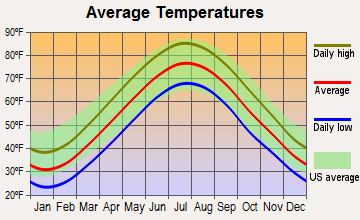
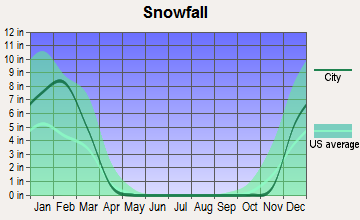
Those who prefer cooler climates might prefer Cleveland. It experiences a typical Midwest climate with cold, snowy winters and warm, humid summers. Staten Island, though also having four seasons, has milder winters and less snowfall. City-specific weather updates can assist residents and tourists alike.
Weather and climate
Type
Staten Island
Cleveland
Temperature - Average
54.1°F
50.1°F
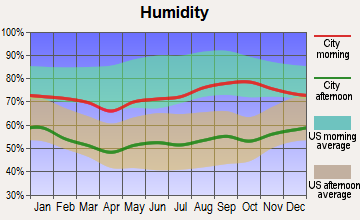
Humidity - Average morning or afternoon humidity
67.4%
75.8%
Humidity - Differences between morning and afternoon humidity
29.9%
27%
Humidity - Maximum monthly morning or afternoon humidity
77%
83%
Humidity - Minimum monthly morning or afternoon humidity
47.2%
56%
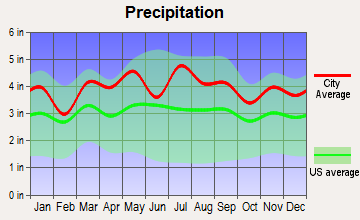
Precipitation - Yearly average
47.4 in
38.5 in
Snowfall - Yearly average
60 in
115.9 in
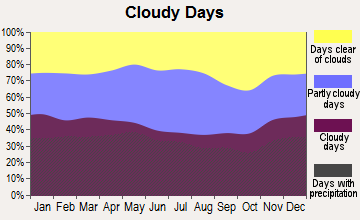
Clouds - Number of days clear of clouds
15.8%
11.2%
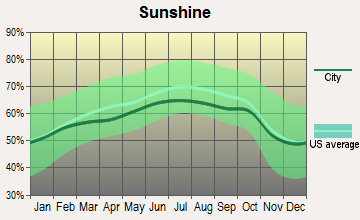
Sunshine amount - Average
60.2%
51.8%
Sunshine amount - Differences during a year
20%
44%
Sunshine amount - Maximum monthly
64%
66%
Sunshine amount - Minimum monthly
44%
22%
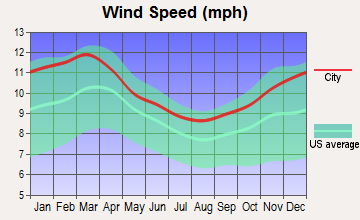
Wind speed - Average
10.5 mph
10.4 mph
Average climate in Staten Island, New York
Average climate in Cleveland, Ohio
Air pollution
Type
AQI
CO
NO2
OZONE
PB
PM10
PM25
SO2
Year
Staten Island
Cleveland
Staten Island
Cleveland
Staten Island
Cleveland
Staten Island
Cleveland
Staten Island
Staten Island
Cleveland
Staten Island
Cleveland
Staten Island
Cleveland
2018
94
85
0.35
0.26
17.1
11.3
24.1
26.9
N/A
N/A
N/A
22.7
7.9
9.3
0.4
0.6
2017
98
82
0.32
0.27
17.0
11.4
27.0
27.6
N/A
N/A
N/A
23.2
7.6
8.2
0.2
0.5
2016
94
81
0.37
0.27
17.9
11.1
28.5
27.1
N/A
N/A
N/A
23.4
7.7
9.9
0.2
1.0
2015
102
76
0.39
0.27
18.9
12.9
27.3
25.1
N/A
N/A
N/A
31.5
8.6
8.0
0.4
1.9
2014
97
83
0.38
0.25
19.2
12.3
25.6
23.7
N/A
N/A
N/A
28.4
8.3
10.6
0.7
1.7
2013
99
88
0.39
0.24
19.6
12.9
27.8
23.8
N/A
N/A
N/A
27.3
8.5
12.0
0.8
1.9
2012
102
119
0.42
0.28
19.3
13.7
26.9
26.5
N/A
N/A
N/A
32.0
9.2
15.2
1.4
2.5
2011
108
110
0.42
0.29
21.4
15.3
28.1
25.8
N/A
N/A
N/A
29.7
10.2
16.1
2.0
3.4
2010
114
113
0.40
0.35
19.9
15.8
28.7
27.0
N/A
N/A
N/A
24.2
9.4
18.7
1.8
3.6
2009
105
67
0.39
0.37
22.5
17.1
25.3
26.0
N/A
N/A
N/A
21.5
9.5
N/A
2.4
3.7
2008
111
87
0.39
0.29
23.0
15.2
24.3
32.9
0.013
N/A
N/A
27.1
11.3
N/A
3.4
4.2
2007
123
94
0.44
0.29
24.2
18.1
23.3
32.9
0.016
N/A
N/A
30.3
12.0
N/A
4.3
5.2
2006
117
75
0.55
0.25
25.6
16.2
24.7
27.7
0.018
N/A
N/A
27.3
13.1
N/A
5.3
5.0
2005
112
98
0.69
0.27
27.3
19.2
23.3
28.6
N/A
N/A
N/A
31.7
N/A
N/A
7.3
5.7
2004
109
77
0.68
0.47
26.4
19.5
22.2
20.1
0.030
N/A
N/A
29.2
N/A
N/A
6.9
3.8
2003
112
81
0.76
0.49
28.0
19.6
22.1
25.8
0.006
N/A
26.9
28.3
N/A
N/A
7.1
5.7
2002
125
95
0.74
0.40
30.6
19.8
24.7
28.6
0.008
N/A
26.1
32.5
N/A
N/A
6.6
5.1
2001
124
91
0.81
0.43
32.4
21.1
24.9
28.4
0.020
N/A
26.9
35.9
N/A
N/A
7.2
5.9
2000
116
79
0.93
0.48
33.0
20.5
23.1
25.2
0.022
N/A
22.2
35.9
N/A
N/A
7.2
5.8
Natural disasters
Type
Staten Island
Cleveland
Tornado activity compared to U.S. average
61.3%
93%
Earthquake activity compared to U.S. average
31.2%
50.2%
Natural disasters compared to U.S. average
19%
16%
Transportation
Staten Island's infrastructure offers public transportation options such as buses and ferries, including the renowned Staten Island Ferry. Cleveland provides buses, light rail services, and commuter rail systems for easy intra-city navigation.
Transport
Type
Staten Island
Cleveland
Amtrak stations
0
1
Amtrak stations nearby
3
1
FAA registered aircraft
39
307
FAA registered aircraft manufacturers and dealers
2
19
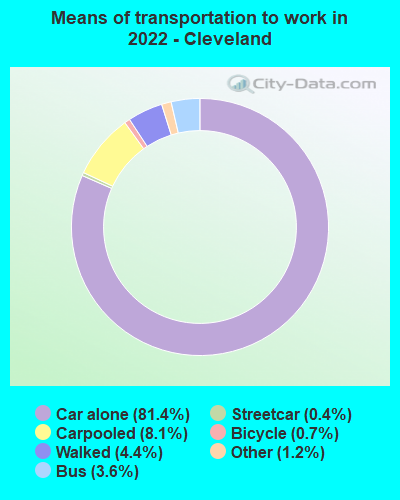
Means of transportation to work
Type
Staten Island
Cleveland
Bicycle
0.2%
0.2%
Bus
19.2%
3.5%
Carpooled
12.1%
7.7%
Car alone
54.3%
83.1%
Ferryboat
5.3%
0%
Railroad
0.9%
0.1%
Streetcar
0%
0.4%
Subway
2.6%
0%
Taxicab
0.4%
0.1%
Walked
2.9%
3.9%
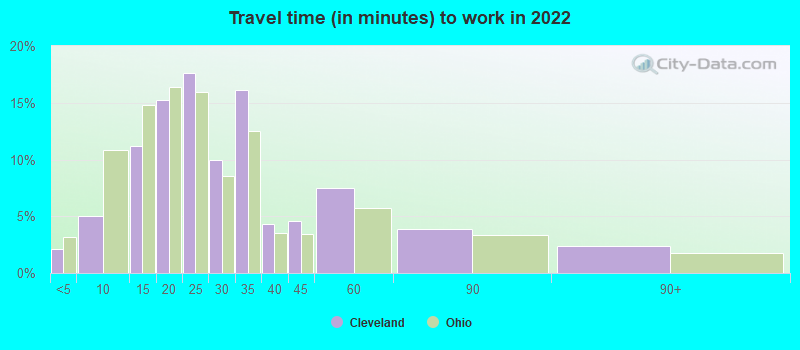
Average travel time to work
Type
Staten Island
Cleveland
Average
45.3 min
28.9 min
Real Estate
Staten Island's real estate market is significantly more expensive than Cleveland's. The median home cost in Cleveland is far lower than in Staten Island, making it potentially more attractive for homebuyers on a budget.
Neighborhoods
Neighborhoods in both cities are diverse. Staten Island flaunts a quieter, more suburban vibe, while Cleveland offers a mix of urban and residential districts. Research on neighborhoods is crucial for long-term living and short-term visiting.
Houses and residents
Type
Staten Island
Cleveland
Houses
163,993
202,735
Average household size (people)
2.8
2.3
Houses occupied
156,341 (95.3%)
171,321 (84.5%)
Houses occupied by owners
99,732 (63.8%)
67,039 (39.1%)
Houses occupied by renters
56,609 (36.2%)
104,282 (60.9%)
Median rent asked for vacant for-rent units
$1,320
$1,284
Median price asked for vacant for-sale houses and condos
$369,853
$86,306
Estimated median house or condo value
$605,500
$83,400
Median number of rooms in apartments
3.9
4.4
Median number of rooms in houses and condos
6.1
6.3
Renting percentage
35.9%
55.9%
Housing density (houses/condos per square mile)
2,804.3
2,613.2
Household income disparities
43.8%
48.5%
Housing units without a mortgage
19,289 (25%)
2,325 (6.3%)
Housing units with both a second mortgage and home equity loan
160 (0.2%)
2,348 (6.4%)
Housing units with a mortgage
57,986 (75%)
34,401 (93.7%)
Housing units with a home equity loan
5,623 (7.3%)
166 (0.5%)
Housing units with a second mortgage
4,499 (5.8%)
3,335 (9.1%)
Housing units lacking complete kitchen facilities
0.6%
8.8%
Housing units lacking complete plumbing facilities
Self-employed workers in own not incorporated business
7,611
7,246
State government workers
6,285
2,212
Unpaid family workers
394
328
Industries and Occupations
Staten Island's occupations lean towards the service, business, and tech sectors. In contrast, Cleveland is known for its medical, science, and manufacturing sectors. Specific job opportunities will depend on the individual's skill set and industry.
Healthcare in Cleveland, known for the world-renowned Cleveland Clinic, is among the best in the country. Staten Island, however, is not far behind with excellent health facilities and renowned hospitals.
In terms of infrastructure, Staten Island displays a more urban layout and features a significant amount of green space. Cleveland hosts numerous historical districts and industrial areas, with a focus on the gradual revitalizing of its urban center.
Infrastructure
Type
Staten Island
Cleveland
Hospitals
25
30
TV stations
30
16
Bank branches located here
104
116
Bank institutions located here
19
17
Main business address for public companies
1
31
Drinking water stations with no reported violations in the past
1
1
Drinking water stations with reported violations in the past
3
5
Schools
School facilities
Type
Staten Island
Cleveland
Private elementary/middle schools
22
26
Private high schools
13
10
Public elementary/middle schools
63
119
Public high schools
16
52
Colleges/Universities
5
13
Culture and Food
Both cities strike a rich cultural and culinary profile. Staten Island holds an array of global cuisines, while Cleveland offers a robust food scene, with a touch of Midwestern warmth.
Sports Teams
Both cities have passionate sporting cultures. Staten Island cheers for New York's sports teams, while Cleveland boasts teams like the Cleveland Browns(NFL), Indians(MLB), and Cavaliers(NBA).


 Staten Island, NY
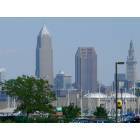
 Cleveland, OH