Relocating or visiting, it's wise to evaluate all aspects of potential destinations. Two such possibilities are Staten Island, NY and Paterson, NJ. This comparison, encompassing diverse aspects from crime rates to tax structures, food culture, health care and more, provides a comprehensive guide to help you decide. Understand the stark contrasts, whether it's the suburban charm of Staten Island against the bustling city life in Paterson or Staten Island's higher cost of living against Paterson's affordability. Read on for detailed insights.
Safety is crucial, and both Staten Island and Paterson have varied crime rates. Staten Island, being largely residential, generally records lower crime rates compared to Paterson. NeighborhoodScout data reveals that Staten Island is safer than 37% of US cities, while Paterson is safer than only 8% of US cities. For visitors and prospective residents, Staten Island’s reputation as NYC's safest borough adds confidence.
Cost of Living
Comparatively, the cost of living in Staten Island is significantly higher than in Paterson. Staten Island, part of New York City, is subject to its high housing costs and general living expenses. On the contrary, Paterson, as a smaller city in New Jersey, offers lower housing costs and overall affordability. Those contemplating relocation should consider financial burdens versus benefits.
Income Tax
Just like sales tax, the income tax rate is also higher in Staten Island. NYC imposes a city tax with rates varying from 3.078% to 3.876%, on top of a state income tax. Paterson, nestled in NJ, solely applies state income tax, with no additional city tax.
Property Tax
Even though Staten Island's property taxes are traditionally lower than the NYC average, they're still much higher compared to Paterson's. NJ does maintain some of the highest property tax rates in the US, but properties in Paterson are generally more affordable, keeping owners' overall tax commitment lower.
Sales Tax
Sales tax is higher in Staten Island due to NYC's 8.875% total rate, including both city and state taxes. Paterson, being in NJ, has a lower tax at 6.625%, more appealing to those wanting to save.
Income
Type
Staten Island
Paterson
Estimated median household income
$86,054
$46,451
Estimated per capita income
$38,678
$21,574
Cost of living index (U.S. average is 100)
164.1
120.7
If you make $50,000 in Paterson, you will have to make $67,978 in Staten Island to maintain the same standard of living.
Geographical Conditions
Geographically, Staten Island boasts a blend of beachfront areas, woodlands, and parks. Great Kills Park, the Staten Island Greenbelt, and the Island's eastern shore offer a perfect retreat for nature lovers. Meanwhile, Paterson's industrial feel is broken with the presence of the Great Falls National Historic Park, one of the nation's largest waterfalls.
Geographical information
Type
Staten Island
Paterson
Land area
58.5 sq. miles
8.4 sq. miles
Population density
8,225.7 people per sq. mile
18,691 people per sq. mile
Relative area comparison
Staten Island, NY Paterson, NJ
Education
When it comes to education, both Staten Island and Paterson offer funds for their public school systems. Staten Island, part of the New York City Department of Education, has over 60 public schools and a host of private institutions. Paterson public schools are underfunded but are benefitting from state intervention and significant progressive changes. Various higher education institutions are easily accessible from both locations.
Staten Island's economy is primarily driven by healthcare, retail, and education sectors. Meanwhile, Paterson has a diverse economy with manufacturing, retail trade, and healthcare for its primary employers. Both Staten Island and Paterson have been affected economically by the pandemic, but the former has shown a steady recovery rate, mostly due to it being part of NYC, an economic powerhouse.
Biggest Employers
Healthcare serves as the major employer for Staten Island, with Staten Island University Hospital and Richmond University Medical Center providing numerous job opportunities. In Paterson, St. Joseph's Health is the largest employer, along with the school district and city government. These sectors provide a variety of opportunities for prospective residents looking for employment.
In Staten Island (Richmond County), 50.8% voted for Democrats and 48.3% for Republicans in 2012 Presidential Election. In Paterson (Passaic County), 63.8% voted for Democrats and 35.5% for Republicans.
Elections
Type
Democrats
Republicans
Other
Year
Staten Island
Paterson
Staten Island
Paterson
Staten Island
Paterson
2020
42.2%
57.7%
57.1%
41.1%
0.7%
1.1%
2016
41.0%
59.7%
56.1%
37.3%
2.9%
3.0%
2012
50.8%
63.8%
48.3%
35.5%
0.9%
0.7%
2008
47.8%
60.6%
51.9%
38.8%
0.4%
0.5%
2004
42.8%
55.5%
56.5%
44.0%
0.7%
0.5%
2000
52.1%
57.8%
45.1%
39.1%
2.9%
3.1%
1996
50.5%
56.1%
40.8%
35.0%
8.7%
8.8%
Breakdown of population affiliated with a religious congregation
Type
Adherents
Congregations
Religion
Staten Island
Paterson
Staten Island
Paterson
CATHOLIC CHURCH
54.2%
39.8%
20.6%
15.8%
MUSLIM ESTIMATE
1.7%
5.6%
3.0%
4.2%
AMERICAN BAPTIST CHURCHES IN THE USA
0.6%
0.7%
1.0%
6.7%
EVANGELICAL LUTHERAN CHURCH IN AMERICA
0.6%
0.2%
4.0%
0.9%
COPTIC ORTHODOX CHURCH
0.5%
0.0%
1.0%
0.0%
EPISCOPAL CHURCH
0.4%
0.4%
5.0%
3.0%
REFORMED CHURCH IN AMERICA
0.1%
0.5%
2.5%
5.5%
SEVENTH DAY ADVENTIST CHURCH
0.1%
0.3%
2.5%
2.1%
CHRISTIAN REFORMED CHURCH NORTH AMERICA
0.0%
0.4%
0.5%
3.0%
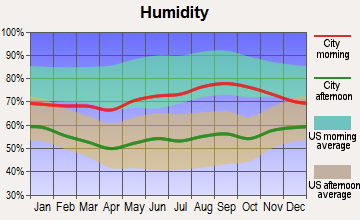
Weather
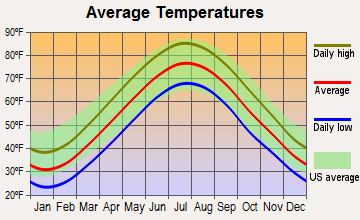
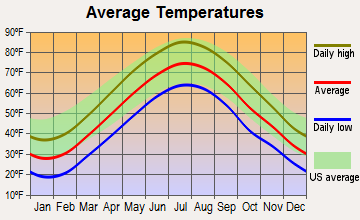
As Eastern U.S neighbors, Staten Island and Paterson share similar weather patterns. They experience a humid subtropical climate, with warm, humid summers and cold winters. Average summer temperatures land in the mid-80s, while winter can drop to around 20 degrees. Staten Island's proximity to water can make it a bit cooler during summer but also subject to heavier snowfall in winter. Tourists should pack accordingly, especially when travelling in winter.
Weather and climate
Type
Staten Island
Paterson
Temperature - Average
54.1°F
51.7°F
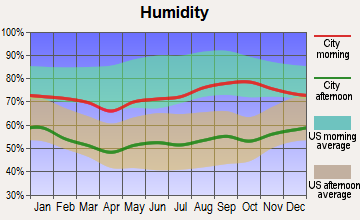
Humidity - Average morning or afternoon humidity
67.4%
67.3%
Humidity - Differences between morning and afternoon humidity
29.9%
28.8%
Humidity - Maximum monthly morning or afternoon humidity
77%
76.5%
Humidity - Minimum monthly morning or afternoon humidity
47.2%
47.7%
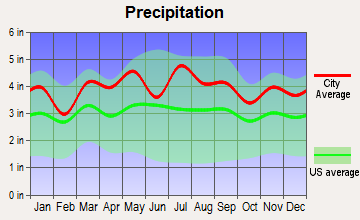
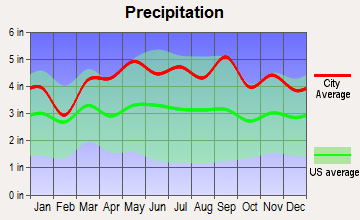
Precipitation - Yearly average
47.4 in
51.4 in
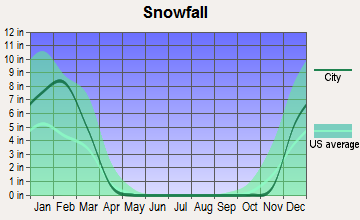
Snowfall - Yearly average
60 in
57.2 in
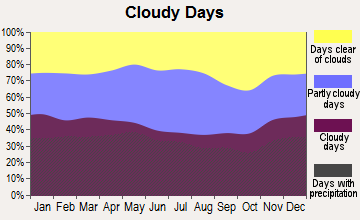
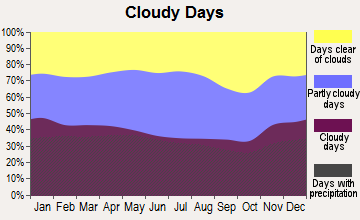
Clouds - Number of days clear of clouds
15.8%
16.9%
Sunshine amount - Average
60.2%
60.2%
Sunshine amount - Differences during a year
20%
20%
Sunshine amount - Maximum monthly
64%
64%
Sunshine amount - Minimum monthly
44%
44%
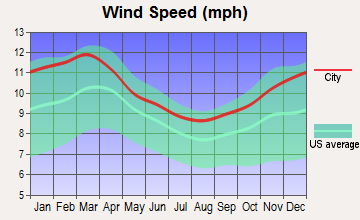
Wind speed - Average
10.5 mph
8.9 mph
Average climate in Staten Island, New York
Average climate in Paterson, New Jersey
Air pollution
Type
AQI
CO
NO2
OZONE
PB
PM10
PM25
SO2
Year
Staten Island
Paterson
Staten Island
Paterson
Staten Island
Paterson
Staten Island
Paterson
Staten Island
Paterson
Staten Island
Paterson
Staten Island
Paterson
Staten Island
Paterson
2018
94
100
0.35
0.31
17.1
16.8
24.1
24.9
N/A
N/A
N/A
N/A
7.9
7.9
0.4
0.4
2017
98
97
0.32
0.23
17.0
17.0
27.0
25.3
N/A
N/A
N/A
N/A
7.6
7.7
0.2
0.3
2016
94
95
0.37
0.30
17.9
17.7
28.5
25.4
N/A
N/A
N/A
N/A
7.7
7.9
0.2
0.5
2015
102
102
0.39
0.34
18.9
18.5
27.3
24.8
N/A
N/A
N/A
N/A
8.6
8.8
0.4
0.8
2014
97
96
0.38
0.37
19.2
19.1
25.6
24.1
N/A
N/A
N/A
N/A
8.3
8.2
0.7
1.0
2013
99
98
0.39
0.41
19.6
19.1
27.8
24.6
N/A
N/A
N/A
N/A
8.5
8.8
0.8
1.1
2012
102
100
0.42
0.44
19.3
18.7
26.9
25.0
N/A
N/A
N/A
N/A
9.2
9.1
1.4
1.6
2011
108
108
0.42
0.45
21.4
21.1
28.1
24.2
N/A
N/A
N/A
N/A
10.2
10.5
2.0
2.5
2010
114
112
0.40
0.40
19.9
18.4
28.7
25.6
N/A
N/A
N/A
N/A
9.4
10.1
1.8
1.6
2009
105
104
0.39
0.40
22.5
20.8
25.3
20.9
N/A
N/A
N/A
N/A
9.5
10.4
2.4
2.3
2008
111
110
0.39
0.44
23.0
21.8
24.3
21.8
0.013
0.013
N/A
N/A
11.3
12.1
3.4
3.1
2007
123
121
0.44
0.49
24.2
23.9
23.3
22.1
0.016
0.016
N/A
N/A
12.0
12.9
4.3
4.2
2006
117
116
0.55
0.56
25.6
21.8
24.7
21.8
0.018
0.018
N/A
N/A
13.1
13.1
5.3
4.8
2005
112
112
0.69
0.67
27.3
24.5
23.3
21.1
N/A
N/A
N/A
N/A
N/A
N/A
7.3
6.3
2004
109
108
0.68
0.66
26.4
23.3
22.2
20.1
0.030
0.030
N/A
N/A
N/A
N/A
6.9
6.2
2003
112
107
0.76
0.73
28.0
24.4
22.1
20.3
0.006
0.017
26.9
26.9
N/A
N/A
7.1
6.3
2002
125
122
0.74
0.71
30.6
24.9
24.7
22.0
0.008
0.008
26.1
25.8
N/A
N/A
6.6
5.7
2001
124
123
0.81
0.76
32.4
28.5
24.9
22.4
0.020
0.020
26.9
24.9
N/A
N/A
7.2
6.7
2000
116
115
0.93
0.81
33.0
30.5
23.1
19.7
0.022
0.022
22.2
22.2
N/A
N/A
7.2
6.5
Natural disasters
Type
Staten Island
Paterson
Tornado activity compared to U.S. average
61.3%
64.9%
Earthquake activity compared to U.S. average
31.2%
31.9%
Natural disasters compared to U.S. average
19%
27%
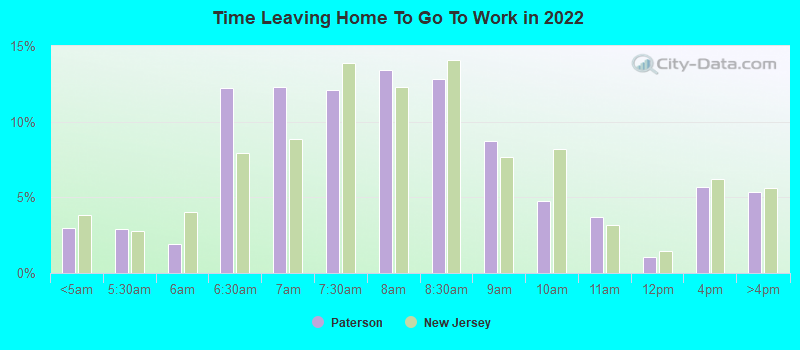
Transportation
Public transit is more readily available and efficient in Staten Island due to its integration with NYC's robust transit system, including the Staten Island Ferry. Paterson, while served by NJ Transit buses and trains, has room for improvement regarding transit frequency and reliability. Commuting times can be lengthier compared to Staten Island.
Transport
Type
Staten Island
Paterson
Amtrak stations nearby
3
3
FAA registered aircraft
39
6
FAA registered aircraft manufacturers and dealers
2
0
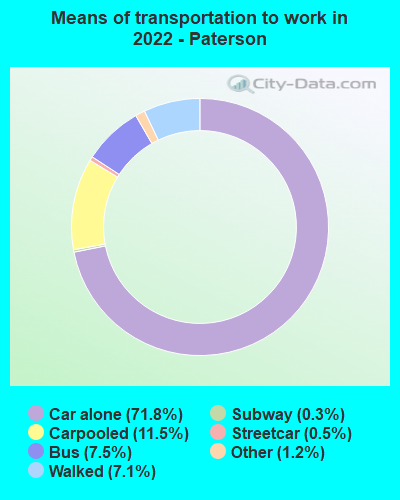
Means of transportation to work
Type
Staten Island
Paterson
Bicycle
0.2%
0.4%
Bus
19.2%
4.3%
Carpooled
12.1%
14.1%
Car alone
54.3%
71.2%
Ferryboat
5.3%
0%
Railroad
0.9%
0.4%
Streetcar
0%
1%
Subway
2.6%
0.1%
Taxicab
0.4%
0.3%
Walked
2.9%
6.7%
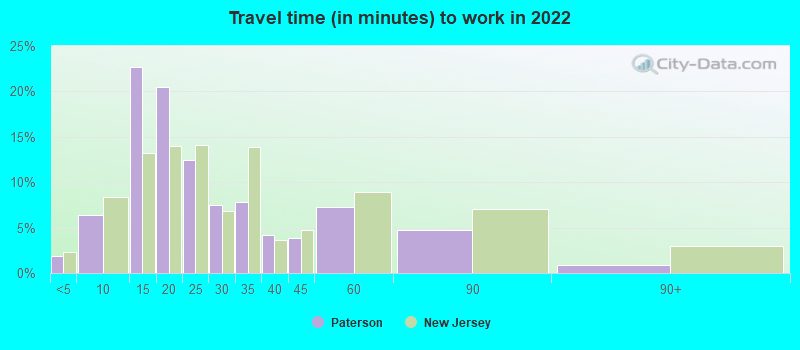
Average travel time to work
Type
Staten Island
Paterson
Average
45.3 min
23.8 min
Real Estate
When it comes to real estate, Staten Island, as part of NYC, has consistently higher prices. Paterson's housing market is relatively affordable, with lower rents and home purchase prices. Rental and housing trends also vary based on neighborhood differences, with certain Staten Island neighborhoods reaching Manhattan price levels, while some Paterson neighborhoods offer incredibly affordable options.
Neighborhoods
Staten Island neighborhoods range from urban to suburban, with many offering scenic waterfront views. Its North Shore is more urban, diverse, and vibrant, while the South Shore is predominantly suburban. Paterson offers a startlingly contrasting ambiance. Its neighborhoods are usually busier and bustling, reflecting the city's rich immigration history and diversity- a tapestry of different cultures and communities.
Houses and residents
Type
Staten Island
Paterson
Houses
163,993
54,231
Average household size (people)
2.8
3.2
Houses occupied
156,341 (95.3%)
51,612 (95.2%)
Houses occupied by owners
99,732 (63.8%)
12,739 (24.7%)
Houses occupied by renters
56,609 (36.2%)
38,873 (75.3%)
Median rent asked for vacant for-rent units
$1,320
$698.12
Median price asked for vacant for-sale houses and condos
$369,853
$364,794
Estimated median house or condo value
$605,500
$311,700
Median number of rooms in apartments
3.9
4.1
Median number of rooms in houses and condos
6.1
5.7
Renting percentage
35.9%
70.4%
Housing density (houses/condos per square mile)
2,804.3
6,423.7
Household income disparities
43.8%
48%
Housing units without a mortgage
19,289 (25%)
139 (1.6%)
Housing units with both a second mortgage and home equity loan
160 (0.2%)
231 (2.6%)
Housing units with a mortgage
57,986 (75%)
8,710 (98.4%)
Housing units with a home equity loan
5,623 (7.3%)
64 (0.7%)
Housing units with a second mortgage
4,499 (5.8%)
410 (4.6%)
Housing units lacking complete kitchen facilities
0.6%
4.1%
Housing units lacking complete plumbing facilities
Self-employed workers in own not incorporated business
7,611
3,938
State government workers
6,285
1,755
Unpaid family workers
394
87
Industries and Occupations
Staten Island's top industries include healthcare and social assistance, retail trade, and educational services. On the flip side, Paterson's industries are manufacturing-oriented, and then service and healthcare sectors. In terms of occupations, most Staten Island residents work in office and administrative support, sales, and education, while Paterson residents engage mainly in production, transportation, and material moving occupations.
Healthcare forms a significant part of both Staten Island and Paterson's economy. Staten Island is well served by two significant hospital systems, while Paterson residents often rely on St. Joseph's Health. While Staten Island boasts better healthcare facilities, Paterson's healthcare system, though not as robust, is sufficient for its size.
In terms of infrastructure, Staten Island is well developed, complete with an extensive ferry system, bridges, and roadways connecting with the rest of NYC. Paterson, on the other hand, has had longstanding infrastructure problems like poverty and overcrowded housing. Efforts are underway to address these issues, but progress is steady rather than speedy, impacting both residents and visitors.
Infrastructure
Type
Staten Island
Paterson
Hospitals
25
2
TV stations
30
30
Bank branches located here
104
20
Bank institutions located here
19
8
Schools
School facilities
Type
Staten Island
Paterson
Private elementary/middle schools
22
6
Private high schools
13
2
Public elementary/middle schools
63
37
Public high schools
16
14
Colleges/Universities
5
2
Culture and Food
Culturally vibrant, both cities are melting pots reflecting rich diversity in their food offerings. Staten Island's Italian influence shines through its cuisine, while Paterson, known as "Silk City," boasts a variety of eateries offering Middle Eastern, Dominican, Peruvian, and other ethnic cuisines, reflecting its diverse inhabitant mix. For food lovers, both cities provide a culinary journey around the world.
Sports Teams
Sports are big in both Staten Island and Paterson. Staten Island hosts the Staten Island Yankees, a minor league baseball team, and has vast recreational sports facilities. Paterson doesn't host any major league team, but it's relatively easier for its inhabitants to go see NY's big league teams play, due to its proximity.


 Staten Island, NY
 Paterson, NJ