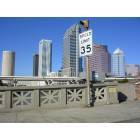
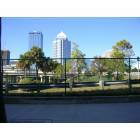
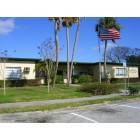
When comparing Tampa, FL and Riverview, FL, you're essentially looking at two ends of the spectrum, with Tampa being a vibrant city environment and Riverview offering a more relaxed, suburban lifestyle. While Tampa teems with diverse cultures, bustling economies and thriving sports and nightlife, Riverview provides a quieter, family-oriented environment. The cost of living varies between the two, with Tampa being somewhat higher. Similarly, crime rates differ, with Riverview generally being safer. Both places have unique charms, be it for relocation or tourism purposes.
Distance between
Tampa, FL and
Riverview, FL : 11.1 miles
Tampa's population is larger by 238%. Its population has grown by 83,603 people (27.6%) since 2000. The population of Riverview has grown by 102,525 people (851.9%) during that time.
Comparatively, Riverview is thought to be safer than Tampa. The bigger city life in Tampa brings with it a higher overall crime rate. That said, certain neighborhoods in Tampa have lower crime rates and each city has areas that are safer than others. Both cities have police departments that are active in community engagement. For anyone considering moving or visiting, it's worth checking up-to-date crime statistics and trends.
Cost of Living
The cost of living in Tampa tends to be higher than Riverview. Housing costs, food, entertainment, and the general price of goods and services are typically higher in Tampa. Riverview’s cost of living is lower than the national average, making it an attractive place for young families or retirees on a budget.
Income Tax
Florida does not have a state income tax, so this is equal for residents of both Tampa and Riverview.
Property Tax
Property tax varies in Florida by county rather than by city. Both Tampa and Riverview will have the same property tax rate as they're both located in Hillsborough County.
Sales Tax
Both Tampa and Riverview have the same sales tax rate at 8.5%, due to being in the same county – Hillsborough County.
Income
Type
Tampa
Riverview
Estimated median household income
$63,404
$81,195
Estimated per capita income
$43,517
$33,926
Cost of living index (U.S. average is 100)
99.8
98.5
If you make $50,000 in Riverview, you will have to make $50,660 in Tampa to maintain the same standard of living.
Geographical Conditions
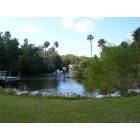
Geographically, both Tampa and Riverview offer a flat landscape typical to Florida. Both cities are relatively close to the beach and nearby nature preserves and rivers offer plenty of outdoor activities. Tampa’s waterfront downtown area is a notable highlight.
Both Tampa and Riverview have access to quality schools. Tampa has a larger selection, boasting various public, private, and charter schools, alongside higher education institutions like the University of Tampa and University of South Florida (USF). Riverview schools have a solid reputation, but the city doesn't have its own university.
Tampa's economy is diversified and strong, offering opportunities in sectors like finance, healthcare, tourism, and real estate. Riverview has a healthier employment scenario compared to other US cities and the primary industries include retail trade, health care, and education. However, many residents commute to Tampa for work.
Biggest Employers
Major employers in Tampa include BayCare Health System, Publix Super Markets, and University of South Florida. In Riverview, the public school system is one of the largest employers, but many residents commute to nearby cities, including Tampa, for employment.
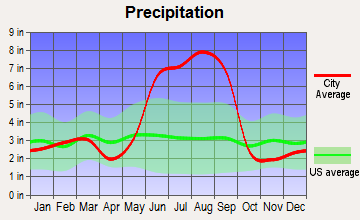
Weather in both Tampa and Riverview is typically Floridian. Both cities experience warm weather year-round, with occasional high humidity. Average temperatures range from 50-90°F throughout the year in both locations. Tampa may get a bit more rainfall due to its location near the Gulf of Mexico. Both cities are also susceptible to hurricanes and tropical storms during hurricane season (June-November).
Weather and climate
Type
Tampa
Riverview
Temperature - Average
73.1°F
72.5°F
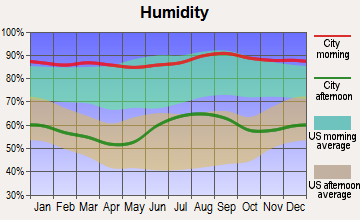
Humidity - Average morning or afternoon humidity
77.6%
77.6%
Humidity - Differences between morning and afternoon humidity
38%
38%
Humidity - Maximum monthly morning or afternoon humidity
89%
89%
Humidity - Minimum monthly morning or afternoon humidity
51%
51%
Precipitation - Yearly average
45.6 in
49 in
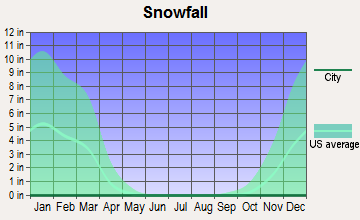
Snowfall - Yearly average
0 in
0 in
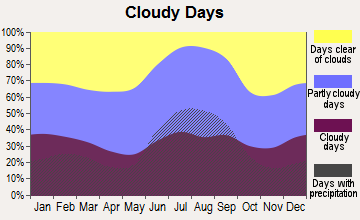
Clouds - Number of days clear of clouds
16.9%
16.9%
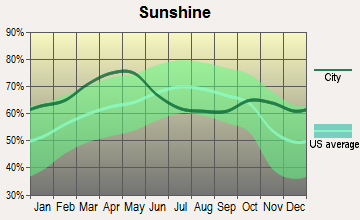
Sunshine amount - Average
74.8%
74.8%
Sunshine amount - Differences during a year
18%
18%
Sunshine amount - Maximum monthly
80%
80%
Sunshine amount - Minimum monthly
62%
62%
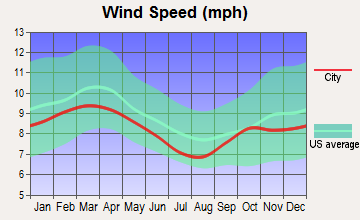
Wind speed - Average
7.4 mph
7.4 mph
Average climate in Tampa, Florida
Average climate in Riverview, Florida
Air pollution
Type
AQI
CO
NO2
OZONE
PB
PM10
PM25
SO2
Year
Tampa
Riverview
Tampa
Riverview
Tampa
Riverview
Tampa
Riverview
Tampa
Riverview
Tampa
Riverview
Tampa
Riverview
Tampa
Riverview
2018
68
65
0.16
0.16
N/A
N/A
27.7
26.9
N/A
N/A
18.9
18.4
7.9
7.3
1.1
0.6
2017
79
70
0.17
0.17
N/A
N/A
28.4
27.4
N/A
N/A
20.5
19.7
8.8
9.0
0.6
0.5
2016
71
71
0.17
0.17
N/A
N/A
30.8
29.3
N/A
N/A
20.2
19.5
7.9
8.2
0.8
0.6
2015
74
74
0.15
0.15
N/A
N/A
28.7
27.4
N/A
N/A
19.0
18.4
10.0
9.7
2.2
1.2
2014
74
73
0.16
0.16
N/A
N/A
28.0
27.0
N/A
N/A
20.0
19.3
8.4
9.3
1.6
0.9
2013
68
67
0.16
0.16
N/A
N/A
27.7
27.5
N/A
N/A
20.3
19.5
9.3
9.1
1.4
1.1
2012
85
83
0.17
0.17
N/A
N/A
28.0
27.6
N/A
N/A
21.0
20.3
9.7
9.6
1.0
0.9
2011
83
84
0.18
0.18
N/A
N/A
29.2
28.8
N/A
N/A
20.8
19.6
10.1
10.0
1.2
1.2
2010
84
83
0.25
0.25
N/A
N/A
29.8
29.3
N/A
N/A
21.8
20.2
9.9
9.9
1.3
1.0
2009
77
77
0.27
0.27
N/A
N/A
27.4
27.5
N/A
N/A
21.2
20.1
10.1
9.6
1.5
1.0
2008
86
83
0.18
0.18
4.0
4.0
27.5
26.9
N/A
N/A
23.3
21.5
10.2
10.0
2.4
1.6
2007
102
100
0.31
0.20
5.4
5.4
28.8
28.3
N/A
N/A
26.0
24.3
12.0
11.6
3.3
2.0
2006
99
98
0.42
N/A
6.9
6.9
29.5
28.6
N/A
N/A
25.8
24.5
11.6
11.6
3.0
2.6
2005
99
99
0.45
N/A
6.7
6.7
27.9
27.5
N/A
N/A
25.0
23.4
13.2
12.5
3.0
2.7
2004
92
90
0.40
N/A
7.2
7.2
26.5
26.5
0.004
N/A
25.0
23.7
12.5
12.5
3.2
3.1
2003
94
89
0.42
N/A
N/A
N/A
23.8
23.4
0.004
0.004
23.9
22.8
11.7
11.7
4.4
4.0
2002
84
81
0.38
N/A
N/A
N/A
24.5
24.3
0.006
0.006
24.2
22.8
11.5
N/A
4.9
4.6
2001
100
104
0.44
N/A
N/A
N/A
26.2
25.5
0.012
0.015
24.9
24.1
12.1
N/A
4.7
4.5
2000
98
103
0.48
N/A
N/A
N/A
29.3
28.7
0.020
0.020
26.3
26.0
N/A
N/A
5.1
4.7
Natural disasters
Type
Tampa
Riverview
Tornado activity compared to U.S. average
152.6%
158%
Earthquake activity compared to U.S. average
11.1%
10.6%
Natural disasters compared to U.S. average
25%
25%
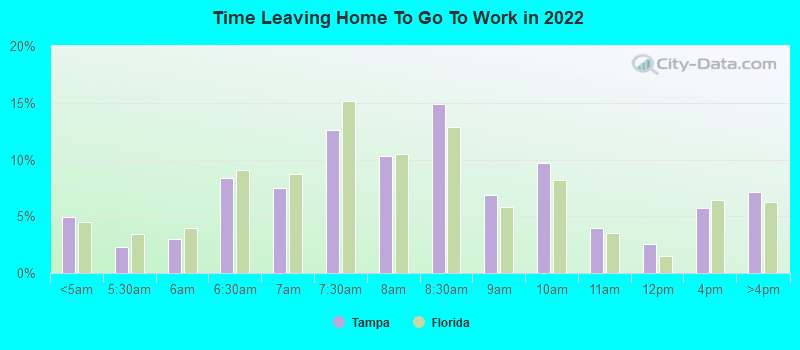
Transportation
Tampa offers more public transportation options, including buses, trolleys, and a downtown streetcar system. Commuting can be challenging during peak hours. Riverview residents primarily rely on private vehicles due to less public transit. However, the commute to Tampa is straightforward via the Expressway.
Transport
Type
Tampa
Riverview
Amtrak stations
1
0
Amtrak stations nearby
3
1
FAA registered aircraft
541
37
FAA registered aircraft manufacturers and dealers
78
0
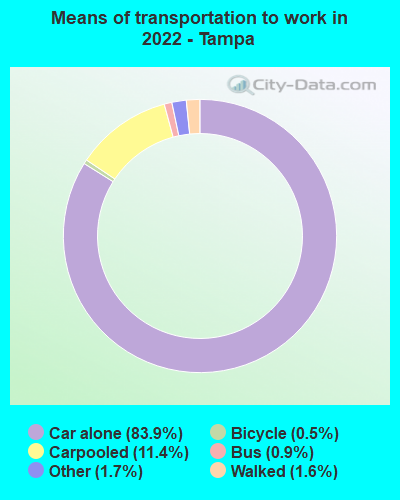
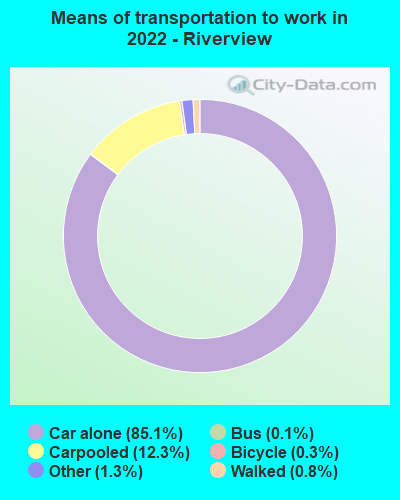
Means of transportation to work
Type
Tampa
Riverview
Bicycle
0.4%
0.3%
Bus
1.1%
0.2%
Carpooled
8.5%
13%
Car alone
87%
84.7%
Motorcycle
0.2%
0.2%
Railroad
0.2%
0%
Taxicab
0.1%
0%
Walked
1.3%
0.4%
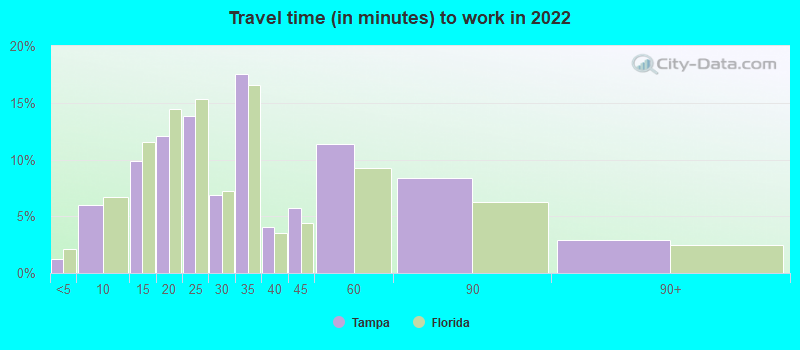
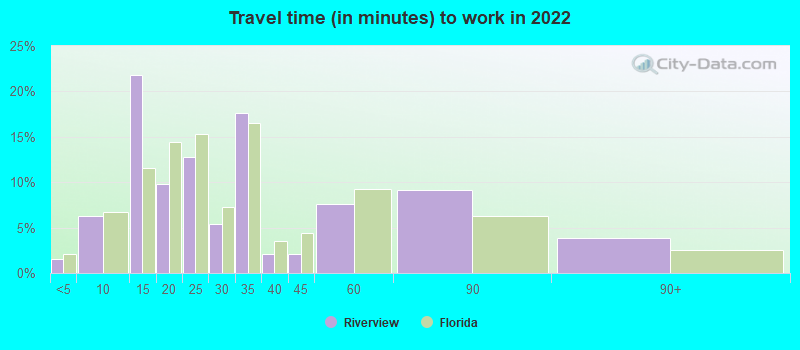
Average travel time to work
Type
Tampa
Riverview
Average
31.4 min
22.3 min
Other means
23.2 min
26.6 min
Public transportation
45.3 min
37 min
Private vehicle occupancy
Type
Tampa
Riverview
Average
1.1
1.2
Drove alone
90.8%
90.3%
In 2 person carpool
6.1%
5.3%
In 3 person carpool
1.7%
2.8%
In 4 person carpool
0.8%
0.9%
In 5-6 person carpool
0.4%
0.7%
In 7+ person carpool
0.1%
0.1%
How many people usually rode to work in the car, truck or van.
Real Estate
Real estate in Tampa is more expensive than Riverview. With a diverse range of properties, Tampa caters to varying budgets. Riverview's real estate market offers a more suburban feel, with plenty of single-family homes available at lower prices than in Tampa.
Neighborhoods
Tampa has a multitude of diverse neighborhoods, from the historic Ybor City to the upscale Hyde Park. Riverview, being smaller and more suburban, tends to have quieter, family-friendly neighborhoods like Boyette and Panther Trace.
Houses and residents
Type
Tampa
Riverview
Houses
172,886
42,959
Average household size (people)
2.4
2.9
Median year apartment built
1988
2007
Median year house/condo built
1977
2008
Length of stay in the house since moving in
12.5 years
7.9 years
Houses occupied
159,925 (92.5%)
40,114 (93.4%)
Houses occupied by owners
84,660 (52.9%)
28,742 (71.7%)
Houses occupied by renters
75,265 (47.1%)
11,372 (28.3%)
Median rent asked for vacant for-rent units
$1,369
$2,946
Median monthly housing costs
$1,326
$1,560
Median price asked for vacant for-sale houses and condos
$380,334
$194,169
Estimated median house or condo value
$336,200
$291,900
Median numbers of rooms
4.9
6.2
Median number of rooms in apartments
3.9
5.7
Median number of rooms in houses and condos
6
6.5
Median house price - detached houses
$477,728
$307,261
Median house price - in 2-unit structures
$191,392
$172,209
Median house price - in 3-to-4-unit structures
$249,678
$137,725
Median house price - in 5 or more unit structures
$443,026
$259,110
Median house price - mobile homes
$95,765
$90,411
Median house price - Townhouses or other attached units
$499,254
$232,217
Median house price - All housing units
$470,393
$277,180
Median house age
38
13
Renting percentage
48.3%
21.7%
Housing density (houses/condos per square mile)
1,542.7
4,697.9
House value disparities
34.7%
25.3%
Household income disparities
48.9%
36.3%
Median household income for houses/condes with a mortgage
$107,575
$97,699
Median household income for apartments without a mortgage
$66,260
$64,029
Housing units without a mortgage
1,024 (1.9%)
139 (0.6%)
Housing units with both a second mortgage and home equity loan
4,974 (9.2%)
778 (3.4%)
Housing units with a mortgage
53,063 (98.1%)
22,478 (99.4%)
Housing units with a home equity loan
110 (0.2%)
0 (0%)
Housing units with a second mortgage
5,716 (10.6%)
778 (3.4%)
House/condo owner moved in on average (years ago)
8
4
House/condo renter moved in on average (years ago)
1
1
Housing units lacking complete kitchen facilities
1.2%
0.1%
Housing units in structures
Housing units in structures
Tampa
Riverview
One, detached
54.3%
71.6%
One, attached
7.1%
8.8%
Two
2.0%
0.9%
3 or 4
4.5%
0.0%
5 to 9
4.8%
1.1%
10 to 19
5.5%
5.7%
20 to 49
5.5%
1.2%
50 or more
15.1%
1.4%
Mobile homes
1.0%
9.4%
Median real estate property taxes paid for housing units
Self-employed workers in own not incorporated business
10,160
2,850
State government workers
6,101
699
Unpaid family workers
602
0
Industries and Occupations
Top occupations in Tampa include management, sales, and healthcare while Riverview has a significant number of residents employed in administrative and sales roles. Major industries in Tampa include healthcare, trading, and education whereas in Riverview, it’s retail trade, health care, and social assistance.
Health diagnosing and treating practitioners and other technical occupations
8.7%
5.2%
Educational instruction, and library occupations
7.0%
9.2%
Food preparation and serving related occupations
6.3%
3.3%
Personal care and service occupations
3.6%
4.4%
Computer and mathematical occupations
3.4%
2.9%
Building and grounds cleaning and maintenance occupations
3.2%
0.0%
Legal occupations
3.0%
2.1%
Production occupations
2.9%
3.2%
Healthcare support occupations
2.7%
6.6%
Health technologists and technicians
2.4%
3.8%
Material moving occupations
2.4%
5.6%
Community and social service occupations
2.3%
1.8%
Arts, design, entertainment, sports, and media occupations
1.5%
0.6%
Transportation occupations
1.2%
0.4%
Life, physical, and social science occupations
1.0%
0.0%
Firefighting and prevention, and other protective service workers including supervisors
0.5%
1.0%
Health Care
Tampa has multiple healthcare facilities, including Tampa General Hospital, one of the top hospitals in the state. Riverview has Brandon Regional Hospital, and nearby Tampa's medical facilities are also accessible, providing a comprehensive range of services.
Tampa’s infrastructure is more developed due to its long-standing positioning as a significant city. It offers an International airport, multiple hospitals, and vibrant downtown. Riverview’s infrastructure is suited for a smaller population and carries a more suburban feel with sprawling residential areas and emerging commercial zones.
Infrastructure
Type
Tampa
Riverview
TV stations
26
26
Bank branches located here
205
14
Bank institutions located here
45
9
Drinking water stations with no reported violations in the past
58
2
Drinking water stations with reported violations in the past
HMDA - Conventional home purchase loans - Applications denied
Year
Tampa
Riverview
1999
1,627
66
2000
1,292
0
2001
1,001
0
2002
968
0
2003
1,390
108
2004
2,093
102
2005
3,515
201
2006
4,460
205
2007
2,950
111
2008
1,075
47
2009
415
27
Culture and Food
Tampa’s food and cultural scene is rich and diverse, offering everything from top-rated restaurants to cultural festivals. Ybor City’s Cuban influence stands out. Riverview offers a quieter cultural scene and familiar chain restaurants, with local gems scattered throughout the area.
Sports Teams
As a bigger city, Tampa hosts major sports teams - Tampa Bay Buccaneers (NFL), Tampa Bay Lightning (NHL), and Tampa Bay Rays (MLB). Riverview doesn’t have its own professional sports teams but has easy access to Tampa’s sports scene.

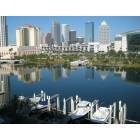

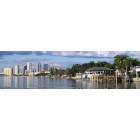
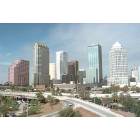

 Tampa, FL
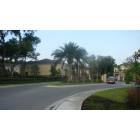
 Riverview, FL