Tucson, Arizona and Deer Valley, Arizona are two distinctly unique areas with their own set of advantages. Tucson is a larger, more populous city with significant cultural and educational opportunities. On the other hand, Deer Valley, a neighborhood of Phoenix, has a cozy, suburban feel, providing a more relaxed lifestyle but fewer amenities. It's important to understand the difference in cost of living, climate, crime rates, education, work opportunities, infrastructure, and more before deciding where to live.
Tucson has a higher than average crime rate compared to some other cities in the U.S. However, the nature of crime rates can vary greatly by neighborhood so it's important to research specific areas. Deer Valley tends to have lower crime rates, more characteristic of suburban communities. For visitors, both areas offer safe tourism, although everyone should practice common safety measures regardless of the location.
Cost of Living
The cost of living in Tucson is generally lower than Deer Valley. Housing costs in Tucson are considerably below the national average, while those in Deer Valley are higher, due to its close proximity to Phoenix. The overall cost of goods and services in both areas is near or just below the national average.
Income Tax
Both Tucson and Deer Valley are located in Arizona, which has a sliding scale for state income tax, ranging from 2.59% to 4.5%.
Property Tax
Both Tucson and Deer Valley have lower property taxes compared to the national average, with Tucson typically having slightly higher rates than Deer Valley.
Sales Tax
Tucson has a relatively high combined city and state sales tax rate, currently standing at 8.7%. Deer Valley, as part of Phoenix, shares a combined sales tax rate of 8.6%.
Income
Type
Tucson
Deer Valley
Estimated median household income
$50,306
$115,120
Estimated per capita income
$27,821
$52,163
Cost of living index (U.S. average is 100)
90.1
110.7
If you make $50,000 in Tucson, you will have to make $61,432 in Deer Valley to maintain the same standard of living.
Geographical Conditions
Tucson is located in the Sonoran Desert, surrounded by mountain ranges. Deer Valley is located in the northwest part of the Valley of the Sun, with less rugged terrain compared to Tucson.
Geographical information
Type
Tucson
Deer Valley
Land area
194.7 sq. miles
408.6 sq. miles
Population density
2,790.5 people per sq. mile
455.3 people per sq. mile
Elevation
2,491 feet
1,375 feet
Relative area comparison
Tucson, AZ Deer Valley, AZ
Education
Tucson has a strong educational infrastructure, being home to the University of Arizona. In terms of primary and secondary education, Tucson also offers a wide range of public, private, and charter schools. Deer Valley offers good educational opportunities as well, including high-ranking Deer Valley Unified School District and several charter and private schools.
Both areas have diverse economies. Tucson's economy is driven by education, healthcare, and government sectors. Deer Valley, as part of Phoenix, benefits from a robust economy that supports a range of industries, from technology to real estate. Unemployment rates in both areas are similar to the national average.
Biggest Employers
In Tucson, the University of Arizona, Raytheon Missile Systems, and Banner Health are the largest employers. In Deer Valley, the largest employers include Deer Valley Unified School District and several large retail stores.
In Tucson (Pima County), 52.7% voted for Democrats and 45.7% for Republicans in 2012 Presidential Election. In Deer Valley (Maricopa County), 43.6% voted for Democrats and 54.3% for Republicans.
Elections
Type
Democrats
Republicans
Other
Year
Tucson
Deer Valley
Tucson
Deer Valley
Tucson
Deer Valley
2020
58.4%
50.2%
39.8%
48.0%
1.7%
1.8%
2016
53.3%
44.9%
39.7%
47.7%
7.0%
7.5%
2012
52.7%
43.6%
45.7%
54.3%
1.6%
2.1%
2008
52.4%
44.0%
46.3%
54.5%
1.4%
1.5%
2004
52.7%
42.4%
46.7%
57.0%
0.6%
0.6%
2000
51.4%
43.0%
43.3%
53.4%
5.3%
3.6%
1996
52.2%
44.5%
39.4%
47.2%
8.5%
8.2%
Breakdown of population affiliated with a religious congregation
Type
Adherents
Congregations
Religion
Tucson
Deer Valley
Tucson
Deer Valley
CATHOLIC CHURCH
20.8%
13.6%
7.9%
4.3%
SOUTHERN BAPTIST CONVENTION
2.3%
1.9%
10.4%
6.5%
EVANGELICAL LUTHERAN CHURCH IN AMERICA
0.9%
0.8%
2.5%
2.0%
EPISCOPAL CHURCH
0.8%
0.3%
1.4%
1.3%
LUTHERAN CHURCH
0.4%
0.5%
1.4%
1.5%
SEVENTH DAY ADVENTIST CHURCH
0.3%
0.4%
1.9%
2.0%
VINEYARD USA
0.0%
0.3%
0.5%
0.6%
Weather
Tucson and Deer Valley both offer the traditional hot desert climate of Arizona. However, Tucson tends to be hotter in the summer with temperatures exceeding 100 degrees, while winters can get slightly cooler. Deer Valley commonly experiences less extreme hot and cold temperatures thanks to its metropolitan location included in greater Phoenix area.
Weather and climate
Type
Tucson
Deer Valley
Temperature - Average
70°F
70.7°F
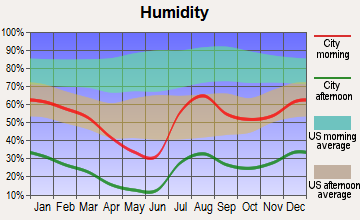
Humidity - Average morning or afternoon humidity
38.6%
37.5%
Humidity - Differences between morning and afternoon humidity
46%
48%
Humidity - Maximum monthly morning or afternoon humidity
58%
60%
Humidity - Minimum monthly morning or afternoon humidity
12%
12%
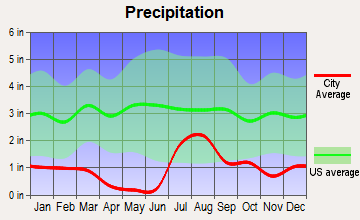
Precipitation - Yearly average
12 in
10.8 in
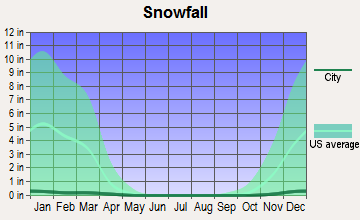
Snowfall - Yearly average
2 in
0 in
Clouds - Number of days clear of clouds
32.3%
35.2%
Sunshine amount - Average
92.8%
92.8%
Sunshine amount - Differences during a year
15%
16%
Sunshine amount - Maximum monthly
94%
95%
Sunshine amount - Minimum monthly
79%
79%
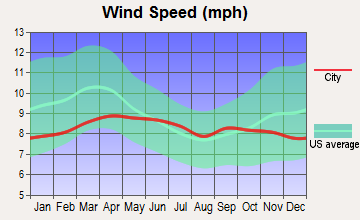
Wind speed - Average
8.3 mph
6.6 mph
Average climate in Tucson, Arizona
Average climate in Deer Valley, Arizona
Air pollution
Type
AQI
CO
NO2
OZONE
PM10
PM25
SO2
Year
Tucson
Deer Valley
Tucson
Deer Valley
Tucson
Deer Valley
Tucson
Deer Valley
Tucson
Deer Valley
Tucson
Deer Valley
Tucson
Deer Valley
2018
87
147
0.19
0.38
8.3
15.2
32.0
32.3
29.9
30.5
5.5
7.9
0.1
0.6
2017
73
114
0.18
0.41
8.4
15.8
31.7
31.9
32.2
29.9
7.1
7.1
0.1
1.4
2016
68
107
0.21
0.41
7.9
15.5
29.7
30.8
25.3
28.1
4.5
7.1
0.1
0.4
2015
62
100
0.21
0.40
8.7
17.1
29.7
30.2
25.4
23.7
5.1
7.3
0.2
0.9
2014
74
115
0.19
0.40
10.0
19.2
28.8
30.8
28.0
31.8
5.6
8.0
0.2
1.1
2013
94
124
0.17
0.39
10.4
19.5
30.4
31.7
30.9
30.0
6.8
7.9
0.2
0.9
2012
73
127
0.20
0.37
11.8
20.8
30.0
31.7
31.2
35.9
5.6
8.8
0.2
1.3
2011
81
163
0.22
0.40
11.9
19.1
31.0
31.7
29.7
35.2
5.8
9.4
0.3
0.9
2010
68
100
0.29
0.42
10.8
18.4
30.5
30.1
25.5
25.7
N/A
8.3
0.5
1.1
2009
82
104
0.25
0.43
11.2
18.6
29.2
29.0
31.9
35.2
N/A
N/A
0.5
1.4
2008
81
105
0.29
0.44
12.2
19.8
29.2
29.5
32.0
38.2
N/A
N/A
0.9
1.8
2007
75
128
0.37
0.48
13.4
21.8
28.7
27.8
27.3
46.3
N/A
N/A
0.9
2.2
2006
74
129
0.41
0.54
15.3
23.9
27.7
28.5
17.3
49.2
N/A
N/A
0.6
2.1
2005
76
111
0.43
0.64
15.1
24.5
26.0
26.4
17.8
41.4
N/A
N/A
0.7
2.1
2004
77
101
0.49
0.68
15.6
24.2
25.6
26.1
14.0
32.1
N/A
N/A
1.2
1.4
2003
81
102
0.57
0.78
17.2
25.4
27.1
26.8
19.2
42.6
N/A
N/A
1.2
1.4
2002
76
112
0.56
0.85
16.9
26.9
26.8
27.3
19.9
41.8
N/A
N/A
1.0
1.6
2001
70
107
0.55
0.87
16.4
26.7
26.1
27.4
23.2
37.8
N/A
N/A
0.8
1.5
2000
78
120
0.50
1.04
16.7
29.6
26.4
28.6
N/A
45.6
N/A
N/A
2.3
1.7
Natural disasters
Type
Tucson
Deer Valley
Tornado activity compared to U.S. average
8.9%
16.7%
Earthquake activity compared to U.S. average
1,584.9%
2,683.8%
Natural disasters compared to U.S. average
13%
16%
Transportation
Tucson has an extensive public transit system, Sun Tran, and also a modern streetcar connecting the University with downtown. In Deer Valley, most residents rely on cars for transportation, and it's close to I-17 for commuting to central Phoenix.
Transport
Type
Tucson
Deer Valley
Amtrak stations
1
0
Amtrak stations nearby
1
1
FAA registered aircraft
983
0
FAA registered aircraft manufacturers and dealers
14
0
Means of transportation to work
Type
Tucson
Deer Valley
Bicycle
1%
0.3%
Bus
1.9%
0.3%
Carpooled
11.5%
10.2%
Car alone
81.9%
81.6%
Motorcycle
0.5%
0.4%
Walked
2.3%
0.7%
Average travel time to work
Type
Tucson
Deer Valley
Average
26 min
31 min
Real Estate
Tucson offers a diverse real estate market with a wide range of prices, from affordable homes to high-end properties. Deer Valley's real estate market tends to be slightly more expensive, with a variety of single-family homes and condos available.
Neighborhoods
Tucson is known for its historic districts and neighborhoods each with unique characteristics. Meanwhile, Deer Valley is a suburban community with more modern developments and gated communities.
Houses and residents
Type
Tucson
Deer Valley
Houses
242,816
58,709
Average household size (people)
2.4
2.7
Houses occupied
223,068 (91.9%)
53,676 (91.4%)
Houses occupied by owners
114,708 (51.4%)
47,925 (89.3%)
Houses occupied by renters
108,360 (48.6%)
5,751 (10.7%)
Median rent asked for vacant for-rent units
$801.80
$1,840
Median price asked for vacant for-sale houses and condos
$557,132
$442,377
Estimated median house or condo value
$224,800
$553,560
Median number of rooms in apartments
4
5.5
Median number of rooms in houses and condos
5.8
7.4
Renting percentage
48.1%
20.6%
Housing density (houses/condos per square mile)
1,247.3
143.7
Household income disparities
44.9%
33.7%
Housing units without a mortgage
1,087 (1.5%)
6,119 (13.8%)
Housing units with both a second mortgage and home equity loan
2,785 (3.9%)
166 (0.4%)
Housing units with a mortgage
70,054 (98.5%)
38,245 (86.2%)
Housing units with a home equity loan
211 (0.3%)
4,651 (10.5%)
Housing units with a second mortgage
4,051 (5.7%)
5,351 (12.1%)
Housing units lacking complete kitchen facilities
1.2%
0.4%
Housing units lacking complete plumbing facilities
Self-employed workers in own not incorporated business
14,487
5,256
State government workers
17,981
3,306
Unpaid family workers
709
168
Industries and Occupations
The major industries in Tucson are education, healthcare, and government with many residents working in these sectors. In Deer Valley, major industries include retail, healthcare, and hospitality.
Both Tucson and Deer Valley have access to top-notch health care facilities. Tucson has Banner University Medical Center and Deer Valley features Honor Health Deer Valley Medical Center.
Health (county statistics)
Type
Tucson
Deer Valley
General health status score of residents in this county from 1 (poor) to 5 (excellent)
Tucson has well-developed infrastructure that includes transportation, utilities, and public services. The city’s road network and public transit system are extensive. On the other hand, Deer Valley benefits from the metropolitan infrastructure of Phoenix, with a well-maintained network of roads, and proximity to Phoenix’s light rail system and Sky Harbor International Airport.
Infrastructure
Type
Tucson
Deer Valley
TV stations
20
4
Culture and Food
Tucson offers rich cultural and culinary scenes with Mexican influences. It’s also recognized by UNESCO as a "City of Gastronomy". Deer Valley has a growing food scene as well, with a variety of restaurants serving diverse cuisines.
Sports Teams
Tucson is home to the University of Arizona Wildcats. Deer Valley residents typically support Phoenix area teams like the Arizona Diamondbacks (MLB), Phoenix Suns (NBA), and Arizona Cardinals (NFL).

 Tucson, AZ
 Deer Valley, AZ