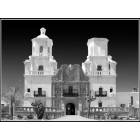
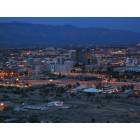
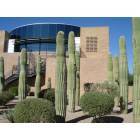
Comparing Tucson and Gilbert, two Arizona cities, reveals significant differences in several areas. Tucson, located in Southern Arizona, is known for its reliable healthcare, cultural diversity, and thriving arts scene. Conversely, Gilbert is renowned for its low crime rates, highly-rated school system and economic stability. These two cities showcase the diverse lifestyle options available in Arizona.
Distance between
Tucson, AZ and
Gilbert, AZ : 92.2 miles
Tucson's population is larger by 99%. Its population has grown by 56,543 people (11.6%) since 2000. The population of Gilbert has grown by 163,439 people (149.0%) during that time.
Safety is often a primary concern for residents and visitors. Tucson's crime rate is higher than Gilbert's according to FBI crime data, making Gilbert appeal more to those concerned about safety. Gilbert is renowned for being one of the safest cities not only in Arizona but in the country as a whole, offering a peaceful environment for families, seniors, and tourists alike.
City-data.com crime index counts serious crimes and violent crime more heavily. It adjusts for the number of visitors and daily workers commuting into cities. (higher means more crime, U.S. average = 301.1)
City-data.com crime index counts serious crimes and violent crime more heavily. It adjusts for the number of visitors and daily workers commuting into cities. (higher means more crime, U.S. average = 301.1)
Sex Offenders
According to our data, there are 1,383 registered sex offenders living in Tucson and 57 registered sex offenders living in . The ratio of residents to sex offenders in Tucson is 384 to 1; the ratio in Gilbert is 4,160 to 1. The number of registered sex offenders compared to the number of residents is much larger in Tucson than that in Gilbert.
Cost of Living
Rising living costs affect everyone, and this is observable in both Tucson and Gilbert. However, according to data from Bestplaces.net, the cost of living in Tucson is significantly lower than in Gilbert, making Tucson more affordable. This affordability deeply influences potential relocations involving families on a budget or retirees.
Income Tax
The state of Arizona has a progressive income tax, meaning the rate increases with income, and it applies to both Gilbert and Tucson residents equally.
Property Tax
In general, Gilbert’s property taxes are higher than Tucson’s due to the higher median home price in Gilbert. However, both cities have property tax rates that are relatively low compared to the national average.
Sales Tax
Both Tucson and Gilbert bear the same state sales tax rate: 5.6%. However, Tucson's total sales tax is higher than Gilbert's, with combined rates from state and local taxes.
Income
Type
Tucson
Gilbert
Estimated median household income
$50,306
$104,802
Estimated per capita income
$27,821
$44,911
Cost of living index (U.S. average is 100)
90.1
101.3
If you make $50,000 in Tucson, you will have to make $56,215 in Gilbert to maintain the same standard of living.
Geographical Conditions
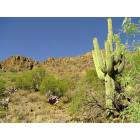
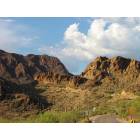
Tucson is located in a desert valley surrounded by five mountain ranges. It has several parks and outdoor activities for hiking lovers. Gilbert, a younger and smaller town, lacks such dramatic geography.
Quality education is a significant factor for any family considering relocation. Gilbert outshines Tucson in this regard, with several of its schools earning high rankings from GreatSchools. Additionally, Gilbert's proximity to Phoenix provides access to a multitude of colleges and universities.
Tucson’s economy is based on education, healthcare and military sectors, and has a higher unemployment rate than Gilbert. On the other hand, Gilbert has a very stable economy and lower unemployment rate, which is driven by jobs in healthcare, retail trade, and education.
Biggest Employers
The biggest employers in Tucson are the University of Arizona and Banner Health. In contrast, the largest employers in Gilbert are Banner Health, and the Gilbert Public Schools. The presence of these employers contributes positively to the towns' economies.
There were 1,134 building permits issued in Tucson in 2012 (832 more than in 2011) compared to 1,470 building permits issued in Gilbert in 2012 (71 less than in 2011).
In Tucson (Pima County), 52.7% voted for Democrats and 45.7% for Republicans in 2012 Presidential Election. In Gilbert (Maricopa County), 43.6% voted for Democrats and 54.3% for Republicans.
Elections
Type
Democrats
Republicans
Other
Year
Tucson
Gilbert
Tucson
Gilbert
Tucson
Gilbert
2020
58.4%
50.2%
39.8%
48.0%
1.7%
1.8%
2016
53.3%
44.9%
39.7%
47.7%
7.0%
7.5%
2012
52.7%
43.6%
45.7%
54.3%
1.6%
2.1%
2008
52.4%
44.0%
46.3%
54.5%
1.4%
1.5%
2004
52.7%
42.4%
46.7%
57.0%
0.6%
0.6%
2000
51.4%
43.0%
43.3%
53.4%
5.3%
3.6%
1996
52.2%
44.5%
39.4%
47.2%
8.5%
8.2%
Breakdown of population affiliated with a religious congregation
Type
Adherents
Congregations
Religion
Tucson
Gilbert
Tucson
Gilbert
CATHOLIC CHURCH
20.8%
13.6%
7.9%
4.3%
SOUTHERN BAPTIST CONVENTION
2.3%
1.9%
10.4%
6.5%
EVANGELICAL LUTHERAN CHURCH IN AMERICA
0.9%
0.8%
2.5%
2.0%
EPISCOPAL CHURCH
0.8%
0.3%
1.4%
1.3%
LUTHERAN CHURCH
0.4%
0.5%
1.4%
1.5%
SEVENTH DAY ADVENTIST CHURCH
0.3%
0.4%
1.9%
2.0%
VINEYARD USA
0.0%
0.3%
0.5%
0.6%
Weather
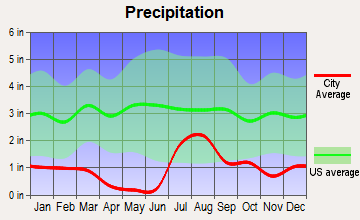
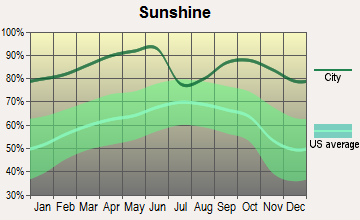
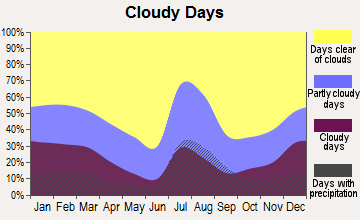
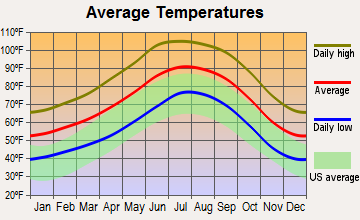
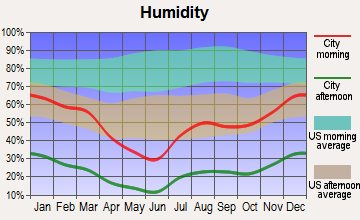
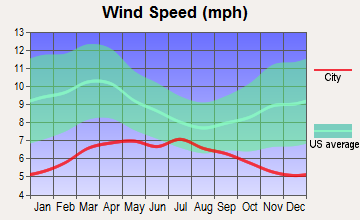
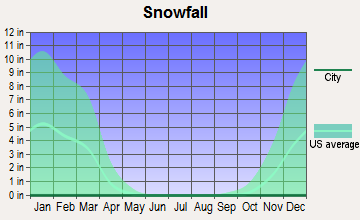
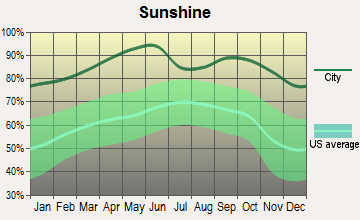
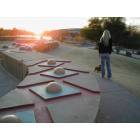
Both cities have typical Arizona weather—hot summers and mild winters. Tucson, however, has a slightly hotter climate than Gilbert. Because Tucson is situated within a desert valley, it experiences warmer temperatures overall. But, it also offers stunning desert sunsets, a concern for tourists. Gilbert, while generally a bit cooler, is still in a desert region and experiences similar climate patterns.
Weather and climate
Type
Tucson
Gilbert
Temperature - Average
70°F
71.5°F
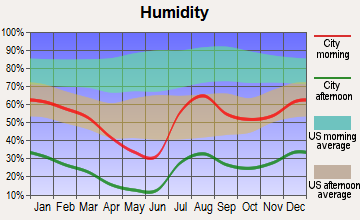
Humidity - Average morning or afternoon humidity
38.6%
37.5%
Humidity - Differences between morning and afternoon humidity
46%
48%
Humidity - Maximum monthly morning or afternoon humidity
58%
60%
Humidity - Minimum monthly morning or afternoon humidity
12%
12%
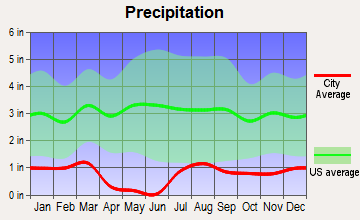
Precipitation - Yearly average
12 in
9.3 in
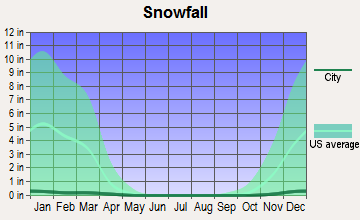
Snowfall - Yearly average
2 in
0 in
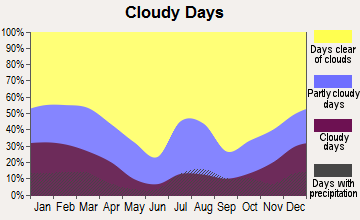
Clouds - Number of days clear of clouds
32.3%
35.2%
Sunshine amount - Average
92.8%
92.8%
Sunshine amount - Differences during a year
15%
16%
Sunshine amount - Maximum monthly
94%
95%
Sunshine amount - Minimum monthly
79%
79%
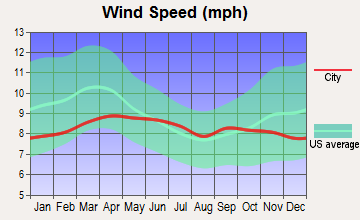
Wind speed - Average
8.3 mph
6.6 mph
Average climate in Tucson, Arizona
Average climate in Gilbert, Arizona
Air pollution
Type
AQI
CO
NO2
OZONE
PM10
PM25
SO2
Year
Tucson
Gilbert
Tucson
Gilbert
Tucson
Gilbert
Tucson
Gilbert
Tucson
Gilbert
Tucson
Gilbert
Tucson
Gilbert
2018
87
201
0.19
0.30
8.3
15.2
32.0
32.8
29.9
38.7
5.5
7.7
0.1
0.6
2017
73
131
0.18
0.33
8.4
15.9
31.7
33.0
32.2
37.2
7.1
7.9
0.1
1.4
2016
68
124
0.21
0.34
7.9
15.8
29.7
32.4
25.3
29.8
4.5
7.0
0.1
0.4
2015
62
104
0.21
0.38
8.7
17.6
29.7
31.3
25.4
25.1
5.1
7.1
0.2
0.9
2014
74
135
0.19
0.40
10.0
19.7
28.8
31.0
28.0
35.1
5.6
8.5
0.2
1.1
2013
94
142
0.17
0.35
10.4
20.0
30.4
32.1
30.9
35.0
6.8
7.1
0.2
0.9
2012
73
159
0.20
0.39
11.8
21.3
30.0
31.5
31.2
38.5
5.6
8.7
0.2
1.3
2011
81
205
0.22
0.36
11.9
18.8
31.0
31.7
29.7
39.6
5.8
9.5
0.3
0.9
2010
68
100
0.29
0.39
10.8
16.8
30.5
31.2
25.5
30.6
N/A
8.3
0.5
1.2
2009
82
109
0.25
0.42
11.2
17.0
29.2
31.1
31.9
38.4
N/A
N/A
0.5
1.1
2008
81
106
0.29
0.37
12.2
18.0
29.2
32.1
32.0
40.2
N/A
N/A
0.9
1.2
2007
75
135
0.37
0.43
13.4
19.9
28.7
30.0
27.3
53.0
N/A
N/A
0.9
1.9
2006
74
138
0.41
0.51
15.3
22.5
27.7
30.2
17.3
61.9
N/A
N/A
0.6
1.8
2005
76
109
0.43
0.57
15.1
23.0
26.0
28.2
17.8
51.2
N/A
N/A
0.7
1.8
2004
77
97
0.49
0.58
15.6
22.8
25.6
28.0
14.0
33.5
N/A
N/A
1.2
1.4
2003
81
99
0.57
0.65
17.2
24.3
27.1
29.1
19.2
42.6
N/A
N/A
1.2
1.4
2002
76
110
0.56
0.75
16.9
25.2
26.8
28.0
19.9
41.8
N/A
N/A
1.0
1.6
2001
70
105
0.55
0.73
16.4
24.1
26.1
26.7
23.2
37.8
N/A
N/A
0.8
1.5
2000
78
117
0.50
0.73
16.7
29.7
26.4
27.3
N/A
45.6
N/A
N/A
2.3
1.7
Natural disasters
Type
Tucson
Gilbert
Tornado activity compared to U.S. average
8.9%
18.3%
Earthquake activity compared to U.S. average
1,584.9%
2,340.4%
Natural disasters compared to U.S. average
13%
16%
Transportation
Tucson has a well-established public transit system run by Sun Tran, offering bus services throughout the city. Meanwhile, Gilbert is served by a limited public transit system, but commuting is made easier as it is surrounded by major highways and close to Phoenix.
Transport
Type
Tucson
Gilbert
Amtrak stations
1
0
Amtrak stations nearby
1
2
FAA registered aircraft
983
235
FAA registered aircraft manufacturers and dealers
14
5
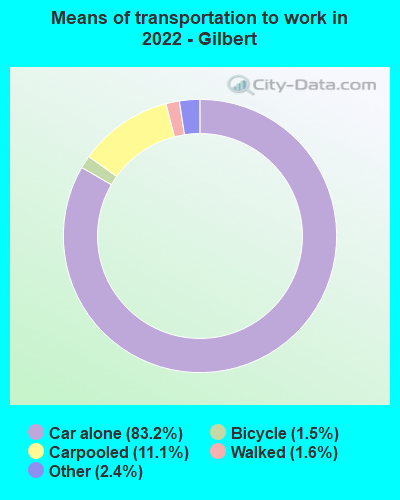
Means of transportation to work
Type
Tucson
Gilbert
Bicycle
1%
0.9%
Bus
1.9%
0.4%
Carpooled
11.5%
11.3%
Car alone
81.9%
84.2%
Motorcycle
0.5%
0.5%
Walked
2.3%
1.6%
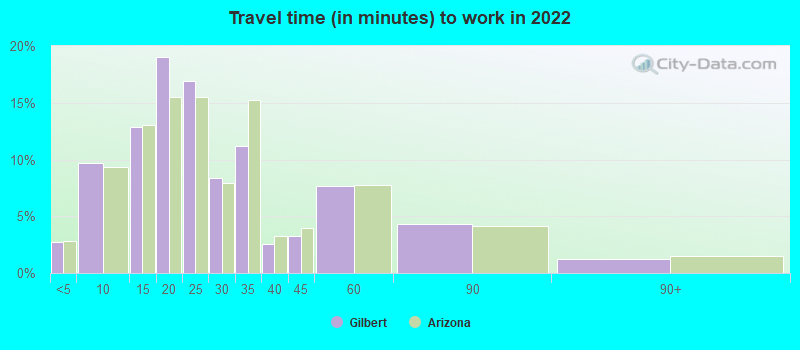
Average travel time to work
Type
Tucson
Gilbert
Average
26 min
24.4 min
Other means
21.6 min
29.5 min
Public transportation
42.5 min
54.2 min
Private vehicle occupancy
Type
Tucson
Gilbert
Average
1.2
1.1
Drove alone
86.3%
90.7%
In 2 person carpool
10.1%
7%
In 3 person carpool
2.5%
1.3%
In 4 person carpool
1%
0.5%
In 5-6 person carpool
0.1%
0.5%
How many people usually rode to work in the car, truck or van.
Real Estate
Real estate in Gilbert is generally more expensive than Tucson, with homes having a higher median price. Gilbert’s real estate market is competitive and fast-paced, while Tucson’s real estate market is considered healthier and more stable because of its affordability.
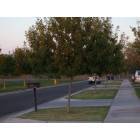
Neighborhoods
Tucson's neighborhoods offer a mix of historic districts and sprawling suburbs. Meanwhile, Gilbert’s neighborhoods are typically suburban, well-planned and family-oriented. Each city offers unique neighborhood characteristics, with the commonality of being mostly safe and convenient.
Houses and residents
Type
Tucson
Gilbert
Houses
242,816
95,508
Average household size (people)
2.4
3
Median year apartment built
1979
2004
Median year house/condo built
1978
2002
Length of stay in the house since moving in
13.2 years
8.9 years
Houses occupied
223,068 (91.9%)
93,472 (97.9%)
Houses occupied by owners
114,708 (51.4%)
69,983 (74.9%)
Houses occupied by renters
108,360 (48.6%)
23,489 (25.1%)
Median rent asked for vacant for-rent units
$801.80
$2,843
Median monthly housing costs
$951
$1,709
Median price asked for vacant for-sale houses and condos
$557,132
$332,809
Estimated median house or condo value
$224,800
$484,600
Median numbers of rooms
4.9
6.3
Median number of rooms in apartments
4
4.5
Median number of rooms in houses and condos
5.8
6.8
Median house age
43
18
Renting percentage
48.1%
24.7%
Housing density (houses/condos per square mile)
1,247.3
2,223.4
House value disparities
32.8%
22.3%
Household income disparities
44.9%
36.9%
Median household income for houses/condes with a mortgage
$76,356
$122,725
Median household income for apartments without a mortgage
$54,612
$97,218
Housing units without a mortgage
1,087 (1.5%)
1,076 (1.9%)
Housing units with both a second mortgage and home equity loan
2,785 (3.9%)
2,828 (5%)
Housing units with a mortgage
70,054 (98.5%)
55,398 (98.1%)
Housing units with a home equity loan
211 (0.3%)
175 (0.3%)
Housing units with a second mortgage
4,051 (5.7%)
3,491 (6.2%)
House/condo owner moved in on average (years ago)
11
6
House/condo renter moved in on average (years ago)
1
1
Housing units lacking complete kitchen facilities
1.2%
0.7%
Housing units lacking complete plumbing facilities
0.8%
0.2%
Housing units in structures
Housing units in structures
Tucson
Gilbert
One, detached
53.5%
82.5%
One, attached
8.3%
2.6%
Two
2.5%
0.5%
3 or 4
4.3%
1.3%
5 to 9
5.0%
2.5%
10 to 19
5.6%
3.4%
20 to 49
5.8%
1.6%
50 or more
8.6%
5.3%
Mobile homes
6.2%
0.2%
Boats, RVs, vans, etc.
0.2%
0.0%
Median real estate property taxes paid for housing units
Self-employed workers in own not incorporated business
14,487
5,669
State government workers
17,981
5,211
Unpaid family workers
709
101
Industries and Occupations
In Tucson, major industries include healthcare, education, and military. In Gilbert, however, the largest sectors are healthcare, retail trade and education services. There’s a lower percentage of blue-collar jobs in Gilbert compared to Tucson, making Gilbert more appealing to professionals.
Tucson shines in healthcare, being home to Banner University Medical Center, one of the top-ranking hospitals in the country. In Gilbert, the medical sector is still growing and improving, but it offers good access to quality health care facilities, particularly Banner Health.
Health (county statistics)
Type
Tucson
Gilbert
General health status score of residents in this county from 1 (poor) to 5 (excellent)
Both cities have high-quality infrastructure, but Gilbert stands out with its newer, modern infrastructure. Tucson, however, has a more traditional infrastructure that is associated with its rich history and culture.
Infrastructure
Type
Tucson
Gilbert
Hospitals
24
4
TV stations
20
20
Bank branches located here
159
52
Bank institutions located here
17
16
Drinking water stations with reported violations in the past
HMDA - Conventional home purchase loans - Applications denied
Year
Tucson
Gilbert
1999
3,131
501
2000
1,601
296
2001
912
209
2002
778
235
2003
1,409
625
2004
2,041
931
2005
2,872
1,315
2006
2,833
1,236
2007
1,601
873
2008
714
335
2009
386
178
Culture and Food
Culture and food define a lot about any city’s character. Tucson, said to have more restaurants per capita than any other city in the U.S., was named a UNESCO City of Gastronomy. Gilbert, while offering a variety of cuisines, lacks the cultural diversity observed in Tucson.
Sports Teams
For sports fans, neither city has major league sports teams. However, being closer to Phoenix, Gilbert is near professional sports like the Arizona Cardinals (NFL) and Arizona Diamondbacks (MLB). On the other hand, Tucson houses the University of Arizona's Wildcat teams.


 Tucson, AZ
 Gilbert, AZ