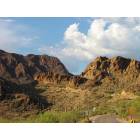
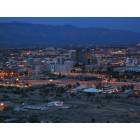
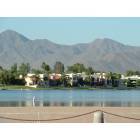
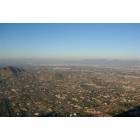
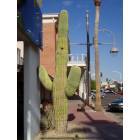
Tucson and Scottsdale are two vibrant cities in the southwestern state of Arizona, each offering a unique lifestyle. Tucson, residing in the Sonoran Desert, is renowned for its rich multicultural history and stunning natural landscapes. It's a city that presents a more affordable cost of living along with a strong education framework. Scottsdale, on the other hand, is known as a luxurious desert city for its higher living cost, upscale real estate, and world-class shopping destinations. It boasts top-notch healthcare services and recreational opportunities.
Distance between
Tucson, AZ and
Scottsdale, AZ : 110.7 miles
Tucson's population is larger by 124%. Its population has grown by 56,543 people (11.6%) since 2000. The population of Scottsdale has grown by 40,048 people (19.8%) during that time.
In terms of crime and safety, Scottsdale is considered safer than Tucson. Scottsdale's crime rate is substantially lower than the national average, while Tucson's crime rate is higher. Both cities have various neighborhood crime watch programs and law enforcement participate in community engagement activities. However, it's always crucial to research the specific neighborhoods before relocation.
City-data.com crime index counts serious crimes and violent crime more heavily. It adjusts for the number of visitors and daily workers commuting into cities. (higher means more crime, U.S. average = 301.1)
City-data.com crime index counts serious crimes and violent crime more heavily. It adjusts for the number of visitors and daily workers commuting into cities. (higher means more crime, U.S. average = 301.1)
Sex Offenders
According to our data, there are 1,383 registered sex offenders living in Tucson and 59 registered sex offenders living in . The ratio of residents to sex offenders in Tucson is 384 to 1; the ratio in Scottsdale is 4,180 to 1. The number of registered sex offenders compared to the number of residents is much larger in Tucson than that in Scottsdale.
Cost of Living
Living in Scottsdale carries a higher cost compared to Tucson, especially in terms of real estate and overall living expenses. Tucson is regarded as one of the most affordable cities in Arizona. Scottsdale, on the other hand, has a higher cost of living index due to its luxury housing, high-end shopping, and upscale dining options.
Income Tax
For income tax, both cities follow the state's income tax rate which ranges from 2.59% to 4.50%, depending on the income bracket.
Property Tax
County property tax rates in both cities are quite similar. However, because of higher real estate prices in Scottsdale, homeowners there generally end up paying more property tax.
Sales Tax
Both cities fall under Arizona’s state sales tax rate of 5.6%. However, with local sales taxes included, Scottsdale has a lower total sales tax rate compared to Tucson.
Income
Type
Tucson
Scottsdale
Estimated median household income
$50,306
$99,097
Estimated per capita income
$27,821
$74,952
Cost of living index (U.S. average is 100)
90.1
105
If you make $50,000 in Tucson, you will have to make $58,269 in Scottsdale to maintain the same standard of living.
Geographical Conditions
Tucson and Scottsdale share a desert environment but differ subtly. Tucson, surrounded by several mountain ranges, is more elevated and has a greater range of flora and fauna. Scottsdale is flatter and largely suburban, but with plenty of access to outdoor activities including hiking and horseback riding in the McDowell Sonoran Preserve.
Both Tucson and Scottsdale have strong educational institutions. Tucson is home to the University of Arizona, offering excellent opportunities for higher education. In contrast, Scottsdale is renowned for its highly-rated public schools and numerous private education options. Scottsdale Community College and the local branch of the University of Phoenix serve Scottsdale residents.
Scottsdale has a more affluent economy with a larger proportion of white-collar jobs in areas like finance, healthcare, and technology. Tucson has a more varied economy with a mix of education, healthcare, and manufacturing roles. The presence of the University of Arizona in Tucson adds to economic diversity.
Biggest Employers
In Tucson, the University of Arizona, Banner Health, and Raytheon Technologies are among the largest employers. Scottsdale's biggest employers are HonorHealth, Vanguard Group, and the City of Scottsdale, providing stability for the city's economy.
There were 1,134 building permits issued in Tucson in 2012 (832 more than in 2011) compared to 553 building permits issued in Scottsdale in 2012 (405 more than in 2011).
In Tucson (Pima County), 52.7% voted for Democrats and 45.7% for Republicans in 2012 Presidential Election. In Scottsdale (Maricopa County), 43.6% voted for Democrats and 54.3% for Republicans.
Elections
Type
Democrats
Republicans
Other
Year
Tucson
Scottsdale
Tucson
Scottsdale
Tucson
Scottsdale
2020
58.4%
50.2%
39.8%
48.0%
1.7%
1.8%
2016
53.3%
44.9%
39.7%
47.7%
7.0%
7.5%
2012
52.7%
43.6%
45.7%
54.3%
1.6%
2.1%
2008
52.4%
44.0%
46.3%
54.5%
1.4%
1.5%
2004
52.7%
42.4%
46.7%
57.0%
0.6%
0.6%
2000
51.4%
43.0%
43.3%
53.4%
5.3%
3.6%
1996
52.2%
44.5%
39.4%
47.2%
8.5%
8.2%
Breakdown of population affiliated with a religious congregation
Type
Adherents
Congregations
Religion
Tucson
Scottsdale
Tucson
Scottsdale
CATHOLIC CHURCH
20.8%
13.6%
7.9%
4.3%
SOUTHERN BAPTIST CONVENTION
2.3%
1.9%
10.4%
6.5%
EVANGELICAL LUTHERAN CHURCH IN AMERICA
0.9%
0.8%
2.5%
2.0%
EPISCOPAL CHURCH
0.8%
0.3%
1.4%
1.3%
LUTHERAN CHURCH
0.4%
0.5%
1.4%
1.5%
SEVENTH DAY ADVENTIST CHURCH
0.3%
0.4%
1.9%
2.0%
VINEYARD USA
0.0%
0.3%
0.5%
0.6%
Weather
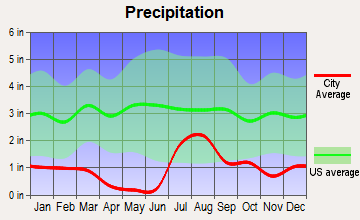
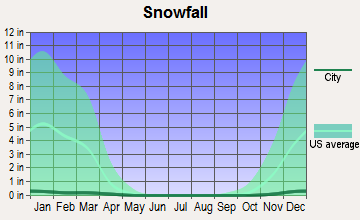
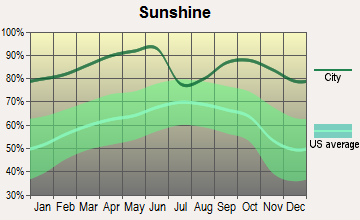
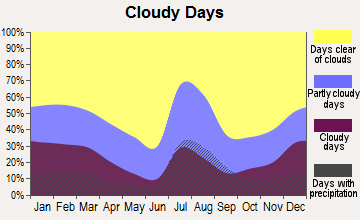
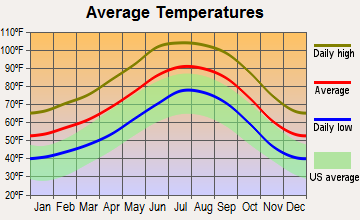
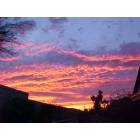
Both Tucson and Scottsdale are located in Arizona, so they share a hot desert climate. However, Scottsdale tends to be somewhat hotter in the summer months. Both cities receive very little rain and experience abundant sunshine throughout the year. Tucson, due to its higher elevation, has cooler winters, and its residents enjoy a bit more variation in seasonal temperature changes.
Weather and climate
Type
Tucson
Scottsdale
Temperature - Average
70°F
71.6°F
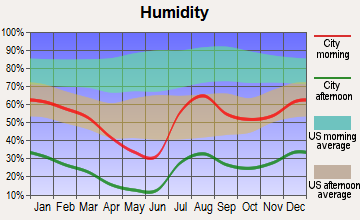
Humidity - Average morning or afternoon humidity
38.6%
37.5%
Humidity - Differences between morning and afternoon humidity
46%
48%
Humidity - Maximum monthly morning or afternoon humidity
58%
60%
Humidity - Minimum monthly morning or afternoon humidity
12%
12%
Precipitation - Yearly average
12 in
9.9 in
Snowfall - Yearly average
2 in
0 in
Clouds - Number of days clear of clouds
32.3%
35.3%
Sunshine amount - Average
92.8%
92.8%
Sunshine amount - Differences during a year
15%
16%
Sunshine amount - Maximum monthly
94%
95%
Sunshine amount - Minimum monthly
79%
79%
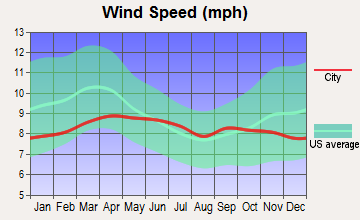
Wind speed - Average
8.3 mph
6.6 mph
Average climate in Tucson, Arizona
Average climate in Scottsdale, Arizona
Air pollution
Type
AQI
CO
NO2
OZONE
PM10
PM25
SO2
Year
Tucson
Scottsdale
Tucson
Scottsdale
Tucson
Scottsdale
Tucson
Scottsdale
Tucson
Scottsdale
Tucson
Scottsdale
Tucson
Scottsdale
2018
87
150
0.19
0.35
8.3
15.0
32.0
31.7
29.9
35.6
5.5
7.8
0.1
0.6
2017
73
116
0.18
0.37
8.4
15.7
31.7
31.9
32.2
33.1
7.1
7.4
0.1
1.4
2016
68
106
0.21
0.35
7.9
15.4
29.7
31.2
25.3
32.1
4.5
7.1
0.1
0.4
2015
62
101
0.21
0.35
8.7
17.2
29.7
29.7
25.4
27.1
5.1
7.3
0.2
0.9
2014
74
116
0.19
0.39
10.0
19.2
28.8
29.8
28.0
35.1
5.6
8.3
0.2
1.1
2013
94
127
0.17
0.35
10.4
19.5
30.4
31.2
30.9
32.0
6.8
7.8
0.2
0.9
2012
73
157
0.20
0.37
11.8
20.8
30.0
31.2
31.2
36.9
5.6
8.8
0.2
1.3
2011
81
204
0.22
0.38
11.9
17.2
31.0
31.3
29.7
38.7
5.8
9.5
0.3
0.9
2010
68
100
0.29
0.38
10.8
13.7
30.5
30.8
25.5
28.6
N/A
8.3
0.5
1.3
2009
82
109
0.25
0.40
11.2
13.9
29.2
30.3
31.9
36.5
N/A
N/A
0.5
0.8
2008
81
106
0.29
0.36
12.2
14.5
29.2
30.6
32.0
38.3
N/A
N/A
0.9
0.8
2007
75
134
0.37
0.42
13.4
16.1
28.7
28.3
27.3
46.5
N/A
N/A
0.9
1.7
2006
74
138
0.41
0.46
15.3
19.3
27.7
29.1
17.3
49.6
N/A
N/A
0.6
1.7
2005
76
109
0.43
0.61
15.1
19.7
26.0
26.6
17.8
42.0
N/A
N/A
0.7
1.5
2004
77
98
0.49
0.62
15.6
19.5
25.6
24.3
14.0
32.9
N/A
N/A
1.2
1.4
2003
81
101
0.57
0.65
17.2
22.1
27.1
25.2
19.2
42.6
N/A
N/A
1.2
1.4
2002
76
111
0.56
0.73
16.9
23.4
26.8
23.4
19.9
41.8
N/A
N/A
1.0
1.6
2001
70
106
0.55
0.73
16.4
21.4
26.1
23.5
23.2
37.8
N/A
N/A
0.8
1.5
2000
78
117
0.50
0.82
16.7
30.2
26.4
26.1
N/A
45.6
N/A
N/A
2.3
1.7
Natural disasters
Type
Tucson
Scottsdale
Tornado activity compared to U.S. average
8.9%
18%
Earthquake activity compared to U.S. average
1,584.9%
2,492.5%
Natural disasters compared to U.S. average
13%
16%
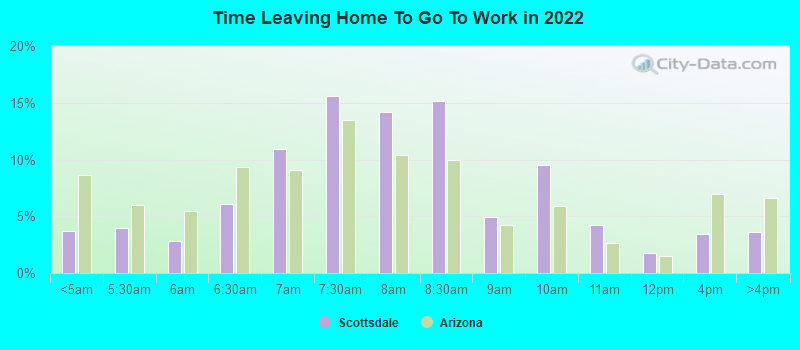
Transportation
Both cities offer public transit systems, although Scottsdale’s is more extensive. Commute times in Tucson are generally shorter due to the city's smaller geographic size. However, both cities are served by international airports, and Scottsdale has an additional local airport.
Transport
Type
Tucson
Scottsdale
Amtrak stations
1
0
Amtrak stations nearby
1
3
FAA registered aircraft
983
726
FAA registered aircraft manufacturers and dealers
14
44
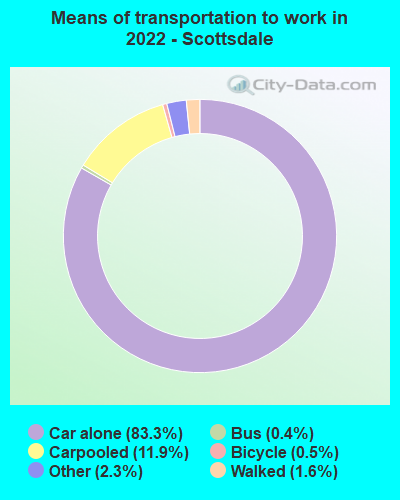
Means of transportation to work
Type
Tucson
Scottsdale
Bicycle
1%
0.6%
Bus
1.9%
0.8%
Carpooled
11.5%
9.8%
Car alone
81.9%
85%
Motorcycle
0.5%
0.3%
Taxicab
0.1%
0.1%
Walked
2.3%
2.1%
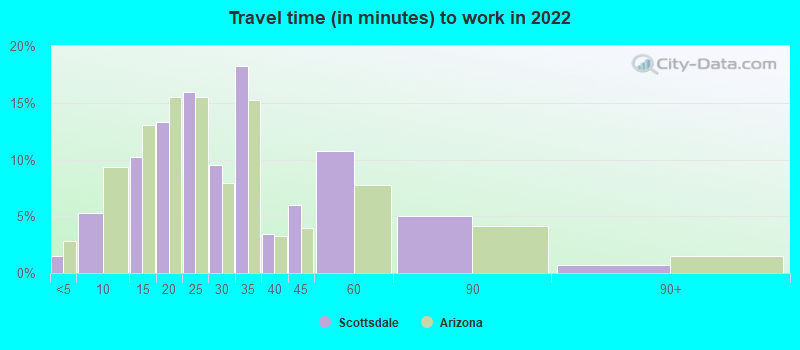
Average travel time to work
Type
Tucson
Scottsdale
Average
26 min
27.8 min
Other means
21.6 min
24.9 min
Public transportation
42.5 min
39.7 min
Private vehicle occupancy
Type
Tucson
Scottsdale
Average
1.2
1.1
Drove alone
86.3%
94%
In 2 person carpool
10.1%
4.9%
In 3 person carpool
2.5%
0.3%
In 4 person carpool
1%
0.3%
In 5-6 person carpool
0.1%
0.5%
How many people usually rode to work in the car, truck or van.
Real Estate
Real estate in Scottsdale is more expensive compared to Tucson. Homes in Tucson are generally more affordable, offering a lower median house value. Scottsdale is notable for its luxury properties, many with resort-style amenities.
Neighborhoods
Tucson is renowned for its historic and artsy neighborhoods like El Presidio and Armory Park. Scottsdale, in contrast, is characterized by its affluent neighborhoods like Gainey Ranch and North Scottsdale, each offering high-end homes and upscale amenities.
Houses and residents
Type
Tucson
Scottsdale
Houses
242,816
138,984
Average household size (people)
2.4
2.1
Median year apartment built
1979
1990
Median year house/condo built
1978
1990
Length of stay in the house since moving in
13.2 years
11.5 years
Houses occupied
223,068 (91.9%)
119,122 (85.7%)
Houses occupied by owners
114,708 (51.4%)
80,132 (67.3%)
Houses occupied by renters
108,360 (48.6%)
38,990 (32.7%)
Median rent asked for vacant for-rent units
$801.80
$2,198
Median monthly housing costs
$951
$1,623
Median price asked for vacant for-sale houses and condos
$557,132
$300,483
Estimated median house or condo value
$224,800
$674,900
Median numbers of rooms
4.9
5.6
Median number of rooms in apartments
4
4
Median number of rooms in houses and condos
5.8
6.5
Median house price - detached houses
$262,219
Over $1,000,000
Median house price - in 2-unit structures
$147,793
$590,277
Median house price - in 3-to-4-unit structures
$125,313
$378,674
Median house price - in 5 or more unit structures
$135,055
$394,962
Median house price - mobile homes
$48,136
$86,054
Median house price - Townhouses or other attached units
$210,375
$530,134
Median house price - All housing units
$234,849
$872,565
Median house age
43
31
Renting percentage
48.1%
31.9%
Housing density (houses/condos per square mile)
1,247.3
754.5
House value disparities
32.8%
27.3%
Household income disparities
44.9%
41.8%
Median household income for houses/condes with a mortgage
$76,356
$137,177
Median household income for apartments without a mortgage
$54,612
$87,918
Housing units without a mortgage
1,087 (1.5%)
658 (1.3%)
Housing units with both a second mortgage and home equity loan
2,785 (3.9%)
6,221 (12.5%)
Housing units with a mortgage
70,054 (98.5%)
49,289 (98.7%)
Housing units with a home equity loan
211 (0.3%)
188 (0.4%)
Housing units with a second mortgage
4,051 (5.7%)
7,674 (15.4%)
House/condo owner moved in on average (years ago)
11
8
House/condo renter moved in on average (years ago)
1
1
Housing units lacking complete kitchen facilities
1.2%
1.4%
Housing units lacking complete plumbing facilities
0.8%
0.4%
Housing units in structures
Housing units in structures
Tucson
Scottsdale
One, detached
53.5%
53.1%
One, attached
8.3%
13.7%
Two
2.5%
0.6%
3 or 4
4.3%
3.9%
5 to 9
5.0%
5.1%
10 to 19
5.6%
5.6%
20 to 49
5.8%
3.7%
50 or more
8.6%
13.4%
Mobile homes
6.2%
1.0%
Boats, RVs, vans, etc.
0.2%
0.0%
Median real estate property taxes paid for housing units
Self-employed workers in own not incorporated business
14,487
8,963
State government workers
17,981
4,079
Unpaid family workers
709
171
Industries and Occupations
The major industries in Tucson are education, healthcare, manufacturing, and retail trade, with manufacturing providing a larger number of blue-collar jobs. However, Scottsdale's economy is heavily leans toward service sectors like finance, insurance, healthcare, and tourism.
Scottsdale stands out with its top-tier healthcare system, hosting Mayo Clinic and Scottsdale Healthcare hospitals. Tucson, while having reputable institutions like Banner-University Medical Center and Tucson Medical Center, generally ranks slightly lower for healthcare.
Health (county statistics)
Type
Tucson
Scottsdale
General health status score of residents in this county from 1 (poor) to 5 (excellent)
Scottsdale boasts better infrastructure, with well-maintained roads, modern buildings, and public spaces. Tucson’s infrastructure is more varied with a blend of historic, newer constructions, and some areas in need of refurbishment. However, it offers more bicycle lanes and is known as a more bike-friendly city than Scottsdale.
Infrastructure
Type
Tucson
Scottsdale
Hospitals
24
8
TV stations
20
18
Arenas or stadiums
2
2
Bank branches located here
159
138
Bank institutions located here
17
42
Main business address for public companies
6
18
Drinking water stations with no reported violations in the past
0
3
Drinking water stations with reported violations in the past
HMDA - Conventional home purchase loans - Applications denied
Year
Tucson
Scottsdale
1999
3,131
1,109
2000
1,601
730
2001
912
530
2002
778
532
2003
1,409
1,056
2004
2,041
1,561
2005
2,872
2,094
2006
2,833
2,107
2007
1,601
1,334
2008
714
696
2009
386
476
Culture and Food
Scottsdale is known for its luxury shopping, high-end dining, and vibrant nightlife. In contrast, Tucson is a designated UNESCO City of Gastronomy, distinguished for its rich culinary heritage. Tucson also boasts deep cultural roots with a blend of Native American, Mexican, and pioneer influences, fostering a more diverse arts scene.
Sports Teams
Neither city hosts major league teams, but sports enthusiasts in Tucson enjoy collegiate sports at the University of Arizona. Scottsdale is a hub for Major League Baseball spring training and offers numerous golf courses.

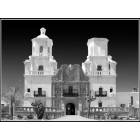
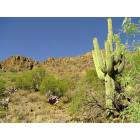


 Tucson, AZ
 Scottsdale, AZ