Washington, DC and Tampa, FL offer distinct urban experiences, each with its own advantages and challenges. While DC boasts a vibrant political scene and a rich history, fertile with cultural landmarks and educational institutions, Tampa offers tropical weather, a diverse economy, and a laid-back lifestyle. Both cities present unique opportunities for work, education, and entertainment, but differ significantly on factors like cost of living, taxation, and public services. Let's delve deeper into different aspects of both cities to aid you in making an informed decision.
Distance between
Washington, DC and
Tampa, FL : 818.3 miles
Washington's population is larger by 73%. Its population has grown by 97,991 people (17.1%) since 2000. The population of Tampa has grown by 83,603 people (27.6%) during that time.
Washington, DC, traditionally had higher crime rates compared to the national average, primarily due to its urban nature. However, over recent years, the city has seen a general decline in crime rates, but they still vary across neighborhoods. Tampa also grapples with crime-related issues but tends to have lower crime rates compared to DC. Nevertheless, both cities have prioritized public safety and implemented numerous community programs and safety initiatives. Tourists are generally safe, especially in areas frequented by visitors but should always remain vigilant.
City-data.com crime index counts serious crimes and violent crime more heavily. It adjusts for the number of visitors and daily workers commuting into cities. (higher means more crime, U.S. average = 301.1)
City-data.com crime index counts serious crimes and violent crime more heavily. It adjusts for the number of visitors and daily workers commuting into cities. (higher means more crime, U.S. average = 301.1)
Sex Offenders
According to our data, there are 1,072 registered sex offenders living in Washington and 1,340 registered sex offenders living in . The ratio of residents to sex offenders in Washington is 635 to 1; the ratio in Tampa is 281 to 1. The number of registered sex offenders compared to the number of residents is a smaller in Washington than in Tampa.
Cost of Living
The cost of living in Washington, DC is significantly higher compared to Tampa. This largely comes down to housing costs, which are drastically more expensive in DC. Additionally, everyday expenses such as groceries, healthcare, and utilities are generally costlier in DC than in Tampa. Tampa, by contrast, has a lower cost of living, making it a more affordable option, particularly for families or retirees on a tight budget.
Income Tax
Washington, DC imposes a progressive income tax system with rates ranging from 4% to 8.95%, while Florida is one of the few states with no state income tax, which can lead to significant savings for Tampa residents.
Property Tax
Washington, DC has a relatively low property tax rate in comparison to the rest of the U.S. Tampa, though the property values are lower, has a somewhat higher property tax rate than DC.
Sales Tax
Washington, DC has a high sales tax rate, averaging around 6%. Tampa, part of Florida, doesn't have a state sales tax but Hillsborough County, where Tampa is located, imposes a 2.5% local sales tax.
Income
Type
Washington
Tampa
Estimated median household income
$90,088
$63,404
Estimated per capita income
$65,808
$43,517
Cost of living index (U.S. average is 100)
124.2
99.8
If you make $50,000 in Tampa, you will have to make $62,224 in Washington to maintain the same standard of living.
Geographical Conditions
Washington, DC is situated by the Potomac River, with flat land and gentle hills. Its proximity to Chesapeake Bay and the Atlantic Ocean affords it a humid climate. Meanwhile, Tampa is located on Tampa Bay, near the Gulf of Mexico, granting it a tropical climate. Tampa's geographical location, however, also makes it susceptible to hurricanes.
Washington, DC houses renowned universities such as Georgetown and Howard, along with a network of public and private schools. It also features many cultural and educational landmarks, like the Smithsonian, which can enrich learning experiences. Tampa also has a notable educational scene, with institutions like the University of South Florida and Hillsborough Community College. However, DC's presence of historical and legislative institutions gives it an upper hand educationally.
Washington, DC has a diverse economy, with the federal government as the primary employer. It also offers a thriving market in sectors such as education, healthcare, and tourism. Tampa's economy is well-rounded, with strong sectors in finance, healthcare, tourism, and real estate. The unemployment rate in both cities is relatively similar and constant with the national average, although job opportunities differ based on specific industries of focus.
Biggest Employers
The federal government is the largest employer in Washington, DC, followed by major universities and healthcare providers. For Tampa, the biggest employers belong to the healthcare, retail, and financial services sectors, with companies including BayCare Health System, Publix Super Markets, and JP Morgan Chase.
There were 376 building permits issued in Washington in 2012 (149 more than in 2011) compared to 1,312 building permits issued in Tampa in 2012 (722 more than in 2011).
In Washington (District of Columbia), 90.9% voted for Democrats and 7.3% for Republicans in 2012 Presidential Election. In Tampa (Hillsborough County), 53.0% voted for Democrats and 46.3% for Republicans.
Elections
Type
Democrats
Republicans
Other
Year
Washington
Tampa
Washington
Tampa
Washington
Tampa
2020
92.6%
52.9%
5.4%
46.0%
2.0%
1.1%
2016
90.9%
51.2%
4.1%
44.4%
5.0%
4.5%
2012
90.9%
53.0%
7.3%
46.3%
1.8%
0.6%
2008
92.5%
53.4%
6.5%
46.2%
1.0%
0.4%
2004
89.6%
46.4%
9.4%
53.2%
1.0%
0.4%
2000
85.2%
47.2%
9.0%
50.4%
5.9%
2.4%
1996
85.2%
46.8%
9.3%
44.3%
5.5%
8.9%
Breakdown of population affiliated with a religious congregation
Type
Adherents
Congregations
Religion
Washington
Tampa
Washington
Tampa
CATHOLIC CHURCH
12.6%
10.7%
7.4%
2.8%
AMERICAN BAPTIST CHURCHES IN THE USA
6.2%
0.0%
10.3%
0.2%
SOUTHERN BAPTIST CONVENTION
4.4%
8.3%
10.3%
19.4%
EPISCOPAL CHURCH
3.1%
0.5%
5.3%
1.4%
SEVENTH DAY ADVENTIST CHURCH
0.9%
0.5%
1.8%
2.2%
MUSLIM ESTIMATE
0.7%
1.7%
1.1%
1.1%
EVANGELICAL LUTHERAN CHURCH IN AMERICA
0.5%
0.5%
2.1%
1.2%
LUTHERAN CHURCH
0.1%
0.3%
0.3%
1.1%
Weather
Washington experiences a typical Mid-Atlantic climate, with hot, humid summers and cold, wet winters. Fall and spring are quite pleasant though. Tampa, on the other hand, enjoys a tropical climate with year-round warm temperatures and high humidity, with rainy summers and dry winters. While Washington offers an opportunity to experience four distinct seasons, Tampa's consistent warm weather particularly appeals to those averse to cold weather.
Weather and climate
Type
Washington
Tampa
Temperature - Average
56.4°F
73.1°F
Humidity - Average morning or afternoon humidity
68.8%
77.6%
Humidity - Differences between morning and afternoon humidity
33%
38%
Humidity - Maximum monthly morning or afternoon humidity
81%
89%
Humidity - Minimum monthly morning or afternoon humidity
48%
51%
Precipitation - Yearly average
42.7 in
45.6 in
Snowfall - Yearly average
32.4 in
0 in
Clouds - Number of days clear of clouds
15.9%
16.9%
Sunshine amount - Average
61.5%
74.8%
Sunshine amount - Differences during a year
21%
18%
Sunshine amount - Maximum monthly
66%
80%
Sunshine amount - Minimum monthly
45%
62%
Wind speed - Average
9.7 mph
7.4 mph
Average climate in Washington, District of Columbia
Average climate in Tampa, Florida
Air pollution
Type
AQI
CO
NO2
OZONE
PB
PM10
PM25
SO2
Year
Washington
Tampa
Washington
Tampa
Washington
Tampa
Washington
Tampa
Washington
Tampa
Washington
Tampa
Washington
Tampa
Washington
Tampa
2018
88
68
0.32
0.16
11.6
N/A
23.2
27.7
N/A
N/A
16.4
18.9
8.8
7.9
0.8
1.1
2017
84
79
0.32
0.17
12.3
N/A
24.9
28.4
N/A
N/A
16.5
20.5
9.8
8.8
1.0
0.6
2016
98
71
0.43
0.17
14.7
N/A
24.6
30.8
0.002
N/A
17.2
20.2
9.5
7.9
1.0
0.8
2015
91
74
0.34
0.15
14.8
N/A
26.2
28.7
0.002
N/A
17.0
19.0
10.4
10.0
1.3
2.2
2014
85
74
0.33
0.16
11.6
N/A
25.9
28.0
0.002
N/A
17.1
20.0
10.0
8.4
1.0
1.6
2013
88
68
0.34
0.16
11.7
N/A
25.6
27.7
0.002
N/A
17.3
20.3
11.6
9.3
1.0
1.4
2012
103
85
0.58
0.17
15.2
N/A
27.6
28.0
0.002
N/A
N/A
21.0
12.2
9.7
1.6
1.0
2011
105
83
0.67
0.18
15.4
N/A
27.7
29.2
0.002
N/A
N/A
20.8
11.4
10.1
3.1
1.2
2010
114
84
0.88
0.25
15.9
N/A
29.3
29.8
0.003
N/A
N/A
21.8
9.3
9.9
3.4
1.3
2009
90
77
0.86
0.27
16.2
N/A
24.4
27.4
0.002
N/A
N/A
21.2
7.6
10.1
4.6
1.5
2008
103
86
1.23
0.18
16.2
4.0
25.3
27.5
0.003
N/A
N/A
23.3
8.5
10.2
5.6
2.4
2007
113
102
1.17
0.31
16.8
5.4
27.1
28.8
0.004
N/A
N/A
26.0
10.4
12.0
5.1
3.3
2006
114
99
1.11
0.42
17.2
6.9
25.5
29.5
0.004
N/A
N/A
25.8
10.9
11.6
4.5
3.0
2005
105
99
0.86
0.45
20.5
6.7
22.7
27.9
0.006
N/A
N/A
25.0
11.7
13.2
4.5
3.0
2004
113
92
0.62
0.40
21.3
7.2
20.6
26.5
0.004
0.004
N/A
25.0
11.3
12.5
6.5
3.2
2003
108
94
0.90
0.42
23.6
N/A
20.8
23.8
N/A
0.004
N/A
23.9
12.2
11.7
8.3
4.4
2002
125
84
1.16
0.38
23.7
N/A
25.0
24.5
N/A
0.006
N/A
24.2
N/A
11.5
6.7
4.9
2001
113
100
1.07
0.44
23.9
N/A
22.0
26.2
0.017
0.012
N/A
24.9
N/A
12.1
6.7
4.7
2000
115
98
1.17
0.48
20.2
N/A
19.1
29.3
N/A
0.020
N/A
26.3
N/A
N/A
8.2
5.1
Natural disasters
Type
Washington
Tampa
Tornado activity compared to U.S. average
110.6%
152.6%
Earthquake activity compared to U.S. average
42.9%
11.1%
Natural disasters compared to U.S. average
19%
25%
Transportation
Washington, DC boasts a robust public transit system, with buses, Metrorail, and bike-sharing services facilitating commute. Tampa has a less extensive public transit system but commuting is generally easier due to less traffic congestion and shorter commute times. However, owning a car is more of a necessity in Tampa than in DC.
Transport
Type
Washington
Tampa
Amtrak stations
1
1
Amtrak stations nearby
3
3
FAA registered aircraft
456
541
FAA registered aircraft manufacturers and dealers
3
78
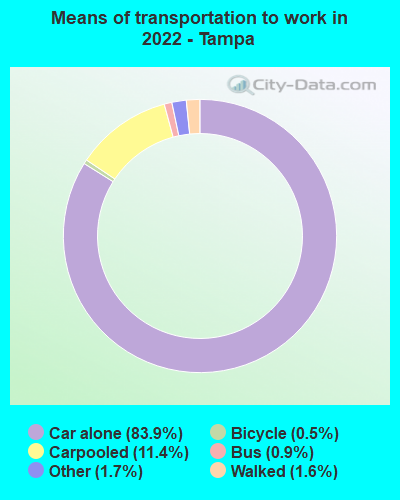
Means of transportation to work
Type
Washington
Tampa
Bicycle
2%
0.4%
Bus
6.3%
1.1%
Carpooled
7.8%
8.5%
Car alone
62.5%
87%
Motorcycle
0.1%
0.2%
Railroad
0.3%
0.2%
Streetcar
10.6%
0%
Subway
1.3%
0%
Taxicab
0.8%
0.1%
Walked
5.7%
1.3%
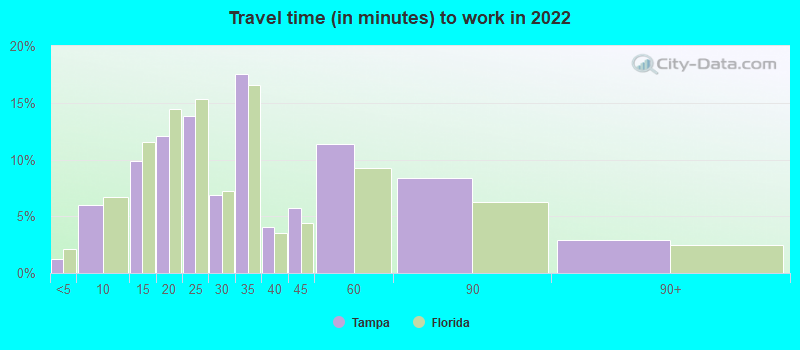
Average travel time to work
Type
Washington
Tampa
Average
39.2 min
31.4 min
Other means
26 min
23.2 min
Public transportation
38.9 min
45.3 min
Private vehicle occupancy
Type
Washington
Tampa
Average
1.1
1.1
Drove alone
89.4%
90.8%
In 2 person carpool
9.7%
6.1%
In 3 person carpool
0.6%
1.7%
In 4 person carpool
0.4%
0.8%
In 5-6 person carpool
0%
0.4%
How many people usually rode to work in the car, truck or van.
Real Estate
The real estate market in DC is pricey, with a high median home price turned by the city's strong job market and high salaries. Tampa's real estate, on the other hand, is considerably more affordable, making it a popular destination for retirees and families alike.
Neighborhoods
Washington, DC has a range of neighborhoods, from the bustling downtown area to quieter, residential suburbs. Tampa also offers diverse neighborhoods, whether you're looking for urban living in Downtown Tampa or a quieter, family-oriented environment in suburbs like Westchase.
Houses and residents
Type
Washington
Tampa
Houses
357,482
172,886
Average household size (people)
2.1
2.4
Median year apartment built
1965
1988
Median year house/condo built
1941
1977
Length of stay in the house since moving in
13.5 years
12.5 years
Houses occupied
319,565 (89.4%)
159,925 (92.5%)
Houses occupied by owners
132,936 (41.6%)
84,660 (52.9%)
Houses occupied by renters
186,629 (58.4%)
75,265 (47.1%)
Median rent asked for vacant for-rent units
$2,791
$1,369
Median monthly housing costs
$1,817
$1,326
Median price asked for vacant for-sale houses and condos
$996,150
$380,334
Estimated median house or condo value
$669,900
$336,200
Median numbers of rooms
3.8
4.9
Median number of rooms in apartments
3.1
3.9
Median number of rooms in houses and condos
6
6
Median house price - detached houses
Over $1,000,000
$477,728
Median house price - in 2-unit structures
Over $1,000,000
$191,392
Median house price - in 3-to-4-unit structures
$471,443
$249,678
Median house price - in 5 or more unit structures
$527,983
$443,026
Median house price - Townhouses or other attached units
$817,288
$499,254
Median house price - All housing units
$790,542
$470,393
Median house age
65
38
Renting percentage
58%
48.3%
Housing density (houses/condos per square mile)
5,821.9
1,542.7
House value disparities
26.7%
34.7%
Household income disparities
45.7%
48.9%
Median household income for houses/condes with a mortgage
$163,111
$107,575
Median household income for apartments without a mortgage
$108,852
$66,260
Housing units without a mortgage
777 (0.8%)
1,024 (1.9%)
Housing units with both a second mortgage and home equity loan
8,586 (8.5%)
4,974 (9.2%)
Housing units with a mortgage
100,122 (99.2%)
53,063 (98.1%)
Housing units with a home equity loan
1,057 (1%)
110 (0.2%)
Housing units with a second mortgage
12,793 (12.7%)
5,716 (10.6%)
House/condo owner moved in on average (years ago)
10
8
House/condo renter moved in on average (years ago)
1
1
Housing units lacking complete kitchen facilities
1.5%
1.2%
Housing units lacking complete plumbing facilities
1.5%
0.9%
Housing units in structures
Housing units in structures
Washington
Tampa
One, detached
11.2%
54.3%
One, attached
22.2%
7.1%
Two
2.7%
2.0%
3 or 4
6.8%
4.5%
5 to 9
7.3%
4.8%
10 to 19
8.5%
5.5%
20 to 49
7.6%
5.5%
50 or more
33.6%
15.1%
Mobile homes
0.2%
1.0%
Median real estate property taxes paid for housing units
Self-employed workers in own not incorporated business
16,654
10,160
State government workers
6,699
6,101
Unpaid family workers
580
602
Industries and Occupations
In Washington, DC, sectors like government, professional services, and education dominate, with occupations in management, law, and teaching being popular. In contrast, Tampa's economy leans heavily on retail trade, healthcare and social assistance, with managerial positions, sales, and service-related jobs being common.
Washington, DC is home to some nationally ranked hospitals, like MedStar Washington Hospital Center. Tampa also has highly regarded healthcare facilities, such as Tampa General Hospital, but overall health care costs generally tend to be cheaper in Tampa compared to DC.
Health (county statistics)
Type
Washington
Tampa
General health status score of residents in this county from 1 (poor) to 5 (excellent)
Being the capital, Washington, DC has a well-planned infrastructure that includes a network of roads, bridges, airports, and an efficient public transit system. Tampa also has well-laid infrastructure but has been facing growing pains related to traffic and urban development. However, both cities are continually investing in infrastructure development to augment the quality of life for their residents.
Infrastructure
Type
Washington
Tampa
Hospitals
114
19
TV stations
27
26
Arenas or stadiums
4
3
Bank branches located here
247
205
Bank institutions located here
34
45
Main business address for public companies
30
24
Drinking water stations with no reported violations in the past
5
58
Drinking water stations with reported violations in the past
HMDA - Conventional home purchase loans - Applications denied
Year
Washington
Tampa
1999
1,328
1,627
2000
1,438
1,292
2001
935
1,001
2002
886
968
2003
1,319
1,390
2004
2,281
2,093
2005
2,920
3,515
2006
3,362
4,460
2007
2,548
2,950
2008
1,095
1,075
2009
514
415
Culture and Food
Washington, DC’s culture is undoubtedly influenced by its status as the nation’s capital, offering a rich variety of museums, art galleries, and cultural experiences, along with a diverse food scene. Tampa also boasts a vibrant arts scene, but with a distinct Latin influence appreciated in local food culture, particularly visible in places like Ybor City.
Sports Teams
Washington, DC hosts major sports teams from the NFL, NBA, MLB, and NHL while also hosting collegiate events. Tampa is also a sports-centric city, home to successful teams in the NFL, NHL, and MLB.


 Washington, DC
 Tampa, FL