Relocating or visiting Washington, DC, or Toledo, OH, provides very different experiences that rely on your personal preferences. The nation's capital, Washington, D.C. has a higher cost of living but offers numerous employment opportunities, amenities, superior public transit, and a rich cultural scene. Toledo, although smaller, boasts a more affordable cost of living, opportunities in various industries, and a sense of small-town community within the city. The decision critically depends on what aspects are more important to the individual or family planning the move or visit.
Distance between
Washington, DC and
Toledo, OH : 394.5 miles
Washington's population is larger by 150%. Its population has grown by 97,991 people (17.1%) since 2000. The population of Toledo has decreased by 45,111 people (14.4%) during that time.
Comparing Washington, D.C. and Toledo from a safety perspective, Washington D.C. has higher reported crime rates than Toledo. Crime rates in Toledo are lower than the national average, making it relatively safer. That said, in both locations, crime rates can significantly vary by neighborhood. For tourists, both cities are generally safe to visit, though it's always important to take standard precautions.
City-data.com crime index counts serious crimes and violent crime more heavily. It adjusts for the number of visitors and daily workers commuting into cities. (higher means more crime, U.S. average = 301.1)
City-data.com crime index counts serious crimes and violent crime more heavily. It adjusts for the number of visitors and daily workers commuting into cities. (higher means more crime, U.S. average = 301.1)
Sex Offenders
According to our data, there are 1,072 registered sex offenders living in Washington and 850 registered sex offenders living in . The ratio of residents to sex offenders in Washington is 635 to 1; the ratio in Toledo is 328 to 1. The number of registered sex offenders compared to the number of residents is a smaller in Washington than in Toledo.
Cost of Living
The overall cost of living in Washington, D.C. is notably higher than Toledo. Housing is the primary factor that drives the cost of living difference. However, D.C. residents typically have higher average incomes compared to Toledo residents, which can help offset the cost disparity.
Income Tax
The District of Columbia has a progressive income tax system, while Ohio has a graduated tax system. Rates will vary depending on your income level.
Property Tax
Property tax rates in D.C. are relatively lower than the national average. In contrast, Toledo, OH, has property taxes that are higher than the national average.
Sales Tax
In Washington, D.C., the combined sales tax rate is 6%. In Toledo, Ohio, the combined state and local sales tax rate is 7.25%.
Income
Type
Washington
Toledo
Estimated median household income
$90,088
$44,150
Estimated per capita income
$65,808
$25,641
Cost of living index (U.S. average is 100)
124.2
91.8
If you make $50,000 in Toledo, you will have to make $67,647 in Washington to maintain the same standard of living.
Geographical Conditions
Washington, D.C., located on the East Coast, has a mix of rivers, parks, and relatively mild terrain. Toledo is located on the western end of Lake Erie, providing a lakeside environment, and is largely flat.
The District of Columbia offers strong educational opportunities with a high concentration of private and public schools, colleges, and universities, including George Washington University and Georgetown University. Toledo also offers good education facilities, including the well-regarded University of Toledo, but does not have as many higher education opportunities as D.C.
Washington, D.C. has a robust economy driven largely by the federal government and related contractors. Toledo's economy, while smaller, is diverse with manufacturing, healthcare, and retail trade being key sectors. D.C. has a lower unemployment rate and a higher average salary compared to Toledo.
Biggest Employers
In Washington, D.C., the biggest employers include the federal government, MedStar Health, and Georgetown University. In Toledo, the largest employers are ProMedica Health System, the University of Toledo, and Jeep (Fiat Chrysler).
There were 376 building permits issued in Washington in 2012 (149 more than in 2011) compared to 23 building permits issued in Toledo in 2012 (10 less than in 2011).
In Washington (District of Columbia), 90.9% voted for Democrats and 7.3% for Republicans in 2012 Presidential Election. In Toledo (Lucas County), 65.2% voted for Democrats and 33.4% for Republicans.
Elections
Type
Democrats
Republicans
Other
Year
Washington
Toledo
Washington
Toledo
Washington
Toledo
2020
92.6%
57.5%
5.4%
40.8%
2.0%
1.7%
2016
90.9%
55.9%
4.1%
38.2%
5.0%
5.9%
2012
90.9%
65.2%
7.3%
33.4%
1.8%
1.4%
2008
92.5%
65.1%
6.5%
33.6%
1.0%
1.4%
2004
89.6%
60.4%
9.4%
39.6%
1.0%
0.0%
2000
85.2%
57.9%
9.0%
39.2%
5.9%
2.8%
1996
85.2%
57.7%
9.3%
32.0%
5.5%
10.3%
Breakdown of population affiliated with a religious congregation
Type
Adherents
Congregations
Religion
Washington
Toledo
Washington
Toledo
CATHOLIC CHURCH
12.6%
20.9%
7.4%
9.4%
AMERICAN BAPTIST CHURCHES IN THE USA
6.2%
0.5%
10.3%
3.2%
SOUTHERN BAPTIST CONVENTION
4.4%
0.3%
10.3%
3.5%
EPISCOPAL CHURCH
3.1%
0.5%
5.3%
2.2%
SEVENTH DAY ADVENTIST CHURCH
0.9%
0.2%
1.8%
0.5%
MUSLIM ESTIMATE
0.7%
0.4%
1.1%
0.8%
EVANGELICAL LUTHERAN CHURCH IN AMERICA
0.5%
4.1%
2.1%
9.1%
LUTHERAN CHURCH
0.1%
0.7%
0.3%
2.7%
NATIONA ASSOCIA CONGREG CHRISTIAN CHURCHES
0.0%
0.3%
0.0%
1.3%
Weather
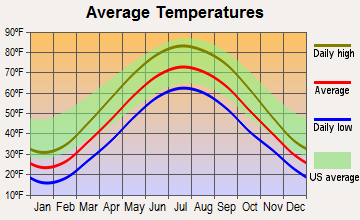
Washington, D.C. experiences more moderate weather conditions than Toledo. D.C. has hot, humid summers and mild to cool winters, which can provide a more comfortable environment for some. Toledo experiences a typical Midwestern climate with hot, humid summers and cold, snow-filled winters, which may be more appealing for people who enjoy distinct seasonal changes.
Weather and climate
Type
Washington
Toledo
Temperature - Average
56.4°F
49.2°F
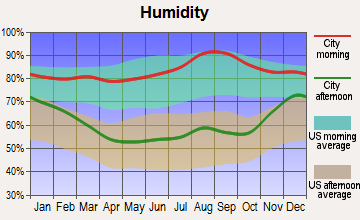
Humidity - Average morning or afternoon humidity
68.8%
76.9%
Humidity - Differences between morning and afternoon humidity
33%
37%
Humidity - Maximum monthly morning or afternoon humidity
81%
89%
Humidity - Minimum monthly morning or afternoon humidity
48%
52%
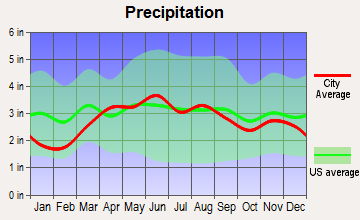
Precipitation - Yearly average
42.7 in
33.3 in
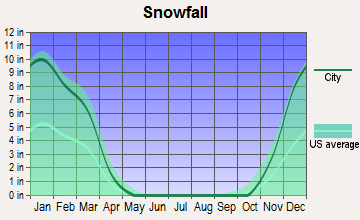
Snowfall - Yearly average
32.4 in
75.3 in
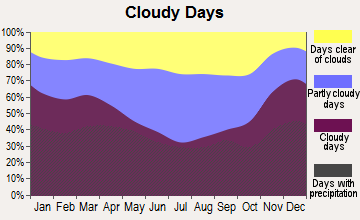
Clouds - Number of days clear of clouds
15.9%
12.3%
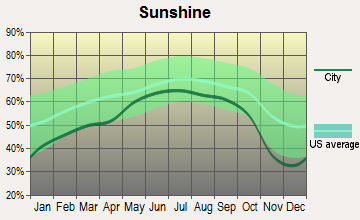
Sunshine amount - Average
61.5%
55.1%
Sunshine amount - Differences during a year
21%
36%
Sunshine amount - Maximum monthly
66%
65%
Sunshine amount - Minimum monthly
45%
29%
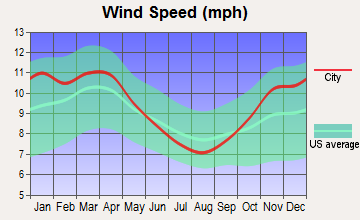
Wind speed - Average
9.7 mph
9.4 mph
Average climate in Washington, District of Columbia
Average climate in Toledo, Ohio
Air pollution
Type
AQI
CO
NO2
OZONE
PB
PM10
PM25
SO2
Year
Washington
Toledo
Washington
Washington
Washington
Toledo
Washington
Washington
Toledo
Washington
Washington
Toledo
2018
88
47
0.32
N/A
11.6
N/A
23.2
30.1
N/A
N/A
16.4
N/A
8.8
N/A
0.8
0.7
2017
84
45
0.32
N/A
12.3
N/A
24.9
29.0
N/A
N/A
16.5
N/A
9.8
N/A
1.0
0.4
2016
98
50
0.43
N/A
14.7
N/A
24.6
29.9
0.002
N/A
17.2
N/A
9.5
N/A
1.0
0.5
2015
91
45
0.34
N/A
14.8
N/A
26.2
28.7
0.002
N/A
17.0
N/A
10.4
N/A
1.3
0.9
2014
85
50
0.33
N/A
11.6
N/A
25.9
28.8
0.002
N/A
17.1
N/A
10.0
N/A
1.0
1.7
2013
88
40
0.34
N/A
11.7
N/A
25.6
25.2
0.002
N/A
17.3
N/A
11.6
N/A
1.0
1.0
2012
103
84
0.58
N/A
15.2
N/A
27.6
30.6
0.002
N/A
N/A
23.5
12.2
N/A
1.6
N/A
2011
105
65
0.67
N/A
15.4
N/A
27.7
25.7
0.002
N/A
N/A
21.0
11.4
N/A
3.1
N/A
2010
114
69
0.88
N/A
15.9
N/A
29.3
27.2
0.003
N/A
N/A
24.6
9.3
N/A
3.4
N/A
2009
90
64
0.86
N/A
16.2
N/A
24.4
25.4
0.002
N/A
N/A
21.4
7.6
N/A
4.6
N/A
2008
103
68
1.23
N/A
16.2
N/A
25.3
26.8
0.003
N/A
N/A
21.6
8.5
N/A
5.6
N/A
2007
113
86
1.17
N/A
16.8
N/A
27.1
25.9
0.004
N/A
N/A
24.2
10.4
N/A
5.1
3.8
2006
114
70
1.11
N/A
17.2
N/A
25.5
24.7
0.004
N/A
N/A
22.8
10.9
N/A
4.5
3.7
2005
105
84
0.86
N/A
20.5
N/A
22.7
27.8
0.006
N/A
N/A
21.6
11.7
N/A
4.5
5.1
2004
113
67
0.62
N/A
21.3
N/A
20.6
23.6
0.004
N/A
N/A
19.2
11.3
N/A
6.5
5.6
2003
108
77
0.90
N/A
23.6
N/A
20.8
26.0
N/A
N/A
N/A
18.5
12.2
N/A
8.3
6.5
2002
125
85
1.16
N/A
23.7
N/A
25.0
27.5
N/A
N/A
N/A
23.5
N/A
N/A
6.7
5.7
2001
113
76
1.07
N/A
23.9
N/A
22.0
26.9
0.017
N/A
N/A
23.4
N/A
N/A
6.7
5.3
2000
115
64
1.17
N/A
20.2
N/A
19.1
24.0
N/A
N/A
N/A
23.4
N/A
N/A
8.2
4.2
Natural disasters
Type
Washington
Toledo
Tornado activity compared to U.S. average
110.6%
144.4%
Earthquake activity compared to U.S. average
42.9%
67.7%
Natural disasters compared to U.S. average
19%
13%
Transportation
Public transit is more comprehensive in D.C., with the Metro system, buses, and various rideshares. Toledo has a public bus system (TARTA), but many residents rely on personal vehicles for transportation.
Transport
Type
Washington
Toledo
Amtrak stations
1
1
Amtrak stations nearby
3
1
FAA registered aircraft
456
102
FAA registered aircraft manufacturers and dealers
3
7
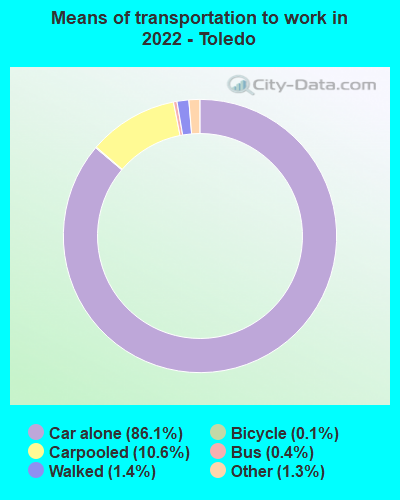
Means of transportation to work
Type
Washington
Toledo
Bicycle
2%
0.2%
Bus
6.3%
1.1%
Carpooled
7.8%
9.2%
Car alone
62.5%
85.7%
Railroad
0.3%
0%
Streetcar
10.6%
0%
Subway
1.3%
0%
Taxicab
0.8%
0.2%
Walked
5.7%
2.2%
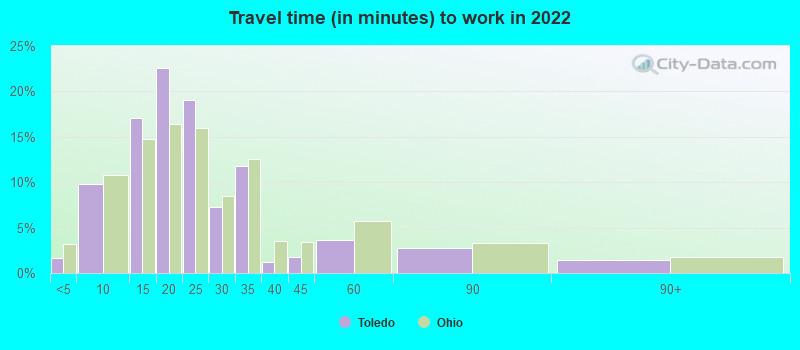
Average travel time to work
Type
Washington
Toledo
Average
39.2 min
22.9 min
Other means
26 min
20.4 min
Public transportation
38.9 min
37.9 min
Private vehicle occupancy
Type
Washington
Toledo
Average
1.1
1.1
Drove alone
89.4%
88.6%
In 2 person carpool
9.7%
9.9%
In 3 person carpool
0.6%
0.6%
In 4 person carpool
0.4%
0.6%
In 5-6 person carpool
0%
0.2%
In 7+ person carpool
0%
0.1%
How many people usually rode to work in the car, truck or van.
Real Estate
Real estate prices in Washington, D.C. are much higher compared to Toledo due to its high demand and central location. Toledo offers a more affordable housing market, making homeownership more accessible for many individuals and families.
Neighborhoods
D.C.'s neighborhoods, like Georgetown and Capitol Hill, offer a cosmopolitan atmosphere with ample dining, shopping, and entertainment options. Toledo's neighborhoods, such as Old West End and Ottawa, offer a quieter, community-centric environment.
Houses and residents
Type
Washington
Toledo
Houses
357,482
133,129
Average household size (people)
2.1
2.3
Median year apartment built
1965
1967
Median year house/condo built
1941
1953
Length of stay in the house since moving in
13.5 years
15.4 years
Houses occupied
319,565 (89.4%)
120,895 (90.8%)
Houses occupied by owners
132,936 (41.6%)
67,831 (56.1%)
Houses occupied by renters
186,629 (58.4%)
53,064 (43.9%)
Median rent asked for vacant for-rent units
$2,791
$666.64
Median monthly housing costs
$1,817
$752
Median price asked for vacant for-sale houses and condos
$996,150
$77,176
Estimated median house or condo value
$669,900
$100,100
Median numbers of rooms
3.8
5.7
Median number of rooms in apartments
3.1
4.5
Median number of rooms in houses and condos
6
6.4
Median house price - detached houses
Over $1,000,000
$114,880
Median house price - in 2-unit structures
Over $1,000,000
$106,468
Median house price - in 3-to-4-unit structures
$471,443
$56,240
Median house price - in 5 or more unit structures
$527,983
$108,374
Median house price - Townhouses or other attached units
$817,288
$127,839
Median house price - All housing units
$790,542
$114,763
Median house age
65
65
Renting percentage
58%
44.5%
Housing density (houses/condos per square mile)
5,821.9
1,651.3
House value disparities
26.7%
38.9%
Household income disparities
45.7%
45.1%
Median household income for houses/condes with a mortgage
$163,111
$70,155
Median household income for apartments without a mortgage
$108,852
$46,019
Housing units without a mortgage
777 (0.8%)
1,756 (4.5%)
Housing units with both a second mortgage and home equity loan
8,586 (8.5%)
2,444 (6.2%)
Housing units with a mortgage
100,122 (99.2%)
37,635 (95.5%)
Housing units with a home equity loan
1,057 (1%)
70 (0.2%)
Housing units with a second mortgage
12,793 (12.7%)
3,377 (8.6%)
House/condo owner moved in on average (years ago)
10
15
House/condo renter moved in on average (years ago)
1
3
Housing units lacking complete kitchen facilities
1.5%
4.1%
Housing units lacking complete plumbing facilities
1.5%
4.3%
Housing units in structures
Housing units in structures
Washington
Toledo
One, detached
11.2%
66.3%
One, attached
22.2%
3.4%
Two
2.7%
5.0%
3 or 4
6.8%
4.7%
5 to 9
7.3%
5.2%
10 to 19
8.5%
4.9%
20 to 49
7.6%
3.1%
50 or more
33.6%
5.4%
Mobile homes
0.2%
2.0%
Median real estate property taxes paid for housing units
Self-employed workers in own not incorporated business
16,654
5,059
State government workers
6,699
3,238
Unpaid family workers
580
91
Industries and Occupations
D.C. is primarily driven by occupations in the public sector, law firms, lobbyists, and international organizations. Toledo, on the other hand, is known for its production, healthcare, and automotive industries, with jobs being more divided among various sectors.
Both cities have solid healthcare provisions. D.C. has nationally-ranked hospitals, such as MedStar Georgetown University Hospital. Toledo also has good healthcare facilities, with the ProMedica Toledo Hospital taking the lead.
Health (county statistics)
Type
Washington
Toledo
General health status score of residents in this county from 1 (poor) to 5 (excellent)
Washington, D.C. offers modern infrastructure, including multiple airports, a metro system, and numerous landmark buildings. Toledo, while not as modern as D.C., has solid infrastructure including Toledo Express Airport and the Port of Toledo.
Infrastructure
Type
Washington
Toledo
Hospitals
114
18
TV stations
27
12
Arenas or stadiums
4
2
Bank branches located here
247
77
Bank institutions located here
34
11
Main business address for public companies
30
9
Drinking water stations with no reported violations in the past
5
10
Drinking water stations with reported violations in the past
HMDA - Conventional home purchase loans - Applications denied
Year
Washington
Toledo
1999
1,328
1,192
2000
1,438
1,302
2001
935
1,034
2002
886
719
2003
1,319
841
2004
2,281
1,086
2005
2,920
1,399
2006
3,362
1,229
2007
2,548
767
2008
1,095
408
2009
514
149
Culture and Food
Cultural life and food options in Washington, D.C. are varied and international, influenced by the city's diverse population. Toledo also offers a rich cultural scene, with a specific strength in visual arts and Midwestern cuisine.
Sports Teams
For sports enthusiasts, D.C. offers more professional sport options, with teams like the Washington Nationals (MLB), Washington Capitals (NHL), and Washington Wizards (NBA). Toledo has minor league teams and is close to major league teams in Detroit.


 Washington, DC
 Toledo, OH