Alexandria city, Virginia (VA)
County owner-occupied free and clear houses and condos in 2010: 4,545
County owner-occupied houses and condos in 2000: 24,727
Renter-occupied apartments: 38,624 (it was 37,162 in 2000)
| % of renters here: | 60% |
| State: | 33% |
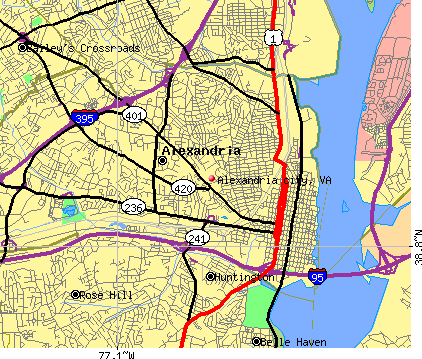
Land area: 15 sq. mi.
Water area: 0.2 sq. mi.
Population density: 10247 people per square mile (very high).
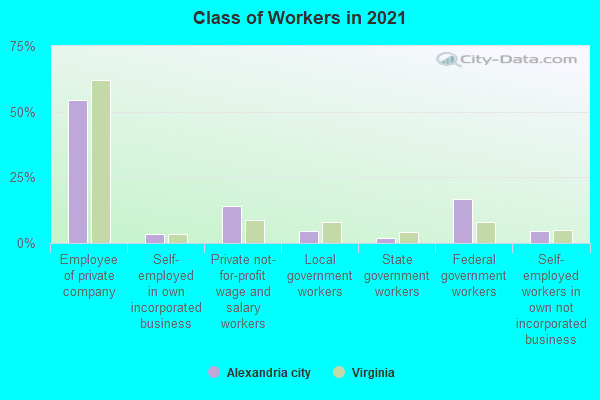
Industries providing employment: Professional, scientific, management, administrative, and waste management services (29.5%), Public administration (17.4%), Educational, health and social services (13.9%).
Type of workers:
- Private wage or salary: 65%
- Government: 28%
- Self-employed, not incorporated: 6%
- Unpaid family work: 0%
- OSM Map
- General Map
- Google Map
- MSN Map

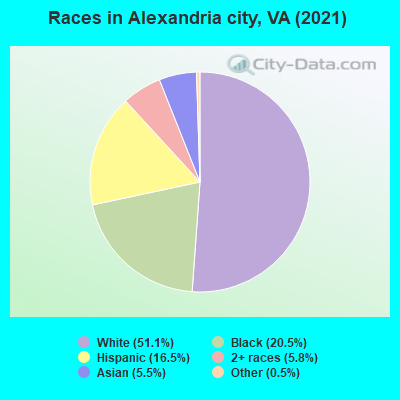
- 77,62849.9%White Non-Hispanic Alone
- 31,83620.5%Black Non-Hispanic Alone
- 26,07216.8%Hispanic or Latino
- 9,5656.2%Asian alone
- 8,9335.7%Two or more races
- 1,4911.0%Some other race alone
| Median resident age: | 38.0 years |
| Virginia median age: | 39.0 years |
| Males: 76,371 | |
| Females: 79,154 |

 | Gov. Northam issues stay-at-home order (108 replies) |
| The Five *worst* neighborhoods in Ffx County (101 replies) |
| Working in Springfield - advice on location (7 replies) |
| Mini-Housing Bubble In NOVA? (153 replies) |
| Where to buy kerosene in Alexandria area? (2 replies) |
| great places for very eligible single 30s guy to live, must work in Fairfax unfortunately (48 replies) |
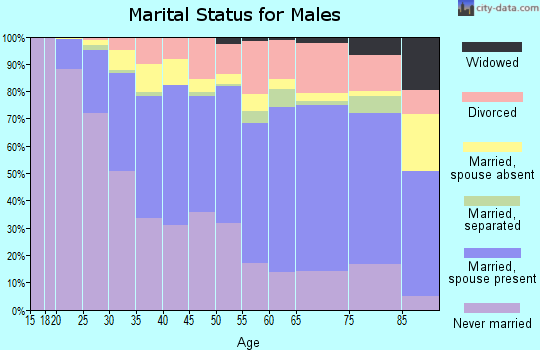
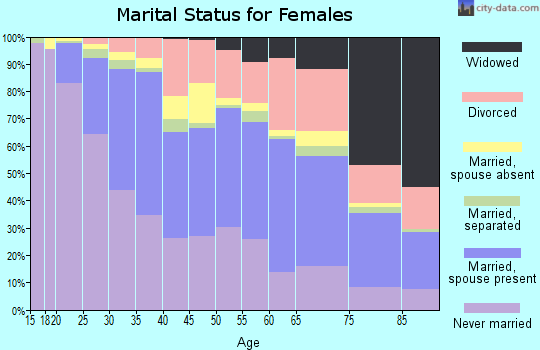
| Alexandria city: | 2.0 people |
| Virginia: | 3 people |
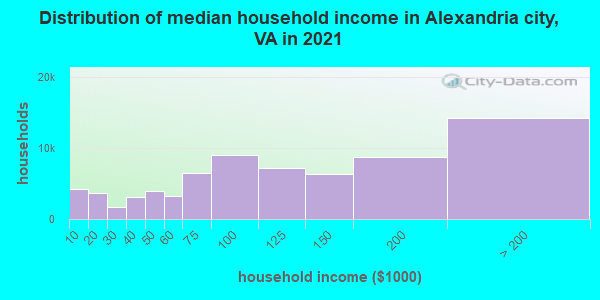
Estimated median household income in 2022: $111,955 ($56,054 in 1999)
| This county: | $111,955 |
| Virginia: | $85,873 |
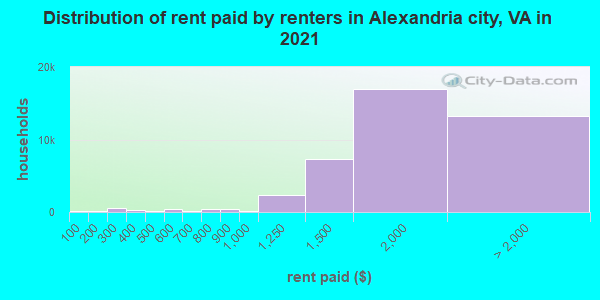
Median contract rent in 2022 for apartments: $1,864 (lower quartile is $1,533, upper quartile is $2,314)
| This county: | $1864 |
| State: | $1270 |
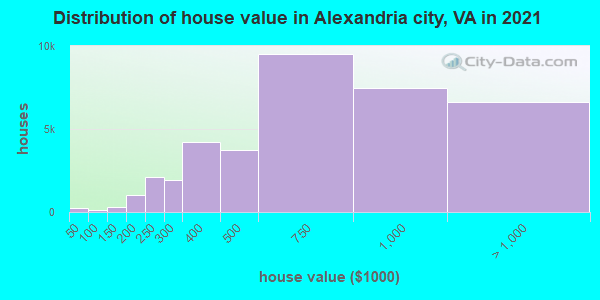
Estimated median house or condo value in 2022: $748,300 (it was $202,400 in 2000)
| Alexandria city: | $748,300 |
| Virginia: | $365,700 |
Mean price in 2022:
Median monthly housing costs for homes and condos with a mortgage: $3,154Detached houses: $1,153,151
Here: $1,153,151 State: $472,865 Townhouses or other attached units: $902,237
Here: $902,237 State: $457,437 In 2-unit structures: $720,104
Here: $720,104 State: $396,289 In 3-to-4-unit structures: $430,465
Here: $430,465 State: $252,346 In 5-or-more-unit structures: $390,441
Here: $390,441 State: $382,551
Median monthly housing costs for units without a mortgage: $1,153
Institutionalized population: 974
Median real estate property taxes paid for housing units with mortgages in 2022: $7,079 (1.0%)
Median real estate property taxes paid for housing units with no mortgage in 2022: $8,026 (1.0%)
| Alexandria city: | 8.1% |
| Virginia: | 10.6% |
Median age of residents in 2022: 38.0 years old
(Males: 36.8 years old, Females: 38.7 years old)
(Median age for: White residents: 40.5 years old, Black residents: 36.2 years old, American Indian residents: 24.8 years old, Asian residents: 37.0 years old, Hispanic or Latino residents: 32.9 years old, Other race residents: 30.0 years old)
Area name: Washington-Arlington-Alexandria, DC-VA-MD HUD Metro FMR Area
Fair market rent in 2006 for a 1-bedroom apartment in Alexandria city is $1080 a month.
Fair market rent for a 2-bedroom apartment is $1225 a month.
Fair market rent for a 3-bedroom apartment is $1580 a month.
Cities in this county include: Alexandria.
Neighboring counties: Mineral County, Nevada  , Clay County, Illinois , Pike County, Ohio , Wayne County, Illinois , Manassas Park city .
| Here: | 2.2% |
| Virginia: | 2.7% |
Current college students: 10,296
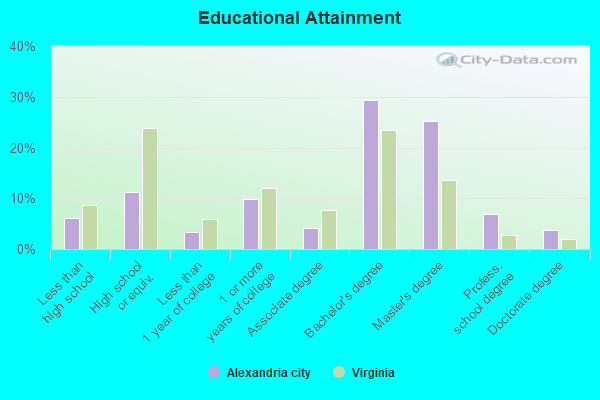
People 25 years of age or older with a high school degree or higher: 94.6%
People 25 years of age or older with a bachelor's degree or higher: 69.9%
Number of foreign born residents: 36,828 (57.3% naturalized citizens)
| Alexandria city: | 23.7% |
| Whole state: | 12.7% |
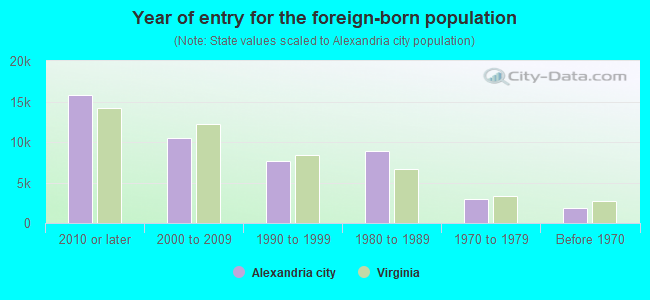
- Year of entry for the foreign-born population
- 15,4092010 or later
- 8,7532000 to 2009
- 5,3961990 to 1999
- 8,8811980 to 1989
- 2,9581970 to 1979
- 1,829Before 1970
Mean travel time to work (commute): minutes
Percentage of county residents living and working in this county: 77.2%
Housing units in structures:
- One, detached: 10,629
- One, attached: 18,647
- Two: 666
- 3 or 4: 2,103
- 5 to 9: 6,061
- 10 to 19: 7,508
- 20 to 49: 4,677
- 50 or more: 29,969
- Mobile homes: 45
- Boats, RVs, vans, etc.: 37
Housing units in Alexandria city with a mortgage: 23,478 (1,972 second mortgage, 111 home equity loan, 1,504 both second mortgage and home equity loan)
Houses without a mortgage: 363
| Here: | 6.0% with mortgage |
| State: | 97.2% with mortgage |
Religion statistics for Alexandria city
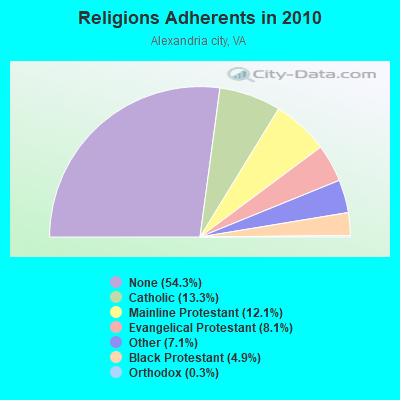
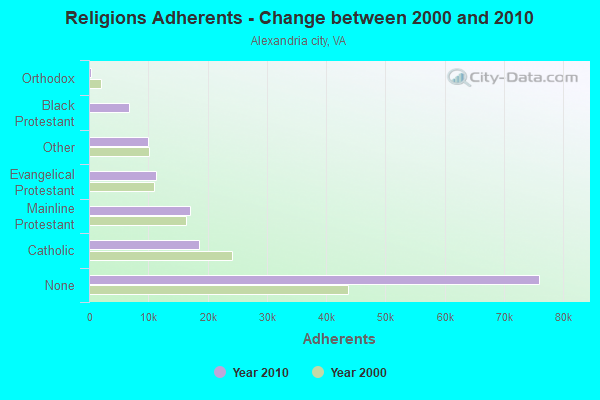
| Religion | Adherents | Congregations |
|---|---|---|
| Catholic | 18,596 | 4 |
| Mainline Protestant | 16,973 | 26 |
| Evangelical Protestant | 11,290 | 33 |
| Other | 9,879 | 18 |
| Black Protestant | 6,813 | 12 |
| Orthodox | 400 | 2 |
| None | 76,015 | - |
Source: Clifford Grammich, Kirk Hadaway, Richard Houseal, Dale E.Jones, Alexei Krindatch, Richie Stanley and Richard H.Taylor. 2012. 2010 U.S.Religion Census: Religious Congregations & Membership Study. Association of Statisticians of American Religious Bodies. Jones, Dale E., et al. 2002. Congregations and Membership in the United States 2000. Nashville, TN: Glenmary Research Center.
Food Environment Statistics:
| Alexandria city: | 2.36 / 10,000 pop. |
| State: | 2.03 / 10,000 pop. |
| Here: | 0.07 / 10,000 pop. |
| Virginia: | 0.17 / 10,000 pop. |
| This county: | 1.36 / 10,000 pop. |
| Virginia: | 1.43 / 10,000 pop. |
| Alexandria city: | 1.50 / 10,000 pop. |
| Virginia: | 4.03 / 10,000 pop. |
| This county: | 10.65 / 10,000 pop. |
| State: | 7.65 / 10,000 pop. |
| Alexandria city: | 7.1% |
| Virginia: | 9.3% |
| Alexandria city: | 21.4% |
| State: | 26.7% |
| Here: | 26.7% |
| State: | 18.6% |
Earthquake activity:
Alexandria city-area historical earthquake activity is significantly above Virginia state average. It is 57% smaller than the overall U.S. average.On 8/23/2011 at 17:51:04, a magnitude 5.8 (5.8 MW, Depth: 3.7 mi, Class: Moderate, Intensity: VI - VII) earthquake occurred 78.3 miles away from Alexandria city center
On 8/25/2011 at 05:07:52, a magnitude 4.5 (4.5 ML, Depth: 4.2 mi, Class: Light, Intensity: IV - V) earthquake occurred 77.3 miles away from the county center
On 12/9/2003 at 20:59:18, a magnitude 4.5 (4.5 ML, Depth: 6.2 mi) earthquake occurred 91.2 miles away from the county center
On 12/9/2003 at 20:59:14, a magnitude 4.5 (4.5 MB, 4.5 LG) earthquake occurred 96.3 miles away from the county center
On 1/16/1994 at 01:49:16, a magnitude 4.6 (4.6 MB, 4.6 LG, Depth: 3.1 mi) earthquake occurred 118.3 miles away from Alexandria city center
On 9/25/1998 at 19:52:52, a magnitude 5.2 (4.8 MB, 4.3 MS, 5.2 LG, 4.5 MW, Depth: 3.1 mi) earthquake occurred 255.1 miles away from the county center
Magnitude types: regional Lg-wave magnitude (LG), body-wave magnitude (MB), local magnitude (ML), surface-wave magnitude (MS), moment magnitude (MW)
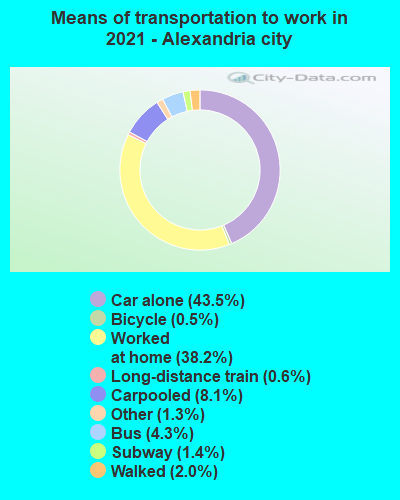
Means of transportation to work:
- Drove a car alone: 56,552 (53.9%)
- Carpooled: 8,333 (7.9%)
- Bus: 3,367 (3.2%)
- Subway or elevated rail: 1,422 (1.4%)
- Long-distance train or commuter rail: 130 (0.1%)
- Ferryboat: 181 (0.2%)
- Taxicab, motorcycle, or other means: 2,483 (2.4%)
- Bicycle: 394 (0.4%)
- Walked: 2,045 (1.9%)
- Worked at home: 30,015 (28.6%)
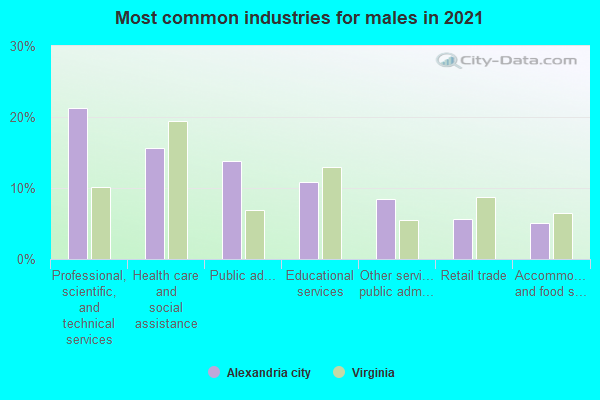
- Professional, scientific, and technical services (23%)
- Public administration (18%)
- Health care and social assistance (11%)
- Educational services (9%)
- Other services, except public administration (9%)
- Administrative and support and waste management services (6%)
- Retail trade (5%)
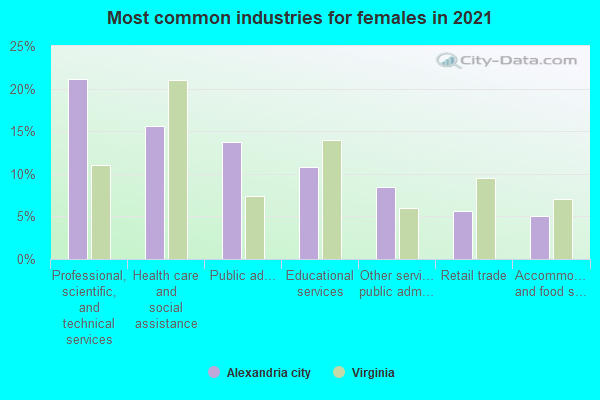
- Professional, scientific, and technical services (23%)
- Public administration (19%)
- Health care and social assistance (12%)
- Educational services (9%)
- Other services, except public administration (9%)
- Administrative and support and waste management services (6%)
- Retail trade (5%)
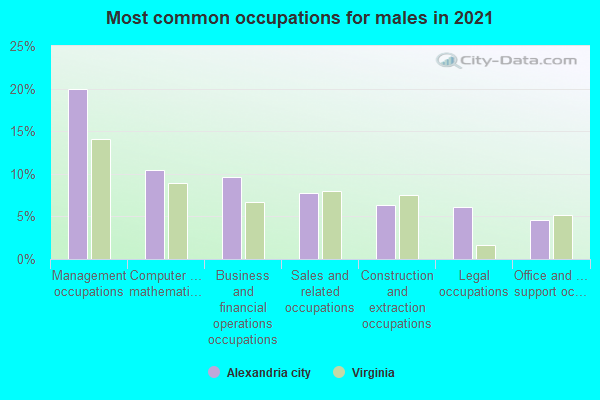
- Management occupations (17%)
- Computer and mathematical occupations (12%)
- Business and financial operations occupations (9%)
- Transportation occupations (8%)
- Office and administrative support occupations (7%)
- Sales and related occupations (7%)
- Legal occupations (6%)
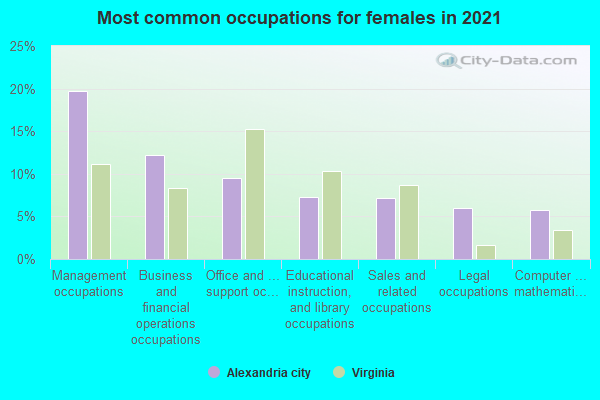
- Business and financial operations occupations (17%)
- Management occupations (15%)
- Office and administrative support occupations (8%)
- Computer and mathematical occupations (8%)
- Educational instruction, and library occupations (6%)
- Sales and related occupations (5%)
- Health diagnosing and treating practitioners and other technical occupations (5%)
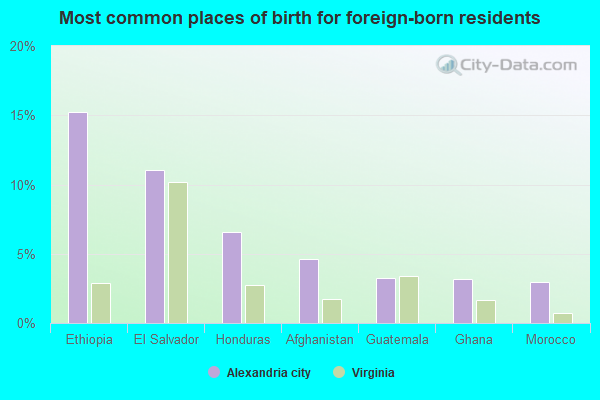
- Ethiopia (14%)
- El Salvador (11%)
- Honduras (6%)
- Afghanistan (6%)
- Guatemala (3%)
- Sudan (3%)
- Philippines (3%)
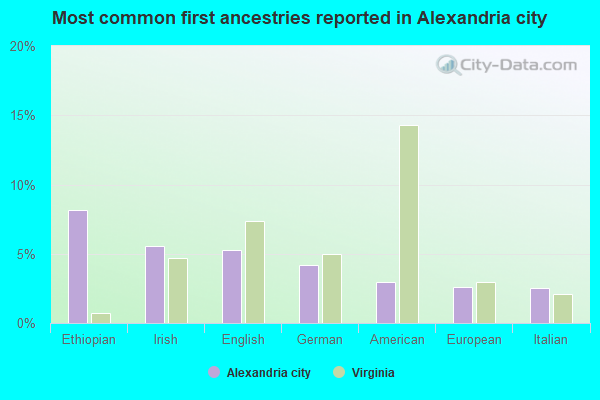
- Ethiopian (8%)
- English (5%)
- Irish (5%)
- German (4%)
- American (3%)
- European (3%)
- Afghan (2%)
People in group quarters in Alexandria city, Virginia in 2010:
- 506 people in nursing facilities/skilled-nursing facilities
- 471 people in college/university student housing
- 400 people in local jails and other municipal confinement facilities
- 223 people in emergency and transitional shelters (with sleeping facilities) for people experiencing homelessness
- 59 people in other noninstitutional facilities
- 55 people in correctional facilities intended for juveniles
- 55 people in group homes intended for adults
- 23 people in residential treatment centers for adults
- 22 people in workers' group living quarters and job corps centers
- 13 people in group homes for juveniles (non-correctional)
People in group quarters in Alexandria city, Virginia in 2000:
- 948 people in nursing homes
- 412 people in local jails and other confinement facilities (including police lockups)
- 251 people in other noninstitutional group quarters
- 62 people in short-term care, detention or diagnostic centers for delinquent children
- 62 people in homes or halfway houses for drug/alcohol abuse
- 61 people in college dormitories (includes college quarters off campus)
- 42 people in homes for the mentally retarded
- 19 people in religious group quarters
- 14 people in other group homes
- 13 people in homes for the mentally ill
- 9 people in wards in general hospitals for patients who have no usual home elsewhere
- 8 people in halfway houses
17.30% of this county's 2021 resident taxpayers lived in other counties in 2020 ($86,170 average adjusted gross income)
| Here: | 17.30% |
| Virginia average: | 10.16% |
0.30% of residents moved from foreign countries ($1,706 average AGI)
Alexandria city: 0.30% Virginia average: 0.12%
7.83% relocated from other counties in Virginia ($36,439 average AGI)
9.17% relocated from other states ($48,024 average AGI)
Alexandria city: 9.17% Virginia average: 3.91%
Top counties from which taxpayers relocated into this county between 2020 and 2021:
| from Fairfax County, VA | |
| from Arlington County, VA | |
| from District of Columbia, DC | |
| from Prince George's County, MD | |
| from Prince William County, VA | |
| from Montgomery County, MD | |
| from Loudoun County, VA |
18.89% of this county's 2020 resident taxpayers moved to other counties in 2021 ($102,876 average adjusted gross income)
| Here: | 18.89% |
| Virginia average: | 10.20% |
0.22% of residents moved to foreign countries ($1,720 average AGI)
Alexandria city: 0.22% Virginia average: 0.09%
9.91% relocated to other counties in Virginia ($48,435 average AGI)
8.75% relocated to other states ($52,722 average AGI)
Alexandria city: 8.75% Virginia average: 3.98%

Top counties to which taxpayers relocated from this county between 2020 and 2021:
| to Fairfax County, VA | |
| to Arlington County, VA | |
| to Prince William County, VA | |
| to District of Columbia, DC | |
| to Prince George's County, MD | |
| to Montgomery County, MD | |
| to Loudoun County, VA |
Births per 1000 population from 1990 to 1999: 17.8
Births per 1000 population from 2000 to 2009: 20.1
Births per 1000 population from 2010 to 2022: 15.0
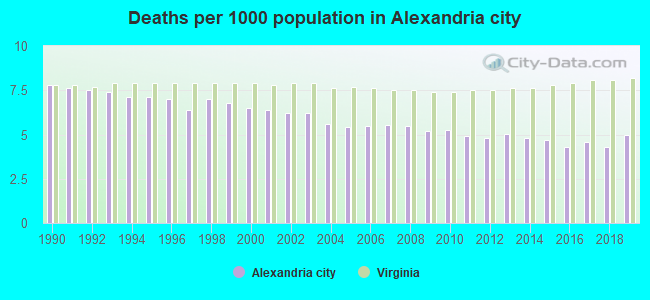
Deaths per 1000 population from 1990 to 1999: 7.2
Deaths per 1000 population from 2000 to 2009: 5.8
Deaths per 1000 population from 2010 to 2020: 4.8
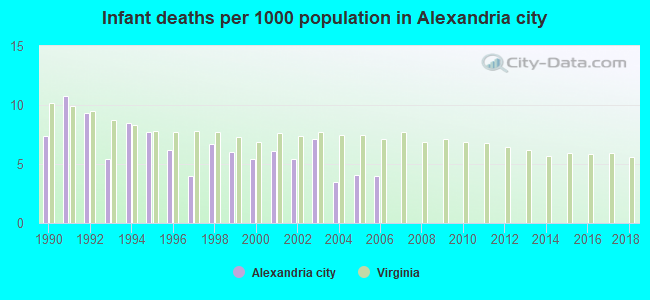
Infant deaths per 1000 live births from 1990 to 1999: 7.2
Infant deaths per 1000 live births from 2000 to 2006: 5.1
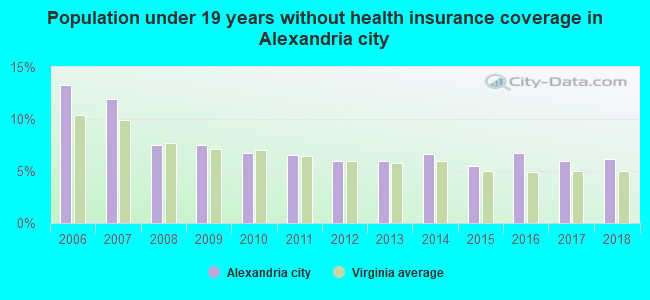
Persons under 19 years old without health insurance coverage in 2018: 6.2%
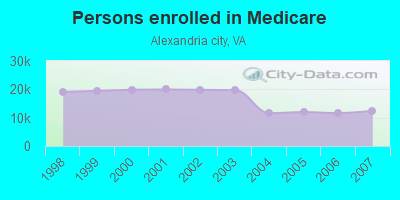
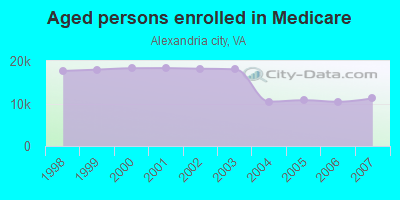
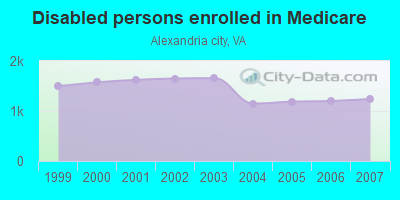
Persons enrolled in hospital insurance and/or supplemental medical insurance (Medicare) in July 1, 2007: 12,453 (11,212 aged, 1,241 disabled)
Children under 18 without health insurance coverage in 2007: 3,348 (11%)
Most common underlying causes of death in Alexandria city, Virginia in 1999 - 2019:
- Bronchus or lung, unspecified - Malignant neoplasms (797)
- Atherosclerotic heart disease (779)
- Acute myocardial infarction, unspecified (665)
- Unspecified dementia (548)
- Septicaemia, unspecified (509)
- Atherosclerotic cardiovascular disease, so described (452)
- Stroke, not specified as haemorrhage or infarction (426)
- Chronic obstructive pulmonary disease, unspecified (420)
- Congestive heart failure (393)
- Alzheimer disease, unspecified (350)
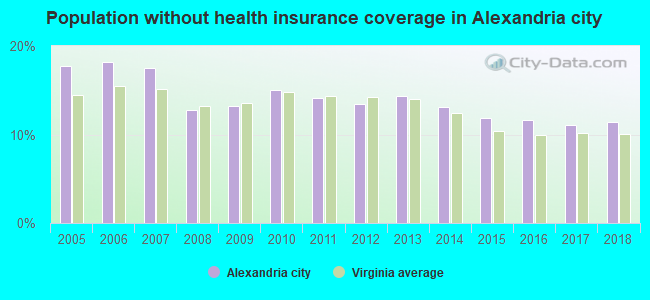
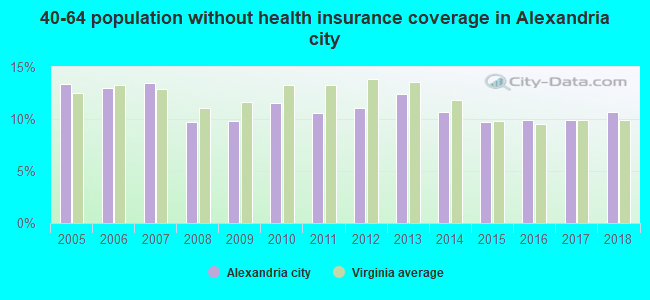
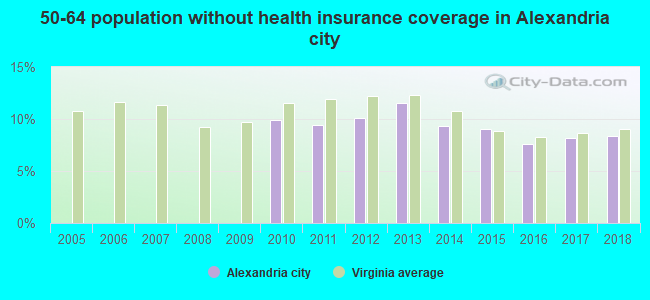
Population without health insurance coverage in 2000: 13%
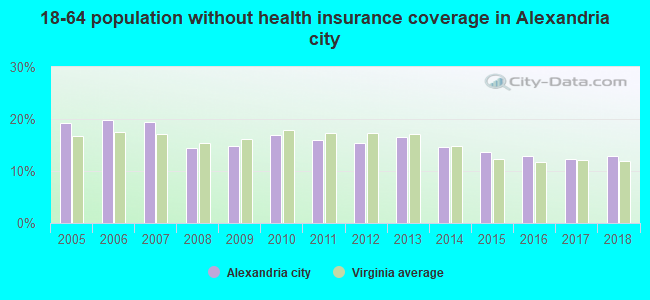
Children under 18 without health insurance coverage in 2000: 14%
Short term general hospital admissions per 100,000 population in 2004: 20,662
Short term general hospital beds per 100,000 population in 2004: 441
Emergency room visits per 100,000 population in 2004: 56,103
General practice office based MDs per 100,000 population in 2005: 1,747
Medical specialist MDs per 100,000 population in 2005: 611
Dentists per 100,000 population in 1998: 7
Total births per 100,000 population, July 2005 - July 2006 : 68
Total deaths per 100,000 population, July 2005 - July 2006: 126
Limited-service eating places per 100,000 population in 2005 : 7
Beer, wine & liquor stores per 100,000 population in 2005: 1
EPA green book nonattainment status in 2004-2006: 1
Homicides per 1,000,000 population from 2000 to 2006: 55.1. This is less than state average.
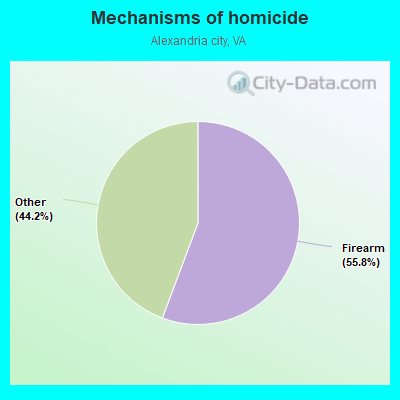
- Firearm - 30.7
- Other - 24.4
Suicides per 1,000,000 population from 2000 to 2006: 83.7. This is less than state average.
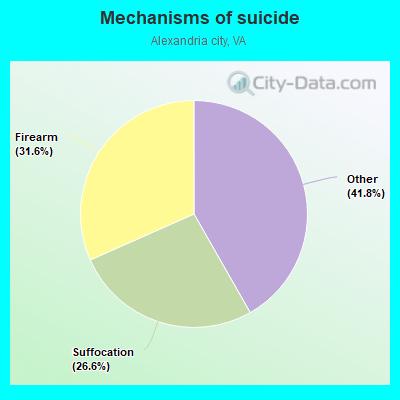
- Firearm - 26.5
- Suffocation - 22.3
- Other - 35.0
Household type by relationship:
Households: 155,525- Male householders: 37,627 (13,165 living alone), Female householders: 39,045 (20,231 living alone)
26,501 spouses (25,966 opposite-sex spouses), 5,632 unmarried partners, (4,814 opposite-sex unmarried partners), 32,116 children (31,486 natural, 255 adopted, 375 stepchildren), 1,342 grandchildren, 1,507 brothers or sisters, 2,374 parents, 0 foster children, 3,432 other relatives, 4,325 non-relatives
- In group quarters: 1,624
Size of family households: 18,866 2-persons, 7,970 3-persons, 5,849 4-persons, 2,430 5-persons, 223 6-persons, 97 7-or-more-persons.
Size of nonfamily households: 33,396 1-person, 7,192 2-persons, 541 3-persons, 59 4-persons, 49 5-persons.
19,275 married couples with children.
7,026 single-parent households (1,426 men, 5,600 women).
69.4% of residents of Alexandria city speak English at home.
12.9% of residents speak Spanish at home (57% speak English very well, 19% speak English well, 16% speak English not well, 8% don't speak English at all).
6.3% of residents speak other Indo-European language at home (72% speak English very well, 19% speak English well, 8% speak English not well, 1% don't speak English at all).
2.9% of residents speak Asian or Pacific Island language at home (76% speak English very well, 19% speak English well, 4% speak English not well, 1% don't speak English at all).
9.1% of residents speak other language at home (63% speak English very well, 27% speak English well, 9% speak English not well, 1% don't speak English at all).
In fiscal year 2004:
Federal Government expenditure: $4,104,864,000 ($32,018 per capita)
Department of Defense expenditure: $2,438,592,000
Federal direct payments to individuals for retirement and disability: $646,989,000
Federal other direct payments to individuals: $162,822,000
Federal direct payments not to individuals: $8,968,000
Federal grants: $242,999,000
Federal procurement contracts: $2,358,698,000 ($1,684,955,000 Department of Defense)
Federal salaries and wages: $684,388,000 ($451,945,000 Department of Defense)
Federal Government direct loans: $4,427,000
Federal guaranteed/insured loans: $71,203,000
Federal Government insurance: $209,998,000
Population change from April 1, 2000 to July 1, 2005:
Births: 13,010| Here: | 96 per 1000 residents |
| State: | 70 per 1000 residents |
Deaths: 4,162
| Here: | 31 per 1000 residents |
| State: | 40 per 1000 residents |
Net international migration: +10,545
| Here: | +78 per 1000 residents |
| State: | +18 per 1000 residents |
Net internal migration: -21,051
| Here: | |
| State: |
Total withdrawal of fresh water for public supply: 0.00 millions of gallons per day (all from surface)
| Here: | 6.1 |
| State: | 7.0 |
| Here: | 3.6 |
| State: | 4.3 |
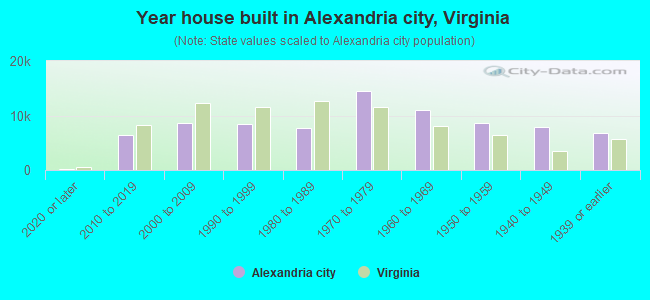
- Year house built in Alexandria city, Virginia
- 8452020 or later
- 9,3122010 to 2019
- 10,0932000 to 2009
- 6,2681990 to 1999
- 9,5511980 to 1989
- 12,1811970 to 1979
- 10,4821960 to 1969
- 7,7361950 to 1959
- 6,1971940 to 1949
- 7,6771939 or earlier
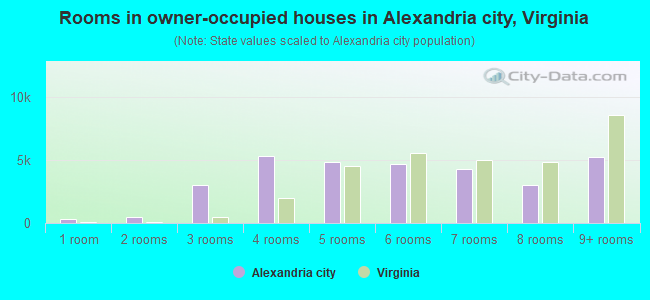
- Rooms in owner-occupied houses in Alexandria city, Virginia
- 1561 room
- 5142 rooms
- 2,5993 rooms
- 4,2634 rooms
- 4,0275 rooms
- 6,3386 rooms
- 3,0257 rooms
- 4,0718 rooms
- 5,5099+ rooms
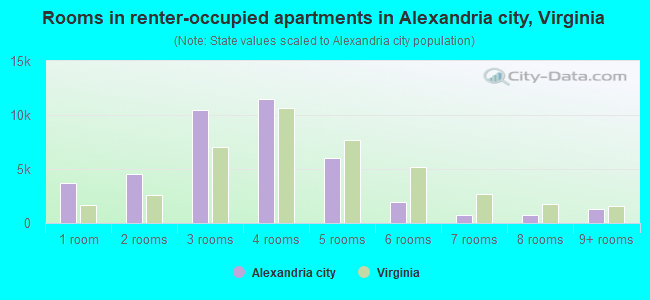
- Rooms in renter-occupied apartments in Alexandria city, Virginia
- 4,7981 room
- 5,6832 rooms
- 11,7383 rooms
- 13,6394 rooms
- 5,5785 rooms
- 2,3276 rooms
- 1,4217 rooms
- 5708 rooms
- 4169+ rooms
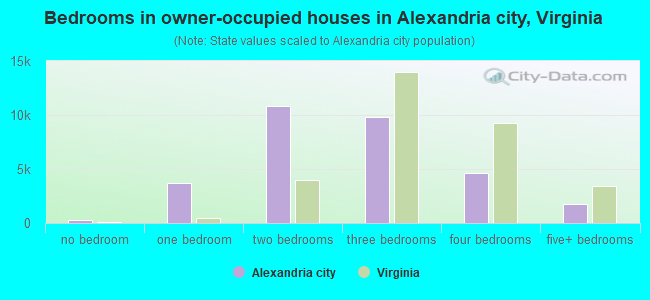
- Bedrooms in owner-occupied houses in Alexandria city, Virginia
- 275no bedroom
- 3,2701 bedroom
- 8,3332 bedrooms
- 12,1113 bedrooms
- 4,8634 bedrooms
- 1,6505+ bedrooms
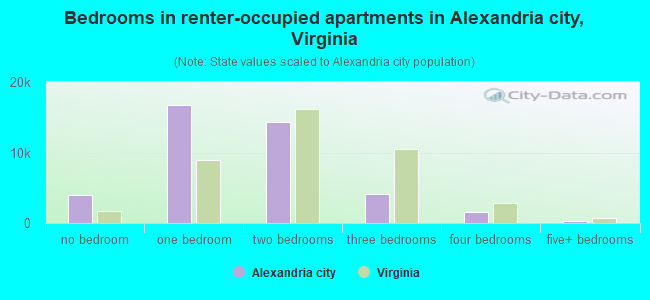
- Bedrooms in renter-occupied apartments in Alexandria city, Virginia
- 5,365no bedroom
- 17,3671 bedroom
- 17,5762 bedrooms
- 4,6853 bedrooms
- 1,0714 bedrooms
- 1065+ bedrooms
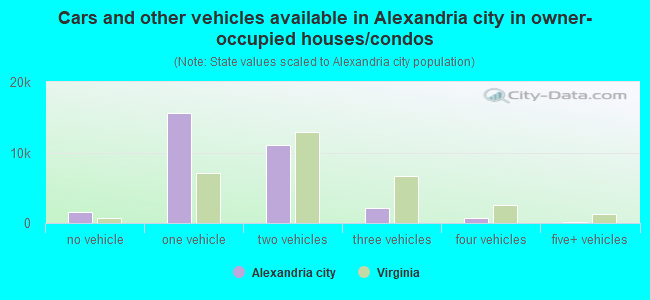
- Cars and other vehicles available in Alexandria city in owner-occupied houses/condos
- 1,142no vehicle
- 14,1111 vehicle
- 13,1762 vehicles
- 1,7523 vehicles
- 2694 vehicles
- 525+ vehicles
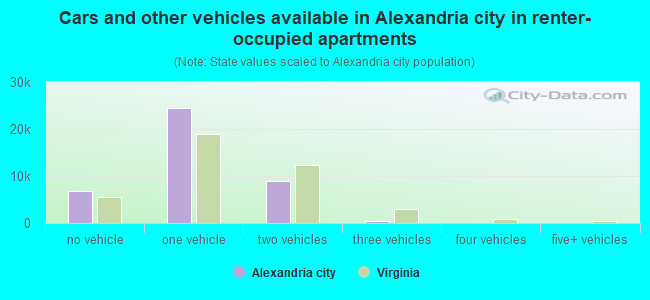
- Cars and other vehicles available in Alexandria city in renter-occupied apartments
- 6,263no vehicle
- 27,5911 vehicle
- 9,2042 vehicles
- 2,1783 vehicles
- 7384 vehicles
- 1965+ vehicles
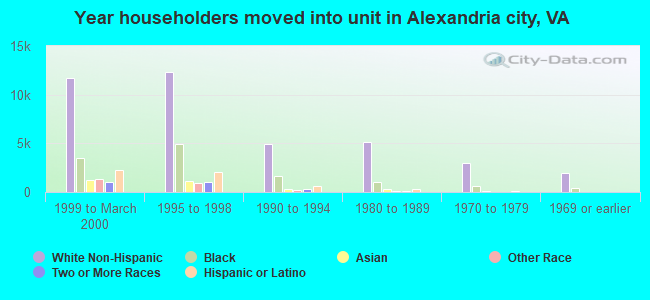
82.8% of Alexandria city residents lived in the same house 1 years ago.
Out of people who lived in different houses, 22% lived in this county.
Out of people who lived in different counties, 47% lived in Virginia.
| Alexandria city: | 82.8% |
| State average: | 86.6% |
Place of birth for U.S.-born residents:
- This state: 37,530
- Other state: 78,293
- Northeast: 24,400
- Midwest: 15,193
- South: 29,579
- West: 9,121
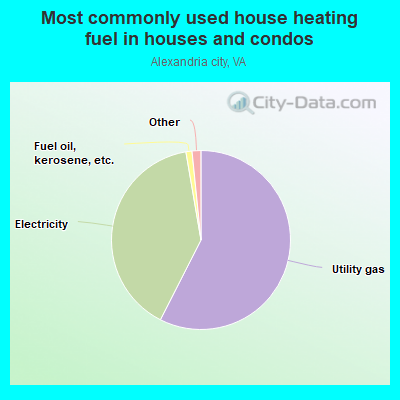
- 57.2%Utility gas
- 40.2%Electricity
- 1.0%Fuel oil, kerosene, etc.
- 0.5%Bottled, tank, or LP gas
- 0.5%Other fuel
- 0.4%No fuel used
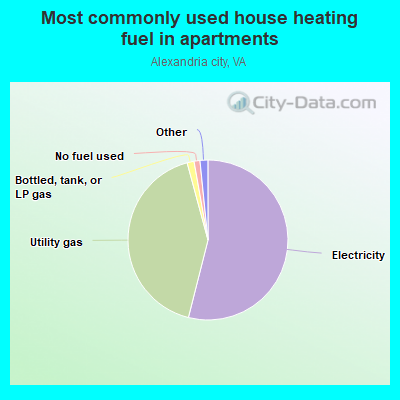
- 55.9%Electricity
- 40.6%Utility gas
- 1.5%Bottled, tank, or LP gas
- 0.8%No fuel used
- 0.7%Other fuel
- 0.4%Fuel oil, kerosene, etc.
Private vs. public school enrollment:
| Here: | 18.8% |
| Virginia: | 13.2% |
| Here: | 12.2% |
| Virginia: | 10.2% |
| Here: | 24.5% |
| Virginia: | 18.7% |
Supplemental Security Income (SSI) in 2004:
- Total number of recipients: 2,025
- Number of aged recipients: 673
- Number of blind and disabled recipients: 1,352
- Number of recipients under 18: 194
- Number of recipients between 18 and 64: 893
- Number of recipients older than 64: 938
- Number of recipients also receiving OASDI: 543
- Amount of payments (thousands of dollars): 866
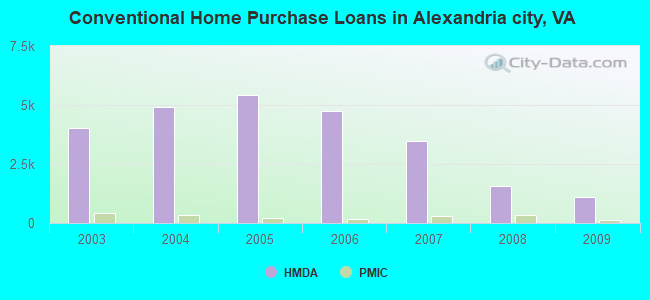
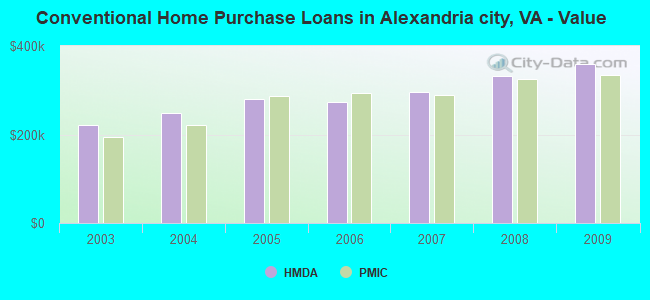
| Home Mortgage Disclosure Act Aggregated Statistics For Year 2009 (Based on 32 full tracts) | ||||||||||||||
| A) FHA, FSA/RHS & VA Home Purchase Loans | B) Conventional Home Purchase Loans | C) Refinancings | D) Home Improvement Loans | E) Loans on Dwellings For 5+ Families | F) Non-occupant Loans on < 5 Family Dwellings (A B C & D) | G) Loans On Manufactured Home Dwelling (A B C & D) | ||||||||
|---|---|---|---|---|---|---|---|---|---|---|---|---|---|---|
| Number | Average Value | Number | Average Value | Number | Average Value | Number | Average Value | Number | Average Value | Number | Average Value | Number | Average Value | |
| LOANS ORIGINATED | 835 | $355,710 | 1,097 | $359,179 | 4,150 | $341,400 | 140 | $216,500 | 5 | $16,533,800 | 343 | $267,289 | 0 | $0 |
| APPLICATIONS APPROVED, NOT ACCEPTED | 29 | $305,724 | 49 | $372,041 | 308 | $346,045 | 21 | $98,095 | 0 | $0 | 32 | $310,969 | 2 | $36,500 |
| APPLICATIONS DENIED | 48 | $286,854 | 80 | $318,900 | 968 | $335,897 | 56 | $143,589 | 0 | $0 | 121 | $251,959 | 0 | $0 |
| APPLICATIONS WITHDRAWN | 93 | $299,613 | 143 | $305,462 | 862 | $346,551 | 19 | $152,105 | 1 | $20,000,000 | 81 | $278,358 | 0 | $0 |
| FILES CLOSED FOR INCOMPLETENESS | 11 | $392,364 | 18 | $394,889 | 186 | $308,441 | 8 | $142,500 | 0 | $0 | 25 | $244,800 | 1 | $370,000 |
| Private Mortgage Insurance Companies Aggregated Statistics For Year 2009 (Based on 28 full tracts) | ||||||
| A) Conventional Home Purchase Loans | B) Refinancings | C) Non-occupant Loans on < 5 Family Dwellings (A & B) | ||||
|---|---|---|---|---|---|---|
| Number | Average Value | Number | Average Value | Number | Average Value | |
| LOANS ORIGINATED | 148 | $335,297 | 74 | $379,000 | 3 | $250,667 |
| APPLICATIONS APPROVED, NOT ACCEPTED | 32 | $347,281 | 27 | $381,481 | 1 | $153,000 |
| APPLICATIONS DENIED | 21 | $292,190 | 15 | $387,533 | 0 | $0 |
| APPLICATIONS WITHDRAWN | 8 | $259,625 | 7 | $337,429 | 0 | $0 |
| FILES CLOSED FOR INCOMPLETENESS | 8 | $255,375 | 2 | $328,500 | 0 | $0 |
| Most common first names in Alexandria city, VA among deceased individuals | ||
| Name | Count | Lived (average) |
|---|---|---|
| John | 1,326 | 72.5 years |
| Mary | 1,323 | 78.8 years |
| William | 1,140 | 73.6 years |
| James | 1,033 | 70.3 years |
| Robert | 853 | 70.3 years |
| Charles | 709 | 73.1 years |
| Margaret | 639 | 79.7 years |
| George | 578 | 74.1 years |
| Helen | 563 | 80.4 years |
| Elizabeth | 503 | 79.7 years |
| Most common last names in Alexandria city, VA among deceased individuals | ||
| Last name | Count | Lived (average) |
|---|---|---|
| Smith | 473 | 74.2 years |
| Johnson | 317 | 73.2 years |
| Jones | 277 | 71.5 years |
| Brown | 267 | 73.6 years |
| Williams | 255 | 73.0 years |
| Davis | 238 | 74.3 years |
| Miller | 234 | 75.0 years |
| Taylor | 173 | 75.8 years |
| Jackson | 165 | 72.3 years |
| Moore | 164 | 73.0 years |
| Businesses in Alexandria city, VA | ||||
| Name | Count | Name | Count | |
|---|---|---|---|---|
| 7-Eleven | 20 | Just Tires | 1 | |
| AT&T | 5 | KFC | 1 | |
| Ace Hardware | 1 | Kroger | 1 | |
| Advance Auto Parts | 1 | LA Fitness | 1 | |
| Ann Taylor | 2 | Lane Furniture | 1 | |
| Arby's | 1 | LensCrafters | 1 | |
| AutoZone | 2 | Macy's | 1 | |
| BMW | 1 | Marriott | 4 | |
| Baja Fresh Mexican Grill | 1 | Marshalls | 1 | |
| Bally Total Fitness | 1 | MasterBrand Cabinets | 22 | |
| Banana Republic | 1 | McDonald's | 8 | |
| Barnes & Noble | 1 | Men's Wearhouse | 1 | |
| Baskin-Robbins | 4 | Motherhood Maternity | 1 | |
| Bath & Body Works | 1 | New Balance | 2 | |
| Ben & Jerry's | 1 | New York & Co | 1 | |
| Best Western | 2 | Nike | 7 | |
| Blockbuster | 2 | Nissan | 1 | |
| Budget Car Rental | 2 | Old Navy | 1 | |
| CVS | 9 | Panera Bread | 2 | |
| Caribou Coffee | 1 | Papa John's Pizza | 2 | |
| Casual Male XL | 1 | Payless | 2 | |
| Chevrolet | 1 | Penske | 1 | |
| Chick-Fil-A | 1 | PetSmart | 1 | |
| Chico's | 1 | Pier 1 Imports | 2 | |
| Chipotle | 1 | Pizza Hut | 3 | |
| Cold Stone Creamery | 1 | Popeyes | 3 | |
| Comfort Inn | 2 | Quiznos | 4 | |
| Crate & Barrel | 1 | RadioShack | 2 | |
| Cricket Wireless | 7 | Red Lobster | 1 | |
| Curves | 1 | Rite Aid | 2 | |
| DHL | 2 | Ruby Tuesday | 1 | |
| Dairy Queen | 1 | Safeway | 3 | |
| Days Inn | 1 | Sears | 3 | |
| Decora Cabinetry | 8 | Sheraton | 1 | |
| Domino's Pizza | 4 | Sprint Nextel | 2 | |
| DressBarn | 2 | Staples | 3 | |
| Dressbarn | 2 | Starbucks | 12 | |
| Dunkin Donuts | 5 | T-Mobile | 4 | |
| Extended Stay America | 1 | T.G.I. Driday's | 1 | |
| FedEx | 49 | T.J.Maxx | 1 | |
| Finish Line | 1 | Taco Bell | 1 | |
| Foot Locker | 1 | Talbots | 1 | |
| Ford | 1 | Target | 1 | |
| GNC | 4 | Toyota | 1 | |
| GameStop | 2 | Trader Joe's | 1 | |
| Gap | 1 | Travelodge | 1 | |
| Giant | 5 | True Value | 1 | |
| H&R Block | 4 | U-Haul | 4 | |
| Hawthorn | 1 | UPS | 51 | |
| Hilton | 7 | Verizon Wireless | 2 | |
| Holiday Inn | 3 | Victoria's Secret | 1 | |
| Home Depot | 2 | Volkswagen | 1 | |
| Homestead Studio Suites | 1 | Vons | 3 | |
| Honda | 1 | Walgreens | 1 | |
| Hyundai | 1 | Wendy's | 2 | |
| IHOP | 2 | Westin | 1 | |
| JoS. A. Bank | 1 | Whole Foods Market | 1 | |
| Johnny Rockets | 1 | YMCA | 1 | |
| Jones New York | 3 | |||
Alexandria city on our top lists:
- #2 on the list of "Top 101 counties with the highest percentage of residents relocating from other counties between 2010 and 2011 (pop. 50,000+)"
- #6 on the list of "Top 101 counties with the highest percentage of residents relocating to other counties in 2011 (pop. 50,000+)"
- #6 on the list of "Top 101 counties with the highest number of births per 1000 residents 2007-2013"
- #6 on the list of "Top 101 counties with the highest number of births per 1000 residents 2007-2013 (pop 50,000+)"
- #10 on the list of "Top 101 counties with the highest percentage of residents relocating from other counties between 2010 and 2011"
- #15 on the list of "Top 101 counties with the highest percentage of residents relocating to other counties in 2011"
- #15 on the list of "Top 101 counties with the largest decrease in the number of deaths per 1000 residents 2000-2006 to 2007-2013 (pop. 50,000+)"
- #18 on the list of "Top 101 counties with the largest number of people without health insurance coverage in 2000 (pop. 50,000+)"
- #41 on the list of "Top 101 counties with the lowest number of deaths per 1000 residents 2007-2013 (pop. 50,000+)"
- #42 on the list of "Top 101 counties with the lowest Particulate Matter (PM10) Annual air pollution readings in 2012 (µg/m3)"
- #43 on the list of "Top 101 counties with highest percentage of residents voting for Obama (Democrat) in the 2012 Presidential Election (pop. 50,000+)"
- #47 on the list of "Top 101 counties with the highest percentage of residents relocating to foreign countries in 2011 (pop. 50,000+)"
- #49 on the list of "Top 101 counties with the highest percentage of residents relocating from foreign countries between 2010 and 2011 (pop. 50,000+)"
- #66 on the list of "Top 101 counties with the largest increase in the number of births per 1000 residents 2000-2006 to 2007-2013 (pop 50,000+)"
- #70 on the list of "Top 101 counties with the highest percentage of residents relocating to foreign countries in 2011"
- #71 on the list of "Top 101 counties with the highest percentage of residents relocating from foreign countries between 2010 and 2011"
- #82 on the list of "Top 101 counties with highest percentage of residents voting for Obama (Democrat) in the 2012 Presidential Election"
- #91 on the list of "Top 101 counties with the lowest Sulfur Oxides Annual air pollution readings in 2012 (µg/m3)"
- #97 on the list of "Top 101 counties with the largest number of children under 18 without health insurance coverage in 2000 (pop. 50,000+)"