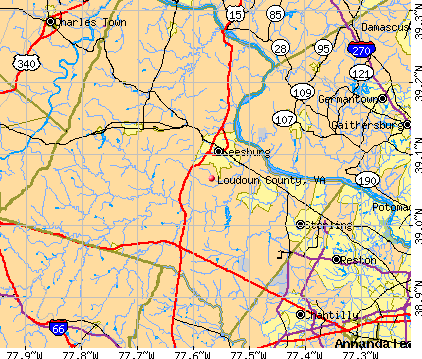
Loudoun County, Virginia (VA)
County owner-occupied free and clear houses and condos in 2010: 6,566
County owner-occupied houses and condos in 2000: 47,588
Renter-occupied apartments: 23,199 (it was 12,312 in 2000)
| % of renters here: | 21% |
| State: | 33% |
Land area: 520 sq. mi.
Water area: 1.2 sq. mi.
Population density: 831 people per square mile (very high).
Industries providing employment: Professional, scientific, management, administrative, and waste management services (29.1%), Educational, health and social services (16.7%).
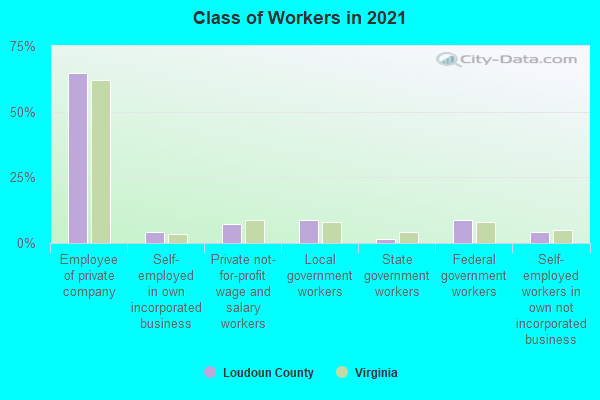
Type of workers:
- Private wage or salary: 78%
- Government: 17%
- Self-employed, not incorporated: 5%
- Unpaid family work: 0%
- OSM Map
- General Map
- Google Map
- MSN Map

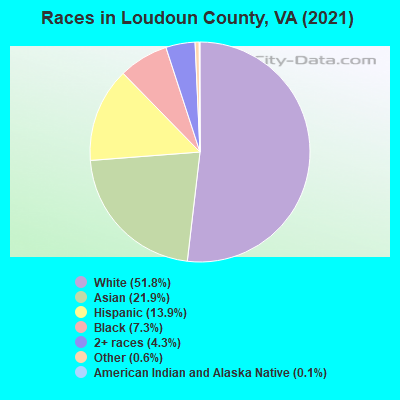
- 220,77651.1%White Non-Hispanic Alone
- 96,57222.4%Asian alone
- 60,29914.0%Hispanic or Latino
- 32,3567.5%Black Non-Hispanic Alone
- 18,6134.3%Two or more races
- 2,7740.6%Some other race alone
- 4580.1%American Indian and Alaska Native alone
- 2370.05%Native Hawaiian and Other
Pacific Islander alone
| Median resident age: | 38.1 years |
| Virginia median age: | 39.0 years |
| Males: 216,846 | |
| Females: 215,239 |

 | Moving to Loudoun County -- looking for advice (11 replies) |
| New Lifestyle Development in Loudoun County (21 replies) |
| How is life in Fairfax/Loudoun County for a single guy? (19 replies) |
| Alternatives to Loudoun County? (12 replies) |
| RD (General) Loudoun County Advice/Opinions (22 replies) |
| Given speeding ticket for 65/55mph on Loudoun County PKW (19 replies) |
| Loudoun County: | 2.0 people |
| Virginia: | 3 people |
Estimated median household income in 2022: $167,531 ($80,648 in 1999)
| This county: | $167,531 |
| Virginia: | $85,873 |
Median contract rent in 2022 for apartments: $2,014 (lower quartile is $1,643, upper quartile is $2,462)
| This county: | $2014 |
| State: | $1270 |
Estimated median house or condo value in 2022: $714,500 (it was $202,300 in 2000)
| Loudoun: | $714,500 |
| Virginia: | $365,700 |
Mean price in 2022:
Median monthly housing costs for homes and condos with a mortgage: $2,970Detached houses: $820,290
Here: $820,290 State: $472,865 Townhouses or other attached units: $557,606
Here: $557,606 State: $457,437 In 2-unit structures: $628,429
Here: $628,429 State: $396,289 In 3-to-4-unit structures: $354,051
Here: $354,051 State: $252,346 In 5-or-more-unit structures: $384,035
Here: $384,035 State: $382,551 Mobile homes: $163,835
Here: $163,835 State: $100,736
Median monthly housing costs for units without a mortgage: $861
Institutionalized population: 586
Crime in 2021 (reported by the sheriff's office or county police, not the county total):
- Murders: 3
- Rapes: 127
- Robberies: 26
- Assaults: 115
- Burglaries: 132
- Thefts: 1667
- Auto thefts: 138
Crime in 2020 (reported by the sheriff's office or county police, not the county total):
- Murders: 1
- Rapes: 127
- Robberies: 32
- Assaults: 148
- Burglaries: 152
- Thefts: 1826
- Auto thefts: 144
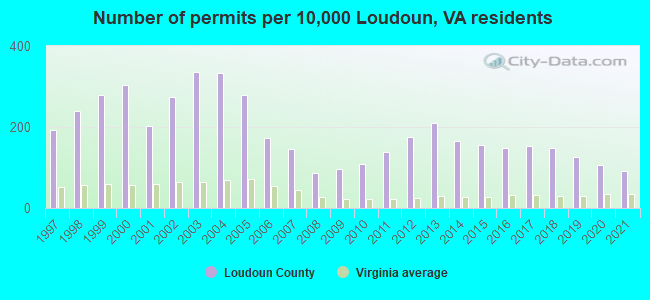
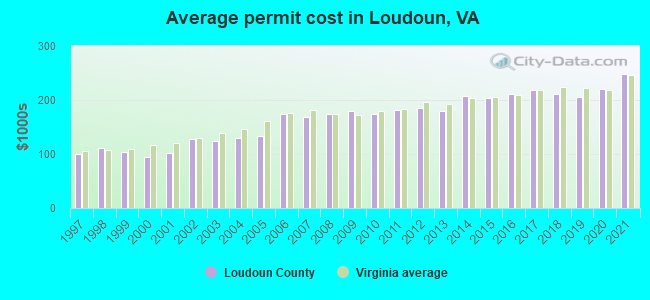
Single-family new house construction building permits:
- 2022: 1257 buildings, average cost: $250,300
- 2021: 1543 buildings, average cost: $248,500
- 2020: 1819 buildings, average cost: $220,400
- 2019: 2137 buildings, average cost: $206,100
- 2018: 2511 buildings, average cost: $211,700
- 2017: 2588 buildings, average cost: $218,600
- 2016: 2522 buildings, average cost: $210,900
- 2015: 2635 buildings, average cost: $202,800
- 2014: 2823 buildings, average cost: $207,300
- 2013: 3545 buildings, average cost: $180,000
- 2012: 2980 buildings, average cost: $186,300
- 2011: 2350 buildings, average cost: $182,100
- 2010: 1840 buildings, average cost: $175,100
- 2009: 1638 buildings, average cost: $179,400
- 2008: 1468 buildings, average cost: $173,800
- 2007: 2479 buildings, average cost: $168,400
- 2006: 2937 buildings, average cost: $173,700
- 2005: 4716 buildings, average cost: $133,500
- 2004: 5667 buildings, average cost: $129,000
- 2003: 5678 buildings, average cost: $123,600
- 2002: 4659 buildings, average cost: $128,200
- 2001: 3436 buildings, average cost: $101,700
- 2000: 5131 buildings, average cost: $93,900
- 1999: 4757 buildings, average cost: $103,900
- 1998: 4047 buildings, average cost: $112,400
- 1997: 3264 buildings, average cost: $100,100
Median real estate property taxes paid for housing units with mortgages in 2022: $5,846 (0.8%)
Median real estate property taxes paid for housing units with no mortgage in 2022: $5,224 (0.8%)

| Loudoun County: | 3.7% |
| Virginia: | 10.6% |
Median age of residents in 2022: 38.1 years old
(Males: 37.9 years old, Females: 38.3 years old)
(Median age for: White residents: 41.0 years old, Black residents: 41.4 years old, American Indian residents: 49.9 years old, Asian residents: 38.2 years old, Hispanic or Latino residents: 31.6 years old, Other race residents: 29.6 years old)
Area name: Washington-Arlington-Alexandria, DC-VA-MD HUD Metro FMR Area
Fair market rent in 2006 for a 1-bedroom apartment in Loudoun County is $1080 a month.
Fair market rent for a 2-bedroom apartment is $1225 a month.
Fair market rent for a 3-bedroom apartment is $1580 a month.
Cities in this county include: Ashburn, Leesburg, Sterling, South Riding, Broadlands, Cascades, Sugarland Run, Lansdowne, Lowes Island, Countryside.
2023 air pollution in Loudoun County:
Nitrogen Dioxide: 0.01 ppm (standard limit: 0.053 ppm). Above U.S. average.
Ozone (1-hour): 0.032 ppm (standard limit: 0.12 ppm). Near U.S. average.
Neighboring counties: Brown County, Ohio  , Douglas County, Kansas , Franklin County, Indiana , Marion County, West Virginia , Upshur County, West Virginia , Susquehanna County, Pennsylvania
  , Ottawa County, Kansas , Trimble County, Kentucky .
| Here: | 2.4% |
| Virginia: | 2.7% |
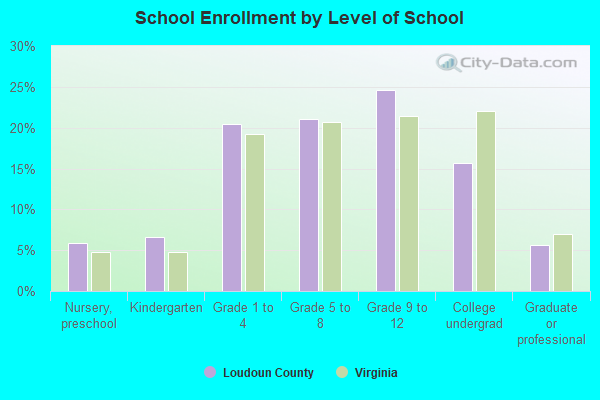
Current college students: 8,012
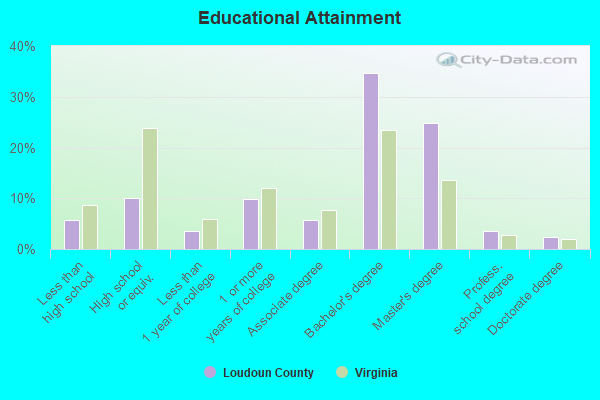
People 25 years of age or older with a high school degree or higher: 95.1%
People 25 years of age or older with a bachelor's degree or higher: 64.6%
Number of foreign born residents: 117,611 (65.7% naturalized citizens)
| Loudoun County: | 27.2% |
| Whole state: | 12.7% |
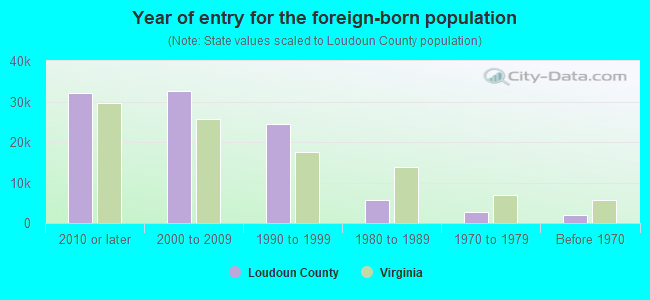
- Year of entry for the foreign-born population
- 37,5422010 or later
- 33,6332000 to 2009
- 25,2811990 to 1999
- 5,6751980 to 1989
- 2,7001970 to 1979
- 1,917Before 1970
Mean travel time to work (commute): minutes
Percentage of county residents living and working in this county: 93.6%
Housing units in structures:
- One, detached: 76,401
- One, attached: 44,162
- Two: 523
- 3 or 4: 1,078
- 5 to 9: 2,692
- 10 to 19: 10,256
- 20 to 49: 3,227
- 50 or more: 8,324
- Mobile homes: 355
- Boats, RVs, vans, etc.: 59
Housing units in Loudoun County with a mortgage: 91,718 (10,305 second mortgage, 286 home equity loan, 8,230 both second mortgage and home equity loan)
Houses without a mortgage: 2,139
| Here: | 97.8% with mortgage |
| State: | 97.2% with mortgage |
Religion statistics for Loudoun County
| Religion | Adherents | Congregations |
|---|---|---|
| Catholic | 45,687 | 6 |
| Other | 34,241 | 31 |
| Mainline Protestant | 22,080 | 51 |
| Evangelical Protestant | 17,314 | 84 |
| Orthodox | 300 | 2 |
| Black Protestant | 199 | 2 |
| None | 192,490 | - |
Source: Clifford Grammich, Kirk Hadaway, Richard Houseal, Dale E.Jones, Alexei Krindatch, Richie Stanley and Richard H.Taylor. 2012. 2010 U.S.Religion Census: Religious Congregations & Membership Study. Association of Statisticians of American Religious Bodies. Jones, Dale E., et al. 2002. Congregations and Membership in the United States 2000. Nashville, TN: Glenmary Research Center.
Food Environment Statistics:
| Loudoun County: | 1.73 / 10,000 pop. |
| State: | 2.03 / 10,000 pop. |
| Here: | 0.11 / 10,000 pop. |
| Virginia: | 0.17 / 10,000 pop. |
| This county: | 1.01 / 10,000 pop. |
| Virginia: | 1.43 / 10,000 pop. |
| Loudoun County: | 1.87 / 10,000 pop. |
| Virginia: | 4.03 / 10,000 pop. |
| This county: | 6.81 / 10,000 pop. |
| State: | 7.65 / 10,000 pop. |
| Loudoun County: | 6.0% |
| Virginia: | 9.3% |
| Loudoun County: | 23.0% |
| State: | 26.7% |
| Here: | 19.2% |
| State: | 18.6% |
Agriculture in Loudoun County:
Average size of farms: 109 acresAverage value of agricultural products sold per farm: $25,515
Average value of crops sold per acre for harvested cropland: $296.15
The value of nursery, greenhouse, floriculture, and sod as a percentage of the total market value of agricultural products sold: 26.64%
The value of livestock, poultry, and their products as a percentage of the total market value of agricultural products sold: 50.62%
Average total farm production expenses per farm: $29,075
Harvested cropland as a percentage of land in farms: 39.14%
Irrigated harvested cropland as a percentage of land in farms: 5.60%
Average market value of all machinery and equipment per farm: $38,864
The percentage of farms operated by a family or individual: 87.86%
Average age of principal farm operators: 56 years
Average number of cattle and calves per 100 acres of all land in farms: 15.02
Milk cows as a percentage of all cattle and calves: 1.79%
Corn for grain: 6031 harvested acres
All wheat for grain: 2536 harvested acres
Soybeans for beans: 4984 harvested acres
Vegetables: 233 harvested acres
Land in orchards: 675 acres
Earthquake activity:
Loudoun County-area historical earthquake activity is significantly above Virginia state average. It is 54% smaller than the overall U.S. average.On 8/23/2011 at 17:51:04, a magnitude 5.8 (5.8 MW, Depth: 3.7 mi, Class: Moderate, Intensity: VI - VII) earthquake occurred 82.3 miles away from Loudoun County center
On 8/25/2011 at 05:07:52, a magnitude 4.5 (4.5 ML, Depth: 4.2 mi, Class: Light, Intensity: IV - V) earthquake occurred 80.3 miles away from the county center
On 9/25/1998 at 19:52:52, a magnitude 5.2 (4.8 MB, 4.3 MS, 5.2 LG, 4.5 MW, Depth: 3.1 mi) earthquake occurred 224.5 miles away from the county center
On 12/9/2003 at 20:59:18, a magnitude 4.5 (4.5 ML, Depth: 6.2 mi) earthquake occurred 93.8 miles away from the county center
On 1/16/1994 at 01:49:16, a magnitude 4.6 (4.6 MB, 4.6 LG, Depth: 3.1 mi) earthquake occurred 119.6 miles away from Loudoun County center
On 12/9/2003 at 20:59:14, a magnitude 4.5 (4.5 MB, 4.5 LG) earthquake occurred 103.8 miles away from the county center
Magnitude types: regional Lg-wave magnitude (LG), body-wave magnitude (MB), local magnitude (ML), surface-wave magnitude (MS), moment magnitude (MW)
Most recent natural disasters:
- Virginia Covid-19 Pandemic, Incident Period: January 20, 2020, Major Disaster (Presidential) Declared DR-4512-VA: April 2, 2020, FEMA Id: 4512, Natural disaster type: Other
- Virginia Severe Winter Storm And Snowstorm, Incident Period: January 22, 2016 to January 23, 2016, Major Disaster (Presidential) Declared DR-4262: March 07, 2016, FEMA Id: 4262, Natural disaster type: Snowstorm, Winter Storm
- Virginia Hurricane Sandy, Incident Period: October 26, 2012 to November 01, 2012, Emergency Declared EM-3359: October 29, 2012, FEMA Id: 3359, Natural disaster type: Hurricane
- Virginia Severe Winter Storms and Snowstorms, Incident Period: February 05, 2010 to February 11, 2010, Major Disaster (Presidential) Declared DR-1905: April 27, 2010, FEMA Id: 1905, Natural disaster type: Snowstorm, Winter Storm
- Virginia Hurricane Katrina Evacuation, Incident Period: August 29, 2005 to October 01, 2005, Emergency Declared EM-3240: September 12, 2005, FEMA Id: 3240, Natural disaster type: Hurricane
- Virginia Hurricane Isabel, Incident Period: September 18, 2003 to October 01, 2003, Major Disaster (Presidential) Declared DR-1491: September 18, 2003, FEMA Id: 1491, Natural disaster type: Hurricane
- Virginia Winter Storm, Incident Period: January 25, 2000 to January 30, 2000, Major Disaster (Presidential) Declared DR-1318: February 28, 2000, FEMA Id: 1318, Natural disaster type: Winter Storm
- Virginia Severe Flooding, Incident Period: January 19, 1996 to February 01, 1996, Major Disaster (Presidential) Declared DR-1098: January 27, 1996, FEMA Id: 1098, Natural disaster type: Flood
- Virginia Blizzard, Incident Period: January 06, 1996 to January 12, 1996, Major Disaster (Presidential) Declared DR-1086: January 13, 1996, FEMA Id: 1086, Natural disaster type: Blizzard
- Virginia Severe Winter Storm, Incident Period: March 13, 1993 to March 14, 1993, Emergency Declared EM-3112: March 25, 1993, FEMA Id: 3112, Natural disaster type: Winter Storm
- 1 other natural disasters have been reported since 1953.
The number of natural disasters in Loudoun County (11) is smaller than the US average (15).
Major Disasters (Presidential) Declared: 8
Emergencies Declared: 3
Causes of natural disasters: Winter Storms: 4, Hurricanes: 3, Snowstorms: 2, Blizzard: 1, Flood: 1, Tropical Storm: 1, Other: 1 (Note: some incidents may be assigned to more than one category).
Means of transportation to work:
- Drove a car alone: 140,124 (59.3%)
- Carpooled: 15,906 (6.7%)
- Bus: 841 (0.4%)
- Subway or elevated rail: 108 (0.0%)
- Long-distance train or commuter rail: 170 (0.1%)
- Taxicab, motorcycle, or other means: 3,550 (1.5%)
- Bicycle: 825 (0.3%)
- Walked: 3,805 (1.6%)
- Worked at home: 71,123 (30.1%)

- Professional, scientific, and technical services (17%)
- Educational services (12%)
- Health care and social assistance (11%)
- Retail trade (7%)
- Public administration (6%)
- Other services, except public administration (5%)
- Accommodation and food services (4%)
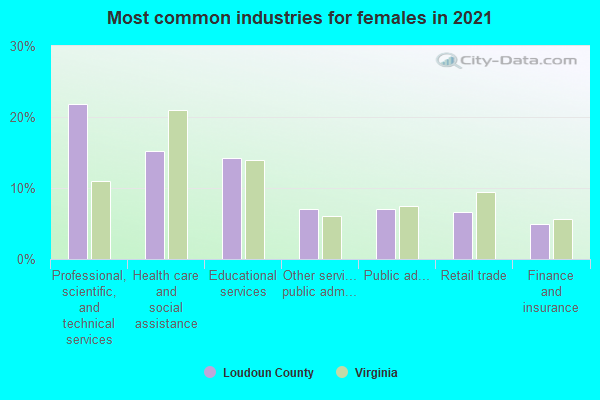
- Professional, scientific, and technical services (20%)
- Educational services (14%)
- Health care and social assistance (14%)
- Retail trade (9%)
- Public administration (7%)
- Other services, except public administration (6%)
- Accommodation and food services (5%)
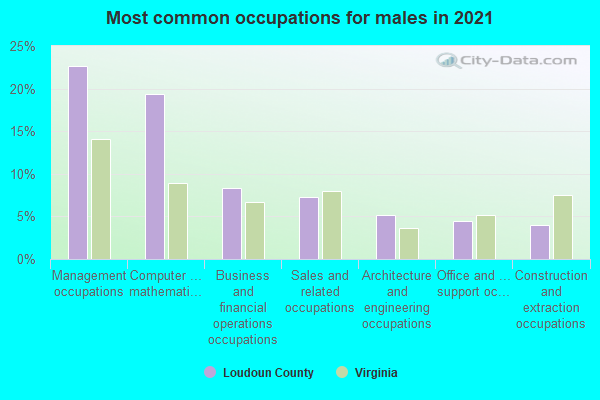
- Management occupations (21%)
- Computer and mathematical occupations (20%)
- Business and financial operations occupations (9%)
- Sales and related occupations (8%)
- Office and administrative support occupations (5%)
- Architecture and engineering occupations (4%)
- Food preparation and serving related occupations (4%)
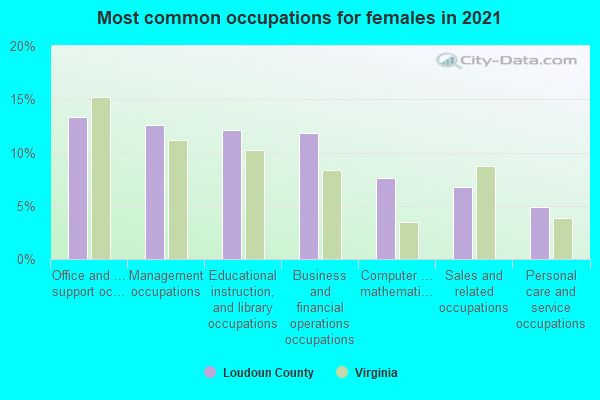
- Management occupations (18%)
- Office and administrative support occupations (13%)
- Business and financial operations occupations (12%)
- Educational instruction, and library occupations (11%)
- Computer and mathematical occupations (8%)
- Sales and related occupations (7%)
- Health diagnosing and treating practitioners and other technical occupations (5%)
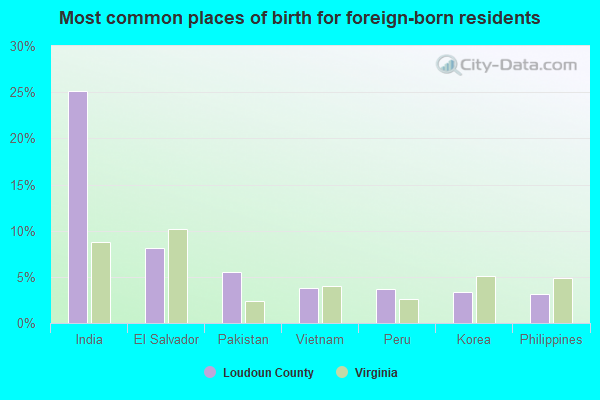
- India (27%)
- El Salvador (8%)
- Pakistan (4%)
- Vietnam (4%)
- Peru (3%)
- Korea (3%)
- Philippines (3%)
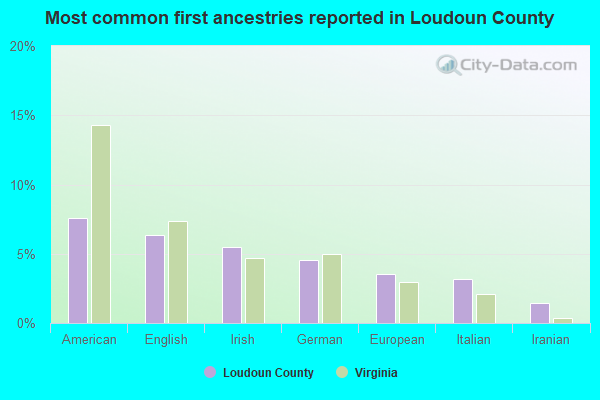
- American (7%)
- English (6%)
- Irish (5%)
- European (4%)
- German (4%)
- Italian (3%)
- Iranian (1%)
People in group quarters in Loudoun County, Virginia in 2010:
- 294 people in nursing facilities/skilled-nursing facilities
- 243 people in college/university student housing
- 177 people in workers' group living quarters and job corps centers
- 137 people in local jails and other municipal confinement facilities
- 101 people in emergency and transitional shelters (with sleeping facilities) for people experiencing homelessness
- 100 people in residential treatment centers for juveniles (non-correctional)
- 44 people in group homes intended for adults
- 33 people in correctional residential facilities
- 22 people in correctional facilities intended for juveniles
- 11 people in other noninstitutional facilities
- 10 people in residential treatment centers for adults
People in group quarters in Loudoun County, Virginia in 2000:
- 471 people in nursing homes
- 140 people in local jails and other confinement facilities (including police lockups)
- 99 people in other noninstitutional group quarters
- 58 people in mental (psychiatric) hospitals or wards
- 21 people in agriculture workers' dormitories on farms
- 19 people in short-term care, detention or diagnostic centers for delinquent children
- 15 people in other group homes
- 12 people in homes for abused, dependent, and neglected children
- 12 people in homes for the mentally retarded
- 4 people in other workers' dormitories
9.26% of this county's 2021 resident taxpayers lived in other counties in 2020 ($110,277 average adjusted gross income)
| Here: | 9.26% |
| Virginia average: | 10.16% |
0.24% of residents moved from foreign countries ($3,796 average AGI)
Loudoun County: 0.24% Virginia average: 0.12%
5.14% relocated from other counties in Virginia ($63,103 average AGI)
3.88% relocated from other states ($43,378 average AGI)
Loudoun County: 3.88% Virginia average: 3.91%
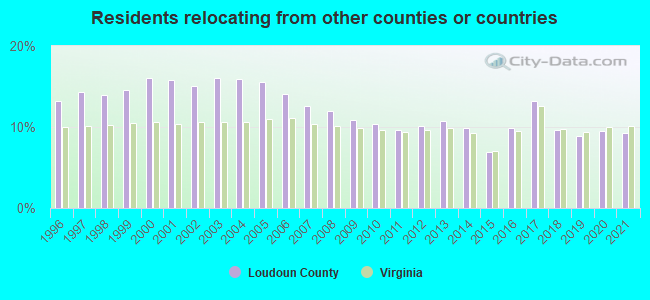
Top counties from which taxpayers relocated into this county between 2020 and 2021:
| from Fairfax County, VA | |
| from Prince William County, VA | |
| from Arlington County, VA | |
| from Montgomery County, MD | |
| from Alexandria city, VA | |
| from District of Columbia, DC | |
| from Prince George's County, MD |
8.87% of this county's 2020 resident taxpayers moved to other counties in 2021 ($118,167 average adjusted gross income)
| Here: | 8.87% |
| Virginia average: | 10.20% |
0.20% of residents moved to foreign countries ($3,395 average AGI)
Loudoun County: 0.20% Virginia average: 0.09%
4.20% relocated to other counties in Virginia ($48,126 average AGI)
4.47% relocated to other states ($66,646 average AGI)
Loudoun County: 4.47% Virginia average: 3.98%
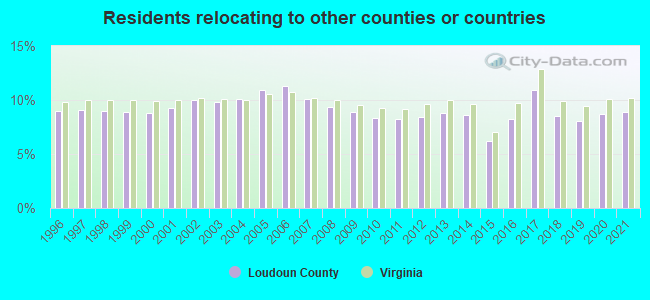
Top counties to which taxpayers relocated from this county between 2020 and 2021:
| to Fairfax County, VA | |
| to Prince William County, VA | |
| to Frederick County, VA | |
| to Arlington County, VA | |
| to Jefferson County, WV | |
| to Frederick County, MD | |
| to Montgomery County, MD |
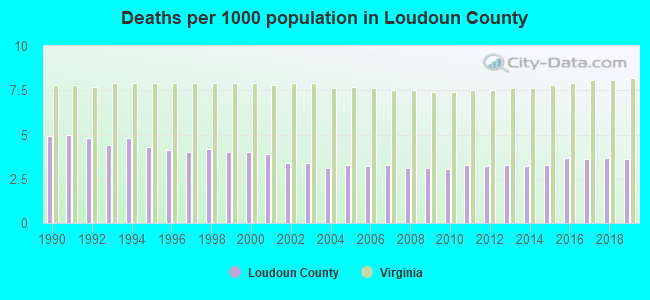
Births per 1000 population from 1990 to 1999: 19.0
Births per 1000 population from 2000 to 2009: 19.4
Births per 1000 population from 2010 to 2022: 11.6

Deaths per 1000 population from 1990 to 1999: 4.5
Deaths per 1000 population from 2000 to 2009: 3.4
Deaths per 1000 population from 2010 to 2020: 3.5
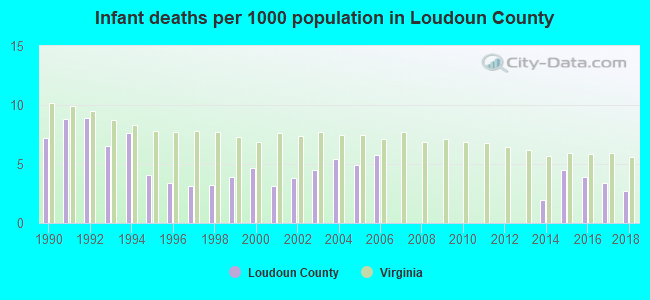
Infant deaths per 1000 live births from 1990 to 1999: 5.7
Infant deaths per 1000 live births from 2000 to 2009: 3.2
Infant deaths per 1000 live births from 2010 to 2021: 2.2
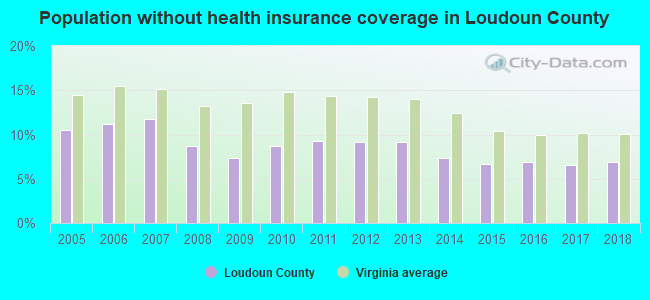
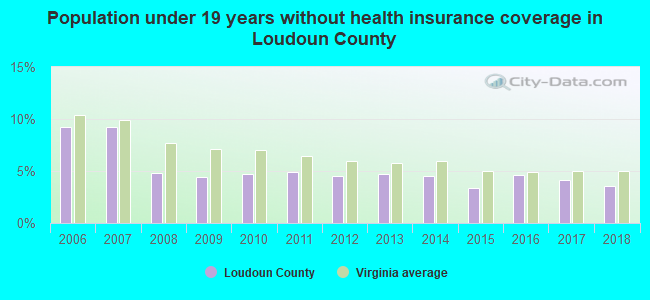
Persons under 19 years old without health insurance coverage in 2018: 3.6%
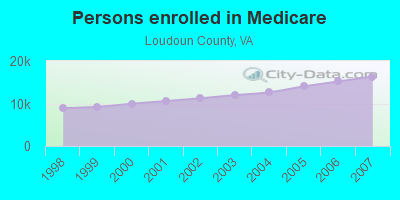
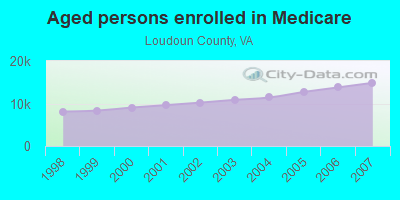
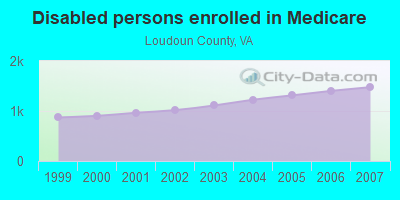
Persons enrolled in hospital insurance and/or supplemental medical insurance (Medicare) in July 1, 2007: 16,341 (14,864 aged, 1,477 disabled)
Children under 18 without health insurance coverage in 2007: 7,968 (9%)
Most common underlying causes of death in Loudoun County, Virginia in 1999 - 2019:
- Bronchus or lung, unspecified - Malignant neoplasms (1,214)
- Atherosclerotic heart disease (1,157)
- Unspecified dementia (790)
- Acute myocardial infarction, unspecified (786)
- Congestive heart failure (625)
- Stroke, not specified as haemorrhage or infarction (586)
- Chronic obstructive pulmonary disease, unspecified (543)
- Alzheimer disease, unspecified (541)
- Breast, unspecified - Malignant neoplasms (512)
- Colon, unspecified - Malignant neoplasms (438)
Population without health insurance coverage in 2000: 12%
Children under 18 without health insurance coverage in 2000: 12%
Short term general hospital admissions per 100,000 population in 2004: 2,489
Short term general hospital beds per 100,000 population in 2004: 38
Emergency room visits per 100,000 population in 2004: 6,335
General practice office based MDs per 100,000 population in 2005: 1,899
Medical specialist MDs per 100,000 population in 2005: 304
Dentists per 100,000 population in 1998: 5
Total births per 100,000 population, July 2005 - July 2006 : 40
Total deaths per 100,000 population, July 2005 - July 2006: 71
Limited-service eating places per 100,000 population in 2005 : 14
Beer, wine & liquor stores per 100,000 population in 2005: 1
Homicides per 1,000,000 population from 2000 to 2006: 16.3. This is less than state average.
Suicides per 1,000,000 population from 2000 to 2006: 74.8. This is less than state average.
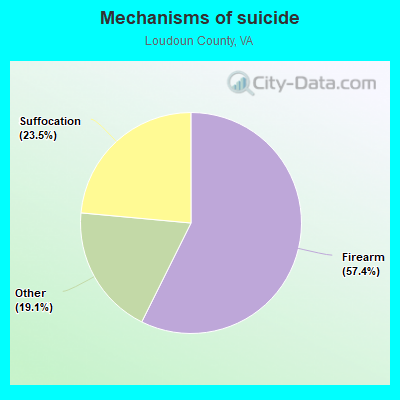
- Firearm - 42.9
- Suffocation - 17.6
- Other - 14.3
Household type by relationship:
Households: 432,085- Male householders: 84,618 (10,238 living alone), Female householders: 58,577 (14,305 living alone)
96,101 spouses (95,367 opposite-sex spouses), 5,452 unmarried partners, (5,268 opposite-sex unmarried partners), 145,492 children (138,356 natural, 2,730 adopted, 4,406 stepchildren), 6,095 grandchildren, 5,072 brothers or sisters, 11,867 parents, 186 foster children, 6,283 other relatives, 10,887 non-relatives
- In group quarters: 1,455
Size of family households: 35,650 2-persons, 27,508 3-persons, 29,783 4-persons, 13,200 5-persons, 4,218 6-persons, 2,546 7-or-more-persons.
Size of nonfamily households: 24,543 1-person, 4,203 2-persons, 1,065 3-persons, 140 4-persons, 339 5-persons.
91,419 married couples with children.
15,614 single-parent households (4,636 men, 10,978 women).
64.0% of residents of Loudoun speak English at home.
10.6% of residents speak Spanish at home (67% speak English very well, 18% speak English well, 11% speak English not well, 4% don't speak English at all).
12.4% of residents speak other Indo-European language at home (70% speak English very well, 21% speak English well, 7% speak English not well, 2% don't speak English at all).
10.0% of residents speak Asian or Pacific Island language at home (74% speak English very well, 19% speak English well, 6% speak English not well, 1% don't speak English at all).
3.0% of residents speak other language at home (71% speak English very well, 13% speak English well, 10% speak English not well, 5% don't speak English at all).
In fiscal year 2004:
Federal Government expenditure: $2,295,543,000 ($9,599 per capita)
Department of Defense expenditure: $1,364,941,000
Federal direct payments to individuals for retirement and disability: $358,691,000
Federal other direct payments to individuals: $51,414,000
Federal direct payments not to individuals: $956,000
Federal grants: $43,184,000
Federal procurement contracts: $1,485,974,000 ($1,269,207,000 Department of Defense)
Federal salaries and wages: $355,324,000 ($7,173,000 Department of Defense)
Federal Government direct loans: $168,000
Federal guaranteed/insured loans: $301,757,000
Federal Government insurance: $67,982,000
Population change from April 1, 2000 to July 1, 2005:
Births: 21,803| Here: | 85 per 1000 residents |
| State: | 70 per 1000 residents |
Deaths: 3,858
| Here: | 15 per 1000 residents |
| State: | 40 per 1000 residents |
Net international migration: +4,691
| Here: | +18 per 1000 residents |
| State: | +18 per 1000 residents |
Net internal migration: +63,686
| Here: | +249 per 1000 residents |
| State: | +14 per 1000 residents |
Total withdrawal of fresh water for public supply: 15.99 millions of gallons per day (6% from ground, 94% from surface)
| Here: | 8.1 |
| State: | 7.0 |
| Here: | 4.5 |
| State: | 4.3 |
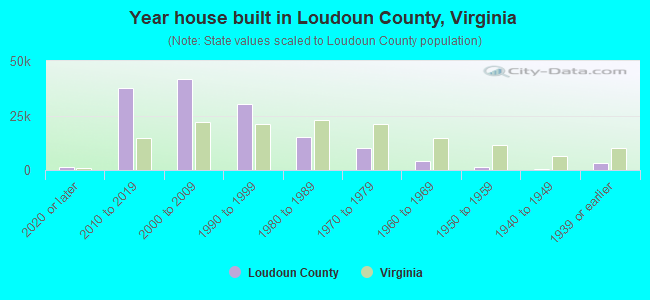
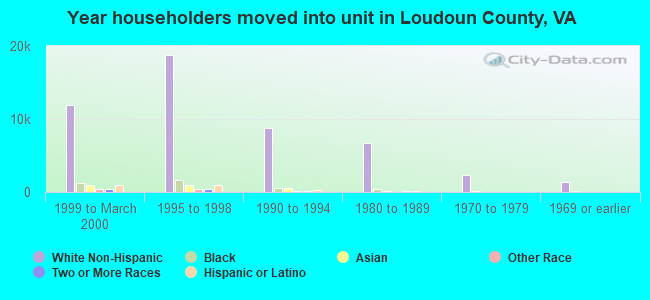
- Year house built in Loudoun County, Virginia
- 3,5372020 or later
- 35,8302010 to 2019
- 46,9442000 to 2009
- 28,4071990 to 1999
- 15,9731980 to 1989
- 6,8891970 to 1979
- 3,6001960 to 1969
- 1,4771950 to 1959
- 5821940 to 1949
- 3,8381939 or earlier
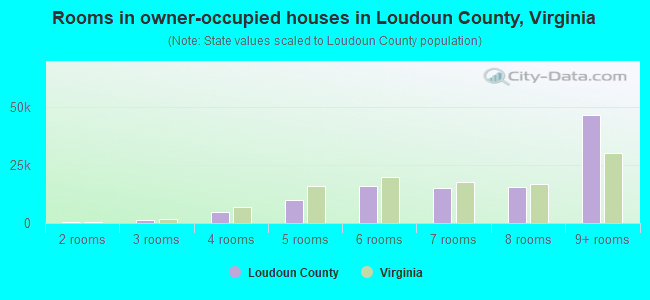
- Rooms in owner-occupied houses in Loudoun County, Virginia
- 3551 room
- 1402 rooms
- 1,5023 rooms
- 6,4824 rooms
- 10,8135 rooms
- 16,1946 rooms
- 12,5037 rooms
- 14,6128 rooms
- 50,0919+ rooms
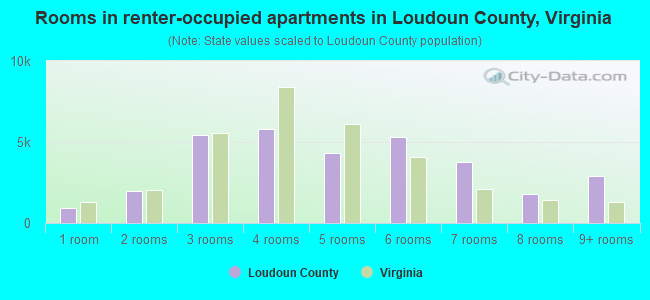
- Rooms in renter-occupied apartments in Loudoun County, Virginia
- 1,1781 room
- 2,4382 rooms
- 5,2073 rooms
- 6,3004 rooms
- 4,6085 rooms
- 4,4616 rooms
- 2,3977 rooms
- 1,2458 rooms
- 2,6699+ rooms
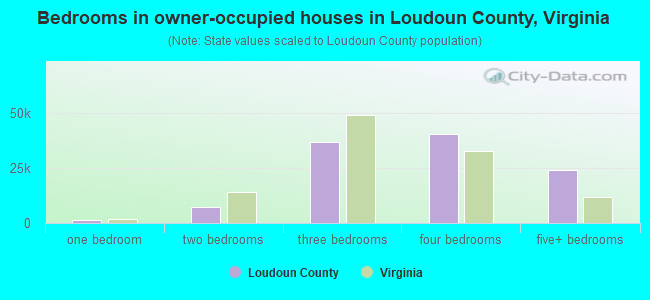
- Bedrooms in owner-occupied houses in Loudoun County, Virginia
- 408no bedroom
- 6841 bedroom
- 8,1802 bedrooms
- 35,9533 bedrooms
- 40,3474 bedrooms
- 27,1205+ bedrooms
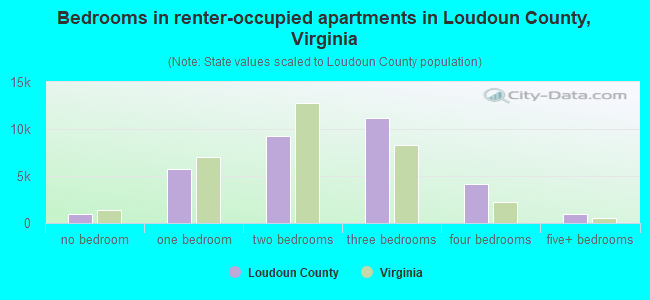
- Bedrooms in renter-occupied apartments in Loudoun County, Virginia
- 1,178no bedroom
- 6,9101 bedroom
- 9,7122 bedrooms
- 9,2143 bedrooms
- 2,7234 bedrooms
- 7665+ bedrooms
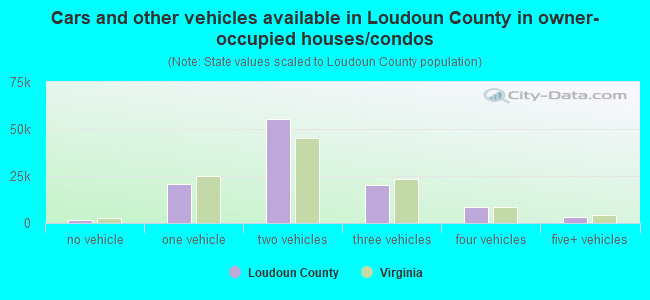
- Cars and other vehicles available in Loudoun County in owner-occupied houses/condos
- 1,843no vehicle
- 21,8411 vehicle
- 54,6242 vehicles
- 22,9743 vehicles
- 8,1284 vehicles
- 3,2825+ vehicles
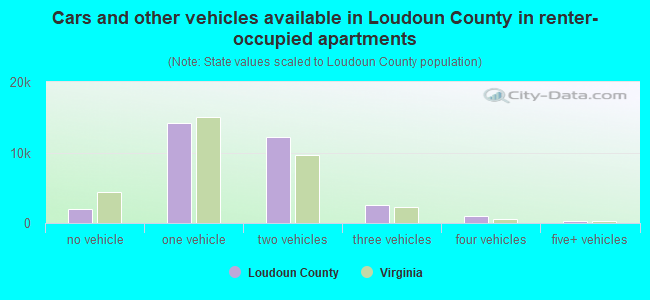
- Cars and other vehicles available in Loudoun County in renter-occupied apartments
- 2,389no vehicle
- 14,7181 vehicle
- 9,8142 vehicles
- 2,7693 vehicles
- 6054 vehicles
- 2085+ vehicles
88.4% of Loudoun County residents lived in the same house 1 years ago.
Out of people who lived in different houses, 32% lived in this county.
Out of people who lived in different counties, 65% lived in Virginia.
| Loudoun County: | 88.4% |
| State average: | 86.6% |
Place of birth for U.S.-born residents:
- This state: 134,365
- Other state: 166,121
- Northeast: 55,943
- Midwest: 24,787
- South: 63,964
- West: 21,427
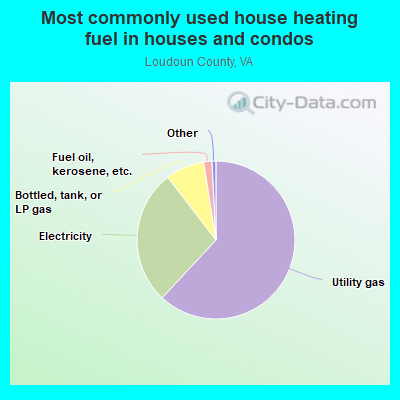
- 61.9%Utility gas
- 26.1%Electricity
- 9.8%Bottled, tank, or LP gas
- 1.3%Fuel oil, kerosene, etc.
- 0.3%Solar energy
- 0.3%Other fuel
- 0.3%Wood
- 0.2%No fuel used
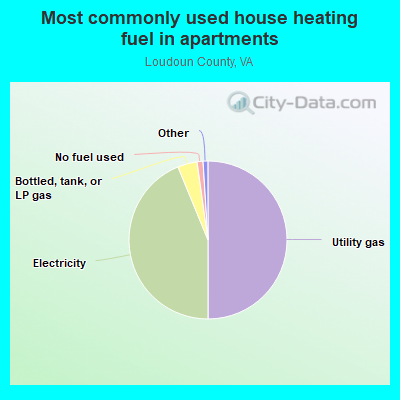
- 47.7%Utility gas
- 46.2%Electricity
- 3.6%Bottled, tank, or LP gas
- 1.3%No fuel used
- 1.2%Fuel oil, kerosene, etc.
- 0.1%Other fuel
Private vs. public school enrollment:
| Here: | 11.3% |
| Virginia: | 13.2% |
| Here: | 5.9% |
| Virginia: | 10.2% |
| Here: | 15.0% |
| Virginia: | 18.7% |
Loudoun County government finances - Expenditure in 2018:
- Assistance and Subsidies - Public Welfare, Federal Categorical Assistance Programs: $9,431,000
Public Welfare, Federal Categorical Assistance Programs: $7,583,000
- Bond Funds - Cash and Securities: $93,969,000
Cash and Securities: $92,266,000
- Charges - Parks and Recreation: $18,383,000
Elementary and Secondary Education School Lunch: $18,295,000
Elementary and Secondary Education School Lunch: $14,278,000
Parks and Recreation: $12,798,000
Other: $9,622,000
Other: $9,554,000
Solid Waste Management: $9,455,000
Solid Waste Management: $7,536,000
Elementary and Secondary Education School Tuition and Transportation: $6,143,000
Elementary and Secondary Education School Tuition and Transportation: $3,397,000
Elementary and Secondary Education - Other: $1,297,000
Elementary and Secondary Education - Other: $913,000
- Construction - Elementary and Secondary Education: $89,027,000
Transit Utilities: $81,183,000
Regular Highways: $80,836,000
Elementary and Secondary Education: $52,209,000
Regular Highways: $50,461,000
Parks and Recreation: $38,442,000
Transit Utilities: $34,949,000
Financial Administration: $28,005,000
Police Protection: $26,588,000
Financial Administration: $19,729,000
General Public Buildings: $16,104,000
Parks and Recreation: $13,854,000
Local Fire Protection: $11,181,000
Judicial and Legal Services: $9,656,000
General Public Buildings: $8,801,000
General - Other: $7,359,000
Sewerage: $6,923,000
Local Fire Protection: $6,590,000
Judicial and Legal Services: $6,502,000
Solid Waste Management: $6,142,000
Police Protection: $5,897,000
Public Welfare - Other: $5,055,000
Solid Waste Management: $4,250,000
Central Staff Services: $3,506,000
Sewerage: $3,074,000
General - Other: $1,947,000
Public Welfare - Other: $1,623,000
Libraries: $1,012,000
Water Utilities: $449,000
Central Staff Services: $290,000
Libraries: $276,000
Natural Resources - Other: $223,000
Correctional Institutions: $220,000
Correctional Institutions: $191,000
Health - Other: $131,000
Natural Resources - Other: $52,000
- Current Operations - Elementary and Secondary Education: $1,319,982,000
Elementary and Secondary Education: $1,145,740,000
Local Fire Protection: $100,240,000
Public Welfare - Other: $83,118,000
Local Fire Protection: $82,764,000
Police Protection: $79,628,000
Police Protection: $72,382,000
Public Welfare - Other: $70,659,000
Central Staff Services: $65,132,000
Central Staff Services: $50,184,000
General - Other: $47,317,000
Parks and Recreation: $46,243,000
Financial Administration: $42,690,000
General - Other: $40,997,000
Parks and Recreation: $38,650,000
Correctional Institutions: $31,501,000
Financial Administration: $31,116,000
Correctional Institutions: $30,975,000
Libraries: $21,919,000
Transit Utilities: $21,797,000
General Public Buildings: $21,724,000
Transit Utilities: $20,779,000
Libraries: $17,056,000
General Public Buildings: $16,268,000
Judicial and Legal Services: $16,156,000
Judicial and Legal Services: $13,661,000
Public Welfare, Vendor Payments for Other Purposes: $10,969,000
Public Welfare, Vendor Payments for Other Purposes: $10,174,000
Protective Inspection and Regulation - Other: $9,481,000
Health - Other: $8,980,000
Protective Inspection and Regulation - Other: $8,652,000
Solid Waste Management: $8,135,000
Regular Highways: $7,639,000
Housing and Community Development: $7,324,000
Regular Highways: $6,646,000
Housing and Community Development: $6,282,000
Solid Waste Management: $5,274,000
Water Utilities: $5,234,000
Corrections - Other: $3,445,000
Corrections - Other: $2,822,000
Sewerage: $1,971,000
Sewerage: $1,569,000
Natural Resources - Other: $931,000
Natural Resources - Other: $773,000
Parking Facilities: $188,000
Parking Facilities: $92,000
- Federal Intergovernmental - Housing and Community Development: $9,806,000
Housing and Community Development: $9,730,000
Education: $1,507,000
Education: $1,217,000
Other: $658,000
Other: $376,000
General Local Government Support: $4,000
General Local Government Support: $3,000
- General - Interest on Debt: $57,779,000
Interest on Debt: $50,085,000
- Intergovernmental to Local - Other - Elementary and Secondary Education: $4,258,000
Other - Elementary and Secondary Education: $4,114,000
- Intergovernmental to State - Regular Highways: $12,009,000
Regular Highways: $11,994,000
Health - Other: $2,089,000
- Local Intergovernmental - Education: $6,347,000
Education: $6,044,000
Other: $557,000
Other: $467,000
Public Welfare: $91,000
Public Welfare: $60,000
- Long Term Debt - Beginning Outstanding - Unspecified Public Purpose: $1,343,604,000
Outstanding Unspecified Public Purpose: $1,246,657,000
Outstanding Unspecified Public Purpose: $1,122,745,000
Beginning Outstanding - Unspecified Public Purpose: $1,071,198,000
Beginning Outstanding - Public Debt for Private Purpose: $463,963,000
Outstanding Nonguaranteed - Industrial Revenue: $446,328,000
Beginning Outstanding - Public Debt for Private Purpose: $428,693,000
Retired Unspecified Public Purpose: $420,854,000
Outstanding Nonguaranteed - Industrial Revenue: $411,058,000
Issue, Unspecified Public Purpose: $274,119,000
Issue, Unspecified Public Purpose: $199,995,000
Retired Unspecified Public Purpose: $98,660,000
Retired Nonguaranteed - Public Debt for Private Purpose: $17,635,000
Retired Nonguaranteed - Public Debt for Private Purpose: $17,635,000
- Miscellaneous - General Revenue - Other: $61,237,000
General Revenue - Other: $51,465,000
Special Assessments: $27,704,000
Interest Earnings: $23,741,000
Special Assessments: $23,276,000
Interest Earnings: $16,209,000
Donations From Private Sources: $3,295,000
Donations From Private Sources: $2,998,000
Rents: $2,320,000
Fines and Forfeits: $2,060,000
Rents: $1,677,000
Fines and Forfeits: $1,541,000
Sale of Property: $613,000
Sale of Property: $339,000
- Other Capital Outlay - Elementary and Secondary Education: $79,306,000
Elementary and Secondary Education: $55,387,000
Regular Highways: $15,709,000
General - Other: $8,911,000
Financial Administration: $4,225,000
Local Fire Protection: $4,131,000
Regular Highways: $3,485,000
General - Other: $2,871,000
General Public Building: $2,441,000
Local Fire Protection: $2,368,000
Police Protection: $1,697,000
Parks and Recreation: $740,000
Police Protection: $723,000
Parks and Recreation: $666,000
Solid Waste Management: $640,000
General Public Building: $536,000
Transit Utilities: $331,000
Solid Waste Management: $146,000
Transit Utilities: $135,000
Libraries: $55,000
Water Utilities: $25,000
Correctional Institutions: $24,000
Public Welfare - Other: $20,000
Public Welfare - Other: $19,000
Health - Other: $6,000
- Other Funds - Cash and Securities: $1,789,493,000
Cash and Securities: $1,426,971,000
- Revenue - Transit Utilities: $9,131,000
Transit Utilities: $7,806,000
- Sinking Funds - Cash and Securities: $446,328,000
Cash and Securities: $411,058,000
- State Intergovernmental - Education: $422,931,000
Education: $362,303,000
General Local Government Support: $74,649,000
General Local Government Support: $74,547,000
Other: $21,018,000
Public Welfare: $16,761,000
Highways: $16,031,000
Public Welfare: $13,602,000
Transit Utilities: $9,056,000
Health and Hospitals: $8,299,000
Health and Hospitals: $6,713,000
Transit Utilities: $6,198,000
Highways: $6,055,000
Other: $3,528,000
Housing and Community Development: $758,000
Housing and Community Development: $669,000
- Tax - Property: $1,442,310,000
Property: $1,227,220,000
General Sales and Gross Receipts: $80,479,000
General Sales and Gross Receipts: $74,095,000
Occupation and Business License - Other: $46,097,000
Occupation and Business License - Other: $43,662,000
Motor Fuels Sales: $32,192,000
Other License: $26,417,000
Public Utilities Sales: $22,452,000
Public Utilities Sales: $22,095,000
Motor Fuels Sales: $21,927,000
Other License: $21,734,000
Other: $20,365,000
Other: $18,304,000
Motor Vehicle License: $7,296,000
Motor Vehicle License: $7,096,000
Amusements License: $119,000
Amusements License: $100,000
Death and Gift: $58,000
Death and Gift: $51,000
- Total Salaries and Wages: $823,994,000
: $681,222,000
- Transit Utilities - Interest on Debt: $5,854,000
Loudoun County government finances - Revenue in 2018:
- Assistance and Subsidies - Public Welfare, Federal Categorical Assistance Programs: $9,431,000
Public Welfare, Federal Categorical Assistance Programs: $7,583,000
- Bond Funds - Cash and Securities: $93,969,000
Cash and Securities: $92,266,000
- Charges - Parks and Recreation: $18,383,000
Elementary and Secondary Education School Lunch: $18,295,000
Elementary and Secondary Education School Lunch: $14,278,000
Parks and Recreation: $12,798,000
Other: $9,622,000
Other: $9,554,000
Solid Waste Management: $9,455,000
Solid Waste Management: $7,536,000
Elementary and Secondary Education School Tuition and Transportation: $6,143,000
Elementary and Secondary Education School Tuition and Transportation: $3,397,000
Elementary and Secondary Education - Other: $1,297,000
Elementary and Secondary Education - Other: $913,000
- Construction - Elementary and Secondary Education: $89,027,000
Transit Utilities: $81,183,000
Regular Highways: $80,836,000
Elementary and Secondary Education: $52,209,000
Regular Highways: $50,461,000
Parks and Recreation: $38,442,000
Transit Utilities: $34,949,000
Financial Administration: $28,005,000
Police Protection: $26,588,000
Financial Administration: $19,729,000
General Public Buildings: $16,104,000
Parks and Recreation: $13,854,000
Local Fire Protection: $11,181,000
Judicial and Legal Services: $9,656,000
General Public Buildings: $8,801,000
General - Other: $7,359,000
Sewerage: $6,923,000
Local Fire Protection: $6,590,000
Judicial and Legal Services: $6,502,000
Solid Waste Management: $6,142,000
Police Protection: $5,897,000
Public Welfare - Other: $5,055,000
Solid Waste Management: $4,250,000
Central Staff Services: $3,506,000
Sewerage: $3,074,000
General - Other: $1,947,000
Public Welfare - Other: $1,623,000
Libraries: $1,012,000
Water Utilities: $449,000
Central Staff Services: $290,000
Libraries: $276,000
Natural Resources - Other: $223,000
Correctional Institutions: $220,000
Correctional Institutions: $191,000
Health - Other: $131,000
Natural Resources - Other: $52,000
- Current Operations - Elementary and Secondary Education: $1,319,982,000
Elementary and Secondary Education: $1,145,740,000
Local Fire Protection: $100,240,000
Public Welfare - Other: $83,118,000
Local Fire Protection: $82,764,000
Police Protection: $79,628,000
Police Protection: $72,382,000
Public Welfare - Other: $70,659,000
Central Staff Services: $65,132,000
Central Staff Services: $50,184,000
General - Other: $47,317,000
Parks and Recreation: $46,243,000
Financial Administration: $42,690,000
General - Other: $40,997,000
Parks and Recreation: $38,650,000
Correctional Institutions: $31,501,000
Financial Administration: $31,116,000
Correctional Institutions: $30,975,000
Libraries: $21,919,000
Transit Utilities: $21,797,000
General Public Buildings: $21,724,000
Transit Utilities: $20,779,000
Libraries: $17,056,000
General Public Buildings: $16,268,000
Judicial and Legal Services: $16,156,000
Judicial and Legal Services: $13,661,000
Public Welfare, Vendor Payments for Other Purposes: $10,969,000
Public Welfare, Vendor Payments for Other Purposes: $10,174,000
Protective Inspection and Regulation - Other: $9,481,000
Health - Other: $8,980,000
Protective Inspection and Regulation - Other: $8,652,000
Solid Waste Management: $8,135,000
Regular Highways: $7,639,000
Housing and Community Development: $7,324,000
Regular Highways: $6,646,000
Housing and Community Development: $6,282,000
Solid Waste Management: $5,274,000
Water Utilities: $5,234,000
Corrections - Other: $3,445,000
Corrections - Other: $2,822,000
Sewerage: $1,971,000
Sewerage: $1,569,000
Natural Resources - Other: $931,000
Natural Resources - Other: $773,000
Parking Facilities: $188,000
Parking Facilities: $92,000
- Federal Intergovernmental - Housing and Community Development: $9,806,000
Housing and Community Development: $9,730,000
Education: $1,507,000
Education: $1,217,000
Other: $658,000
Other: $376,000
General Local Government Support: $4,000
General Local Government Support: $3,000
- General - Interest on Debt: $57,779,000
Interest on Debt: $50,085,000
- Intergovernmental to Local - Other - Elementary and Secondary Education: $4,258,000
Other - Elementary and Secondary Education: $4,114,000
- Intergovernmental to State - Regular Highways: $12,009,000
Regular Highways: $11,994,000
Health - Other: $2,089,000
- Local Intergovernmental - Education: $6,347,000
Education: $6,044,000
Other: $557,000
Other: $467,000
Public Welfare: $91,000
Public Welfare: $60,000
- Long Term Debt - Beginning Outstanding - Unspecified Public Purpose: $1,343,604,000
Outstanding Unspecified Public Purpose: $1,246,657,000
Outstanding Unspecified Public Purpose: $1,122,745,000
Beginning Outstanding - Unspecified Public Purpose: $1,071,198,000
Beginning Outstanding - Public Debt for Private Purpose: $463,963,000
Outstanding Nonguaranteed - Industrial Revenue: $446,328,000
Beginning Outstanding - Public Debt for Private Purpose: $428,693,000
Retired Unspecified Public Purpose: $420,854,000
Outstanding Nonguaranteed - Industrial Revenue: $411,058,000
Issue, Unspecified Public Purpose: $274,119,000
Issue, Unspecified Public Purpose: $199,995,000
Retired Unspecified Public Purpose: $98,660,000
Retired Nonguaranteed - Public Debt for Private Purpose: $17,635,000
Retired Nonguaranteed - Public Debt for Private Purpose: $17,635,000
- Miscellaneous - General Revenue - Other: $61,237,000
General Revenue - Other: $51,465,000
Special Assessments: $27,704,000
Interest Earnings: $23,741,000
Special Assessments: $23,276,000
Interest Earnings: $16,209,000
Donations From Private Sources: $3,295,000
Donations From Private Sources: $2,998,000
Rents: $2,320,000
Fines and Forfeits: $2,060,000
Rents: $1,677,000
Fines and Forfeits: $1,541,000
Sale of Property: $613,000
Sale of Property: $339,000
- Other Capital Outlay - Elementary and Secondary Education: $79,306,000
Elementary and Secondary Education: $55,387,000
Regular Highways: $15,709,000
General - Other: $8,911,000
Financial Administration: $4,225,000
Local Fire Protection: $4,131,000
Regular Highways: $3,485,000
General - Other: $2,871,000
General Public Building: $2,441,000
Local Fire Protection: $2,368,000
Police Protection: $1,697,000
Parks and Recreation: $740,000
Police Protection: $723,000
Parks and Recreation: $666,000
Solid Waste Management: $640,000
General Public Building: $536,000
Transit Utilities: $331,000
Solid Waste Management: $146,000
Transit Utilities: $135,000
Libraries: $55,000
Water Utilities: $25,000
Correctional Institutions: $24,000
Public Welfare - Other: $20,000
Public Welfare - Other: $19,000
Health - Other: $6,000
- Other Funds - Cash and Securities: $1,789,493,000
Cash and Securities: $1,426,971,000
- Revenue - Transit Utilities: $9,131,000
Transit Utilities: $7,806,000
- Sinking Funds - Cash and Securities: $446,328,000
Cash and Securities: $411,058,000
- State Intergovernmental - Education: $422,931,000
Education: $362,303,000
General Local Government Support: $74,649,000
General Local Government Support: $74,547,000
Other: $21,018,000
Public Welfare: $16,761,000
Highways: $16,031,000
Public Welfare: $13,602,000
Transit Utilities: $9,056,000
Health and Hospitals: $8,299,000
Health and Hospitals: $6,713,000
Transit Utilities: $6,198,000
Highways: $6,055,000
Other: $3,528,000
Housing and Community Development: $758,000
Housing and Community Development: $669,000
- Tax - Property: $1,442,310,000
Property: $1,227,220,000
General Sales and Gross Receipts: $80,479,000
General Sales and Gross Receipts: $74,095,000
Occupation and Business License - Other: $46,097,000
Occupation and Business License - Other: $43,662,000
Motor Fuels Sales: $32,192,000
Other License: $26,417,000
Public Utilities Sales: $22,452,000
Public Utilities Sales: $22,095,000
Motor Fuels Sales: $21,927,000
Other License: $21,734,000
Other: $20,365,000
Other: $18,304,000
Motor Vehicle License: $7,296,000
Motor Vehicle License: $7,096,000
Amusements License: $119,000
Amusements License: $100,000
Death and Gift: $58,000
Death and Gift: $51,000
- Total Salaries and Wages: $823,994,000
: $681,222,000
- Transit Utilities - Interest on Debt: $5,854,000
Loudoun County government finances - Debt in 2018:
- Assistance and Subsidies - Public Welfare, Federal Categorical Assistance Programs: $9,431,000
Public Welfare, Federal Categorical Assistance Programs: $7,583,000
- Bond Funds - Cash and Securities: $93,969,000
Cash and Securities: $92,266,000
- Charges - Parks and Recreation: $18,383,000
Elementary and Secondary Education School Lunch: $18,295,000
Elementary and Secondary Education School Lunch: $14,278,000
Parks and Recreation: $12,798,000
Other: $9,622,000
Other: $9,554,000
Solid Waste Management: $9,455,000
Solid Waste Management: $7,536,000
Elementary and Secondary Education School Tuition and Transportation: $6,143,000
Elementary and Secondary Education School Tuition and Transportation: $3,397,000
Elementary and Secondary Education - Other: $1,297,000
Elementary and Secondary Education - Other: $913,000
- Construction - Elementary and Secondary Education: $89,027,000
Transit Utilities: $81,183,000
Regular Highways: $80,836,000
Elementary and Secondary Education: $52,209,000
Regular Highways: $50,461,000
Parks and Recreation: $38,442,000
Transit Utilities: $34,949,000
Financial Administration: $28,005,000
Police Protection: $26,588,000
Financial Administration: $19,729,000
General Public Buildings: $16,104,000
Parks and Recreation: $13,854,000
Local Fire Protection: $11,181,000
Judicial and Legal Services: $9,656,000
General Public Buildings: $8,801,000
General - Other: $7,359,000
Sewerage: $6,923,000
Local Fire Protection: $6,590,000
Judicial and Legal Services: $6,502,000
Solid Waste Management: $6,142,000
Police Protection: $5,897,000
Public Welfare - Other: $5,055,000
Solid Waste Management: $4,250,000
Central Staff Services: $3,506,000
Sewerage: $3,074,000
General - Other: $1,947,000
Public Welfare - Other: $1,623,000
Libraries: $1,012,000
Water Utilities: $449,000
Central Staff Services: $290,000
Libraries: $276,000
Natural Resources - Other: $223,000
Correctional Institutions: $220,000
Correctional Institutions: $191,000
Health - Other: $131,000
Natural Resources - Other: $52,000
- Current Operations - Elementary and Secondary Education: $1,319,982,000
Elementary and Secondary Education: $1,145,740,000
Local Fire Protection: $100,240,000
Public Welfare - Other: $83,118,000
Local Fire Protection: $82,764,000
Police Protection: $79,628,000
Police Protection: $72,382,000
Public Welfare - Other: $70,659,000
Central Staff Services: $65,132,000
Central Staff Services: $50,184,000
General - Other: $47,317,000
Parks and Recreation: $46,243,000
Financial Administration: $42,690,000
General - Other: $40,997,000
Parks and Recreation: $38,650,000
Correctional Institutions: $31,501,000
Financial Administration: $31,116,000
Correctional Institutions: $30,975,000
Libraries: $21,919,000
Transit Utilities: $21,797,000
General Public Buildings: $21,724,000
Transit Utilities: $20,779,000
Libraries: $17,056,000
General Public Buildings: $16,268,000
Judicial and Legal Services: $16,156,000
Judicial and Legal Services: $13,661,000
Public Welfare, Vendor Payments for Other Purposes: $10,969,000
Public Welfare, Vendor Payments for Other Purposes: $10,174,000
Protective Inspection and Regulation - Other: $9,481,000
Health - Other: $8,980,000
Protective Inspection and Regulation - Other: $8,652,000
Solid Waste Management: $8,135,000
Regular Highways: $7,639,000
Housing and Community Development: $7,324,000
Regular Highways: $6,646,000
Housing and Community Development: $6,282,000
Solid Waste Management: $5,274,000
Water Utilities: $5,234,000
Corrections - Other: $3,445,000
Corrections - Other: $2,822,000
Sewerage: $1,971,000
Sewerage: $1,569,000
Natural Resources - Other: $931,000
Natural Resources - Other: $773,000
Parking Facilities: $188,000
Parking Facilities: $92,000
- Federal Intergovernmental - Housing and Community Development: $9,806,000
Housing and Community Development: $9,730,000
Education: $1,507,000
Education: $1,217,000
Other: $658,000
Other: $376,000
General Local Government Support: $4,000
General Local Government Support: $3,000
- General - Interest on Debt: $57,779,000
Interest on Debt: $50,085,000
- Intergovernmental to Local - Other - Elementary and Secondary Education: $4,258,000
Other - Elementary and Secondary Education: $4,114,000
- Intergovernmental to State - Regular Highways: $12,009,000
Regular Highways: $11,994,000
Health - Other: $2,089,000
- Local Intergovernmental - Education: $6,347,000
Education: $6,044,000
Other: $557,000
Other: $467,000
Public Welfare: $91,000
Public Welfare: $60,000
- Long Term Debt - Beginning Outstanding - Unspecified Public Purpose: $1,343,604,000
Outstanding Unspecified Public Purpose: $1,246,657,000
Outstanding Unspecified Public Purpose: $1,122,745,000
Beginning Outstanding - Unspecified Public Purpose: $1,071,198,000
Beginning Outstanding - Public Debt for Private Purpose: $463,963,000
Outstanding Nonguaranteed - Industrial Revenue: $446,328,000
Beginning Outstanding - Public Debt for Private Purpose: $428,693,000
Retired Unspecified Public Purpose: $420,854,000
Outstanding Nonguaranteed - Industrial Revenue: $411,058,000
Issue, Unspecified Public Purpose: $274,119,000
Issue, Unspecified Public Purpose: $199,995,000
Retired Unspecified Public Purpose: $98,660,000
Retired Nonguaranteed - Public Debt for Private Purpose: $17,635,000
Retired Nonguaranteed - Public Debt for Private Purpose: $17,635,000
- Miscellaneous - General Revenue - Other: $61,237,000
General Revenue - Other: $51,465,000
Special Assessments: $27,704,000
Interest Earnings: $23,741,000
Special Assessments: $23,276,000
Interest Earnings: $16,209,000
Donations From Private Sources: $3,295,000
Donations From Private Sources: $2,998,000
Rents: $2,320,000
Fines and Forfeits: $2,060,000
Rents: $1,677,000
Fines and Forfeits: $1,541,000
Sale of Property: $613,000
Sale of Property: $339,000
- Other Capital Outlay - Elementary and Secondary Education: $79,306,000
Elementary and Secondary Education: $55,387,000
Regular Highways: $15,709,000
General - Other: $8,911,000
Financial Administration: $4,225,000
Local Fire Protection: $4,131,000
Regular Highways: $3,485,000
General - Other: $2,871,000
General Public Building: $2,441,000
Local Fire Protection: $2,368,000
Police Protection: $1,697,000
Parks and Recreation: $740,000
Police Protection: $723,000
Parks and Recreation: $666,000
Solid Waste Management: $640,000
General Public Building: $536,000
Transit Utilities: $331,000
Solid Waste Management: $146,000
Transit Utilities: $135,000
Libraries: $55,000
Water Utilities: $25,000
Correctional Institutions: $24,000
Public Welfare - Other: $20,000
Public Welfare - Other: $19,000
Health - Other: $6,000
- Other Funds - Cash and Securities: $1,789,493,000
Cash and Securities: $1,426,971,000
- Revenue - Transit Utilities: $9,131,000
Transit Utilities: $7,806,000
- Sinking Funds - Cash and Securities: $446,328,000
Cash and Securities: $411,058,000
- State Intergovernmental - Education: $422,931,000
Education: $362,303,000
General Local Government Support: $74,649,000
General Local Government Support: $74,547,000
Other: $21,018,000
Public Welfare: $16,761,000
Highways: $16,031,000
Public Welfare: $13,602,000
Transit Utilities: $9,056,000
Health and Hospitals: $8,299,000
Health and Hospitals: $6,713,000
Transit Utilities: $6,198,000
Highways: $6,055,000
Other: $3,528,000
Housing and Community Development: $758,000
Housing and Community Development: $669,000
- Tax - Property: $1,442,310,000
Property: $1,227,220,000
General Sales and Gross Receipts: $80,479,000
General Sales and Gross Receipts: $74,095,000
Occupation and Business License - Other: $46,097,000
Occupation and Business License - Other: $43,662,000
Motor Fuels Sales: $32,192,000
Other License: $26,417,000
Public Utilities Sales: $22,452,000
Public Utilities Sales: $22,095,000
Motor Fuels Sales: $21,927,000
Other License: $21,734,000
Other: $20,365,000
Other: $18,304,000
Motor Vehicle License: $7,296,000
Motor Vehicle License: $7,096,000
Amusements License: $119,000
Amusements License: $100,000
Death and Gift: $58,000
Death and Gift: $51,000
- Total Salaries and Wages: $823,994,000
: $681,222,000
- Transit Utilities - Interest on Debt: $5,854,000
Loudoun County government finances - Cash and Securities in 2018:
- Assistance and Subsidies - Public Welfare, Federal Categorical Assistance Programs: $9,431,000
Public Welfare, Federal Categorical Assistance Programs: $7,583,000
- Bond Funds - Cash and Securities: $93,969,000
Cash and Securities: $92,266,000
- Charges - Parks and Recreation: $18,383,000
Elementary and Secondary Education School Lunch: $18,295,000
Elementary and Secondary Education School Lunch: $14,278,000
Parks and Recreation: $12,798,000
Other: $9,622,000
Other: $9,554,000
Solid Waste Management: $9,455,000
Solid Waste Management: $7,536,000
Elementary and Secondary Education School Tuition and Transportation: $6,143,000
Elementary and Secondary Education School Tuition and Transportation: $3,397,000
Elementary and Secondary Education - Other: $1,297,000
Elementary and Secondary Education - Other: $913,000
- Construction - Elementary and Secondary Education: $89,027,000
Transit Utilities: $81,183,000
Regular Highways: $80,836,000
Elementary and Secondary Education: $52,209,000
Regular Highways: $50,461,000
Parks and Recreation: $38,442,000
Transit Utilities: $34,949,000
Financial Administration: $28,005,000
Police Protection: $26,588,000
Financial Administration: $19,729,000
General Public Buildings: $16,104,000
Parks and Recreation: $13,854,000
Local Fire Protection: $11,181,000
Judicial and Legal Services: $9,656,000
General Public Buildings: $8,801,000
General - Other: $7,359,000
Sewerage: $6,923,000
Local Fire Protection: $6,590,000
Judicial and Legal Services: $6,502,000
Solid Waste Management: $6,142,000
Police Protection: $5,897,000
Public Welfare - Other: $5,055,000
Solid Waste Management: $4,250,000
Central Staff Services: $3,506,000
Sewerage: $3,074,000
General - Other: $1,947,000
Public Welfare - Other: $1,623,000
Libraries: $1,012,000
Water Utilities: $449,000
Central Staff Services: $290,000
Libraries: $276,000
Natural Resources - Other: $223,000
Correctional Institutions: $220,000
Correctional Institutions: $191,000
Health - Other: $131,000
Natural Resources - Other: $52,000
- Current Operations - Elementary and Secondary Education: $1,319,982,000
Elementary and Secondary Education: $1,145,740,000
Local Fire Protection: $100,240,000
Public Welfare - Other: $83,118,000
Local Fire Protection: $82,764,000
Police Protection: $79,628,000
Police Protection: $72,382,000
Public Welfare - Other: $70,659,000
Central Staff Services: $65,132,000
Central Staff Services: $50,184,000
General - Other: $47,317,000
Parks and Recreation: $46,243,000
Financial Administration: $42,690,000
General - Other: $40,997,000
Parks and Recreation: $38,650,000
Correctional Institutions: $31,501,000
Financial Administration: $31,116,000
Correctional Institutions: $30,975,000
Libraries: $21,919,000
Transit Utilities: $21,797,000
General Public Buildings: $21,724,000
Transit Utilities: $20,779,000
Libraries: $17,056,000
General Public Buildings: $16,268,000
Judicial and Legal Services: $16,156,000
Judicial and Legal Services: $13,661,000
Public Welfare, Vendor Payments for Other Purposes: $10,969,000
Public Welfare, Vendor Payments for Other Purposes: $10,174,000
Protective Inspection and Regulation - Other: $9,481,000
Health - Other: $8,980,000
Protective Inspection and Regulation - Other: $8,652,000
Solid Waste Management: $8,135,000
Regular Highways: $7,639,000
Housing and Community Development: $7,324,000
Regular Highways: $6,646,000
Housing and Community Development: $6,282,000
Solid Waste Management: $5,274,000
Water Utilities: $5,234,000
Corrections - Other: $3,445,000
Corrections - Other: $2,822,000
Sewerage: $1,971,000
Sewerage: $1,569,000
Natural Resources - Other: $931,000
Natural Resources - Other: $773,000
Parking Facilities: $188,000
Parking Facilities: $92,000
- Federal Intergovernmental - Housing and Community Development: $9,806,000
Housing and Community Development: $9,730,000
Education: $1,507,000
Education: $1,217,000
Other: $658,000
Other: $376,000
General Local Government Support: $4,000
General Local Government Support: $3,000
- General - Interest on Debt: $57,779,000
Interest on Debt: $50,085,000
- Intergovernmental to Local - Other - Elementary and Secondary Education: $4,258,000
Other - Elementary and Secondary Education: $4,114,000
- Intergovernmental to State - Regular Highways: $12,009,000
Regular Highways: $11,994,000
Health - Other: $2,089,000
- Local Intergovernmental - Education: $6,347,000
Education: $6,044,000
Other: $557,000
Other: $467,000
Public Welfare: $91,000
Public Welfare: $60,000
- Long Term Debt - Beginning Outstanding - Unspecified Public Purpose: $1,343,604,000
Outstanding Unspecified Public Purpose: $1,246,657,000
Outstanding Unspecified Public Purpose: $1,122,745,000
Beginning Outstanding - Unspecified Public Purpose: $1,071,198,000
Beginning Outstanding - Public Debt for Private Purpose: $463,963,000
Outstanding Nonguaranteed - Industrial Revenue: $446,328,000
Beginning Outstanding - Public Debt for Private Purpose: $428,693,000
Retired Unspecified Public Purpose: $420,854,000
Outstanding Nonguaranteed - Industrial Revenue: $411,058,000
Issue, Unspecified Public Purpose: $274,119,000
Issue, Unspecified Public Purpose: $199,995,000
Retired Unspecified Public Purpose: $98,660,000
Retired Nonguaranteed - Public Debt for Private Purpose: $17,635,000
Retired Nonguaranteed - Public Debt for Private Purpose: $17,635,000
- Miscellaneous - General Revenue - Other: $61,237,000
General Revenue - Other: $51,465,000
Special Assessments: $27,704,000
Interest Earnings: $23,741,000
Special Assessments: $23,276,000
Interest Earnings: $16,209,000
Donations From Private Sources: $3,295,000
Donations From Private Sources: $2,998,000
Rents: $2,320,000
Fines and Forfeits: $2,060,000
Rents: $1,677,000
Fines and Forfeits: $1,541,000
Sale of Property: $613,000
Sale of Property: $339,000
- Other Capital Outlay - Elementary and Secondary Education: $79,306,000
Elementary and Secondary Education: $55,387,000
Regular Highways: $15,709,000
General - Other: $8,911,000
Financial Administration: $4,225,000
Local Fire Protection: $4,131,000
Regular Highways: $3,485,000
General - Other: $2,871,000
General Public Building: $2,441,000
Local Fire Protection: $2,368,000
Police Protection: $1,697,000
Parks and Recreation: $740,000
Police Protection: $723,000
Parks and Recreation: $666,000
Solid Waste Management: $640,000
General Public Building: $536,000
Transit Utilities: $331,000
Solid Waste Management: $146,000
Transit Utilities: $135,000
Libraries: $55,000
Water Utilities: $25,000
Correctional Institutions: $24,000
Public Welfare - Other: $20,000
Public Welfare - Other: $19,000
Health - Other: $6,000
- Other Funds - Cash and Securities: $1,789,493,000
Cash and Securities: $1,426,971,000
- Revenue - Transit Utilities: $9,131,000
Transit Utilities: $7,806,000
- Sinking Funds - Cash and Securities: $446,328,000
Cash and Securities: $411,058,000
- State Intergovernmental - Education: $422,931,000
Education: $362,303,000
General Local Government Support: $74,649,000
General Local Government Support: $74,547,000
Other: $21,018,000
Public Welfare: $16,761,000
Highways: $16,031,000
Public Welfare: $13,602,000
Transit Utilities: $9,056,000
Health and Hospitals: $8,299,000
Health and Hospitals: $6,713,000
Transit Utilities: $6,198,000
Highways: $6,055,000
Other: $3,528,000
Housing and Community Development: $758,000
Housing and Community Development: $669,000
- Tax - Property: $1,442,310,000
Property: $1,227,220,000
General Sales and Gross Receipts: $80,479,000
General Sales and Gross Receipts: $74,095,000
Occupation and Business License - Other: $46,097,000
Occupation and Business License - Other: $43,662,000
Motor Fuels Sales: $32,192,000
Other License: $26,417,000
Public Utilities Sales: $22,452,000
Public Utilities Sales: $22,095,000
Motor Fuels Sales: $21,927,000
Other License: $21,734,000
Other: $20,365,000
Other: $18,304,000
Motor Vehicle License: $7,296,000
Motor Vehicle License: $7,096,000
Amusements License: $119,000
Amusements License: $100,000
Death and Gift: $58,000
Death and Gift: $51,000
- Total Salaries and Wages: $823,994,000
: $681,222,000
- Transit Utilities - Interest on Debt: $5,854,000
Supplemental Security Income (SSI) in 2006:
- Total number of recipients: 1,264
- Number of aged recipients: 542
- Number of blind and disabled recipients: 722
- Number of recipients under 18: 116
- Number of recipients between 18 and 64: 464
- Number of recipients older than 64: 684
- Number of recipients also receiving OASDI: 289
- Amount of payments (thousands of dollars): 572
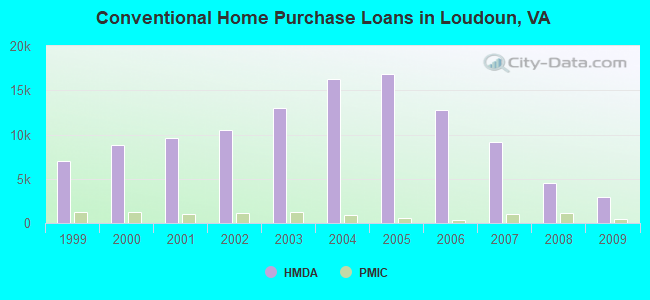
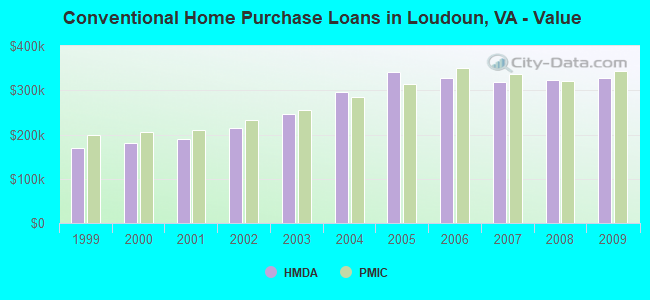
| Home Mortgage Disclosure Act Aggregated Statistics For Year 2009 (Based on 32 full tracts) | ||||||||||||||
| A) FHA, FSA/RHS & VA Home Purchase Loans | B) Conventional Home Purchase Loans | C) Refinancings | D) Home Improvement Loans | E) Loans on Dwellings For 5+ Families | F) Non-occupant Loans on < 5 Family Dwellings (A B C & D) | G) Loans On Manufactured Home Dwelling (A B C & D) | ||||||||
|---|---|---|---|---|---|---|---|---|---|---|---|---|---|---|
| Number | Average Value | Number | Average Value | Number | Average Value | Number | Average Value | Number | Average Value | Number | Average Value | Number | Average Value | |
| LOANS ORIGINATED | 3,017 | $333,420 | 2,991 | $328,117 | 11,154 | $331,726 | 260 | $156,300 | 1 | $35,746,000 | 552 | $259,848 | 2 | $127,500 |
| APPLICATIONS APPROVED, NOT ACCEPTED | 168 | $329,095 | 268 | $353,679 | 787 | $338,435 | 35 | $110,429 | 0 | $0 | 48 | $226,250 | 1 | $369,000 |
| APPLICATIONS DENIED | 323 | $317,245 | 304 | $344,359 | 2,816 | $364,020 | 129 | $83,031 | 0 | $0 | 157 | $262,510 | 3 | $164,667 |
| APPLICATIONS WITHDRAWN | 421 | $332,059 | 513 | $344,916 | 2,530 | $360,694 | 61 | $239,016 | 1 | $24,971,000 | 139 | $229,237 | 0 | $0 |
| FILES CLOSED FOR INCOMPLETENESS | 57 | $281,000 | 74 | $324,054 | 563 | $338,469 | 12 | $175,000 | 0 | $0 | 30 | $317,967 | 0 | $0 |
| Private Mortgage Insurance Companies Aggregated Statistics For Year 2009 (Based on 31 full tracts) | ||||||
| A) Conventional Home Purchase Loans | B) Refinancings | C) Non-occupant Loans on < 5 Family Dwellings (A & B) | ||||
|---|---|---|---|---|---|---|
| Number | Average Value | Number | Average Value | Number | Average Value | |
| LOANS ORIGINATED | 490 | $342,408 | 173 | $352,873 | 0 | $0 |
| APPLICATIONS APPROVED, NOT ACCEPTED | 291 | $384,186 | 94 | $376,383 | 2 | $189,500 |
| APPLICATIONS DENIED | 70 | $381,186 | 57 | $371,561 | 0 | $0 |
| APPLICATIONS WITHDRAWN | 42 | $417,595 | 26 | $379,654 | 0 | $0 |
| FILES CLOSED FOR INCOMPLETENESS | 18 | $347,889 | 2 | $465,000 | 0 | $0 |
| Most common first names in Loudoun County, VA among deceased individuals | ||
| Name | Count | Lived (average) |
|---|---|---|
| Mary | 122 | 83.4 years |
| John | 104 | 76.0 years |
| Robert | 103 | 75.2 years |
| James | 89 | 75.7 years |
| William | 85 | 76.3 years |
| Charles | 74 | 77.7 years |
| Helen | 58 | 85.2 years |
| Margaret | 55 | 82.7 years |
| George | 50 | 78.6 years |
| Richard | 45 | 76.4 years |
| Most common last names in Loudoun County, VA among deceased individuals | ||
| Last name | Count | Lived (average) |
|---|---|---|
| Smith | 37 | 75.7 years |
| Brown | 30 | 80.5 years |
| Miller | 22 | 77.1 years |
| Payne | 20 | 77.9 years |
| Thompson | 19 | 77.2 years |
| Moore | 19 | 79.3 years |
| Jones | 19 | 77.6 years |
| Frye | 18 | 79.8 years |
| Jackson | 18 | 76.7 years |
| Johnson | 17 | 73.4 years |
| Businesses in Loudoun County, VA | ||||
| Name | Count | Name | Count | |
|---|---|---|---|---|
| 7-Eleven | 19 | JCPenney | 1 | |
| AT&T | 14 | JoS. A. Bank | 1 | |
| Abercrombie & Fitch | 1 | Johnny Rockets | 1 | |
| Abercrombie Kids | 1 | Jones New York | 4 | |
| Advance Auto Parts | 5 | Journeys | 1 | |
| Aeropostale | 2 | Justice | 2 | |
| Aerosoles | 1 | KFC | 4 | |
| American Eagle Outfitters | 1 | Kincaid | 2 | |
| Ann Taylor | 3 | Kohl's | 2 | |
| Applebee's | 1 | LA Fitness | 2 | |
| Arby's | 2 | La-Z-Boy | 1 | |
| Ashley Furniture | 1 | Lane Furniture | 3 | |
| Avenue | 1 | LensCrafters | 1 | |
| BMW | 1 | Levi Strauss & Co. | 1 | |
| Baja Fresh Mexican Grill | 1 | Little Caesars Pizza | 1 | |
| Banana Republic | 2 | Lowe's | 1 | |
| Baskin-Robbins | 3 | Macy's | 1 | |
| Bath & Body Works | 1 | Marriott | 7 | |
| Bed Bath & Beyond | 3 | Marshalls | 2 | |
| Ben & Jerry's | 1 | MasterBrand Cabinets | 24 | |
| Best Western | 2 | McDonald's | 14 | |
| Blockbuster | 6 | Men's Wearhouse | 2 | |
| Brooks Brothers | 2 | Motherhood Maternity | 3 | |
| Brookstone | 2 | New Balance | 7 | |
| Budget Car Rental | 2 | New York & Co | 1 | |
| Buffalo Wild Wings | 2 | Nike | 29 | |
| Burger King | 6 | Nissan | 1 | |
| CVS | 5 | Nordstrom | 2 | |
| Cache | 1 | Office Depot | 2 | |
| CarMax | 1 | Old Navy | 2 | |
| Caribou Coffee | 4 | Olive Garden | 1 | |
| Casual Male XL | 1 | Outback | 1 | |
| Charlotte Russe | 2 | Outback Steakhouse | 1 | |
| Chevrolet | 2 | Pac Sun | 2 | |
| Chick-Fil-A | 3 | Panera Bread | 4 | |
| Chico's | 1 | Papa John's Pizza | 7 | |
| Chipotle | 3 | Payless | 2 | |
| Chuck E. Cheese's | 1 | Penske | 1 | |
| Circle K | 8 | PetSmart | 2 | |
| Clarks | 1 | Pier 1 Imports | 2 | |
| Cold Stone Creamery | 4 | Pizza Hut | 5 | |
| Coldwater Creek | 1 | Plato's Closet | 1 | |
| Comfort Inn | 1 | Popeyes | 4 | |
| Comfort Suites | 1 | Pottery Barn | 1 | |
| Costco | 2 | Pottery Barn Kids | 1 | |
| Cricket Wireless | 7 | Quiznos | 5 | |
| Curves | 2 | RadioShack | 3 | |
| DHL | 4 | Red Lobster | 1 | |
| Dairy Queen | 2 | Red Robin | 2 | |
| Decora Cabinetry | 4 | Rite Aid | 4 | |
| Domino's Pizza | 2 | Ruby Tuesday | 3 | |
| DressBarn | 2 | Safeway | 5 | |
| Dressbarn | 2 | Sam's Club | 1 | |
| Dunkin Donuts | 7 | Sears | 2 | |
| Eddie Bauer | 1 | Skechers USA | 1 | |
| Express | 1 | Spencer Gifts | 1 | |
| Extended Stay America | 1 | Sprint Nextel | 4 | |
| Famous Footwear | 2 | Staples | 2 | |
| FedEx | 50 | Starbucks | 26 | |
| Finish Line | 1 | Subaru | 1 | |
| Firestone Complete Auto Care | 1 | Suburban | 1 | |
| Foot Locker | 1 | Subway | 24 | |
| Ford | 2 | T-Mobile | 8 | |
| GNC | 5 | T.G.I. Driday's | 1 | |
| GameStop | 3 | T.J.Maxx | 1 | |
| Gap | 2 | Taco Bell | 6 | |
| Giant | 9 | Talbots | 1 | |
| Gymboree | 2 | Target | 3 | |
| H&M | 1 | The Cheesecake Factory | 1 | |
| H&R Block | 4 | The Room Place | 2 | |
| Haagen-Dazs | 1 | Toyota | 1 | |
| Havertys Furniture | 1 | Toys"R"Us | 2 | |
| Hilton | 3 | U-Haul | 7 | |
| Holiday Inn | 3 | UPS | 52 | |
| Hollister Co. | 1 | Value City Furniture | 1 | |
| Home Depot | 4 | Vans | 3 | |
| Homestead Studio Suites | 1 | Verizon Wireless | 6 | |
| Honda | 1 | Victoria's Secret | 1 | |
| Hot Topic | 1 | Volkswagen | 1 | |
| Hyundai | 1 | Vons | 5 | |
| IHOP | 3 | Walgreens | 7 | |
| IZOD | 1 | Walmart | 2 | |
| J.Crew | 1 | Wendy's | 6 | |
Loudoun County on our top lists:
- #2 on the list of "Top 101 counties with the lowest number of deaths per 1000 residents 2007-2013 (pop. 50,000+)"
- #4 on the list of "Top 101 counties with the largest number of children under 18 without health insurance coverage in 2000 (pop. 50,000+)"
- #13 on the list of "Top 101 counties with the largest decrease in the number of births per 1000 residents 2000-2006 to 2007-2013 (pop 50,000+)"
- #24 on the list of "Top 101 counties with the lowest number of deaths per 1000 residents 2007-2013"
- #25 on the list of "Top 101 counties with the largest number of people without health insurance coverage in 2000 (pop. 50,000+)"
- #32 on the list of "Top 101 counties with the highest percentage of residents relocating to foreign countries in 2011 (pop. 50,000+)"
- #37 on the list of "Top 101 counties with the highest percentage of residents relocating from foreign countries between 2010 and 2011 (pop. 50,000+)"
- #39 on the list of "Top 101 counties with the largest number of people moving in compared to moving out (pop. 50,000+)"
- #43 on the list of "Top 101 counties with the highest number of births per 1000 residents 2007-2013"
- #43 on the list of "Top 101 counties with the highest number of births per 1000 residents 2007-2013 (pop 50,000+)"
- #48 on the list of "Top 101 counties with the highest percentage of residents relocating to foreign countries in 2011"
- #50 on the list of "Top 101 counties with the largest number of children under 18 without health insurance coverage in 2000"
- #59 on the list of "Top 101 counties with the highest percentage of residents relocating from foreign countries between 2010 and 2011"
- #68 on the list of "Top 101 counties with the largest decrease in the number of deaths per 1000 residents 2000-2006 to 2007-2013 (pop. 50,000+)"
- #75 on the list of "Top 101 counties with the most Other adherents (pop. 50,000+)"
- #78 on the list of "Top 101 counties with the most Other adherents"
- #85 on the list of "Top 101 counties with the lowest Nitrogen Dioxide air pollution readings in 2012 (ppm)"
- #92 on the list of "Top 101 counties with the highest percentage of residents relocating from other counties between 2010 and 2011 (pop. 50,000+)"