Jefferson County, West Virginia (WV)
County owner-occupied free and clear houses and condos in 2010: 3,561
County owner-occupied houses and condos in 2000: 12,262
Renter-occupied apartments: 4,630 (it was 3,903 in 2000)
| % of renters here: | 24% |
| State: | 27% |
Land area: 210 sq. mi.
Water area: 2.0 sq. mi.
Population density: 274 people per square mile (high).
Industries providing employment: Educational, health and social services (21.6%), Professional, scientific, management, administrative, and waste management services (14.1%), Retail trade (11.9%), Construction (10.3%), Arts, entertainment, recreation, accommodation and food services (10.2%).
Type of workers:
- Private wage or salary: 72%
- Government: 22%
- Self-employed, not incorporated: 6%
- Unpaid family work: 0%
- OSM Map
- General Map
- Google Map
- MSN Map


- 46,46080.2%White Non-Hispanic Alone
- 3,9106.8%Hispanic or Latino
- 3,1495.4%Two or more races
- 3,1225.4%Black Non-Hispanic Alone
- 7501.3%Asian alone
- 5310.9%Some other race alone

| Median resident age: | 41.3 years |
| West Virginia median age: | 42.9 years |
| Males: 28,542 | |
| Females: 28,924 |

 | Jefferson County commuting to NoVa (7 replies) |
| 6500 Homes in Jefferson County (5 replies) |
| Is WV really as depressing as portrayed? (74 replies) |
| Jefferson County School Board Threatens to Condemn Rockwool Property (3 replies) |
| Martinsburg Mall Redevelopment Project (724 replies) |
| Stores in Ranson and Charles Town (38 replies) |
| Jefferson County: | 2.0 people |
| West Virginia: | 2 people |
Estimated median household income in 2022: $92,236 ($44,374 in 1999)
| This county: | $92,236 |
| West Virginia: | $54,329 |
Median contract rent in 2022 for apartments: $865 (lower quartile is $580, upper quartile is $1,174)
| This county: | $865 |
| State: | $606 |
Estimated median house or condo value in 2022: $322,753 (it was $110,500 in 2000)
| Jefferson: | $322,753 |
| West Virginia: | $155,100 |
Median monthly housing costs for homes and condos with a mortgage: $1,752
Median monthly housing costs for units without a mortgage: $441
Institutionalized population: 218
Crime in 2021 (reported by the sheriff's office or county police, not the county total):
- Murders: 1
- Rapes: 9
- Robberies: 0
- Assaults: 12
- Burglaries: 26
- Thefts: 154
- Auto thefts: 19
Crime in 2020 (reported by the sheriff's office or county police, not the county total):
- Murders: 1
- Rapes: 8
- Robberies: 2
- Assaults: 17
- Burglaries: 29
- Thefts: 156
- Auto thefts: 17

Single-family new house construction building permits:
- 2022: 269 buildings, average cost: $304,400
- 2021: 392 buildings, average cost: $297,500
- 2020: 250 buildings, average cost: $263,500
- 2019: 197 buildings, average cost: $268,400
- 2018: 207 buildings, average cost: $267,900
- 2017: 274 buildings, average cost: $249,400
- 2016: 159 buildings, average cost: $270,200
- 2015: 204 buildings, average cost: $253,400
- 2014: 200 buildings, average cost: $253,100
- 2013: 230 buildings, average cost: $244,800
- 2012: 136 buildings, average cost: $214,200
- 2011: 135 buildings, average cost: $226,600
- 2010: 159 buildings, average cost: $213,200
- 2009: 173 buildings, average cost: $195,400
- 2008: 219 buildings, average cost: $229,500
- 2007: 487 buildings, average cost: $249,200
- 2006: 547 buildings, average cost: $251,800
- 2005: 527 buildings, average cost: $255,100
- 2004: 540 buildings, average cost: $204,800
- 2003: 800 buildings, average cost: $202,900
- 2002: 674 buildings, average cost: $177,300
- 2001: 467 buildings, average cost: $116,900
- 2000: 434 buildings, average cost: $115,200
- 1999: 407 buildings, average cost: $113,700
- 1998: 386 buildings, average cost: $114,400
- 1997: 323 buildings, average cost: $112,800


Median real estate property taxes paid for housing units with mortgages in 2022: $1,840 (0.5%)
Median real estate property taxes paid for housing units with no mortgage in 2022: $1,476 (0.6%)


| Jefferson County: | 9.7% |
| West Virginia: | 17.9% |
Median age of residents in 2022: 41.3 years old
(Males: 40.9 years old, Females: 41.4 years old)
(Median age for: White residents: 43.6 years old, Black residents: 44.5 years old, American Indian residents: 26.9 years old, Asian residents: 40.8 years old, Hispanic or Latino residents: 31.3 years old, Other race residents: 33.5 years old)
Fair market rent in 2006 for a 1-bedroom apartment in Jefferson County is $544 a month.
Fair market rent for a 2-bedroom apartment is $620 a month.
Fair market rent for a 3-bedroom apartment is $905 a month.
Cities in this county include: Kabletown district, Shepherdstown district, Shannondale, Corporation of Ranson, Charles Town, Bolivar, Shepherdstown, Shenandoah Junction, Middleway, Harpers Ferry.
Neighboring counties: Gloucester County, New Jersey  , Crawford County, Illinois
  , Queen Anne's County, Maryland , Lake County, Colorado , Wirt County , Ralls County, Missouri , Randolph County, Missouri .
| Here: | 2.7% |
| West Virginia: | 4.0% |


Current college students: 2,359
People 25 years of age or older with a high school degree or higher: 90.4%
People 25 years of age or older with a bachelor's degree or higher: 32.2%
Number of foreign born residents: 2,863 (58.8% naturalized citizens)
| Jefferson County: | 5.0% |
| Whole state: | 1.8% |

- Year of entry for the foreign-born population
- 7412010 or later
- 1,0472000 to 2009
- 4151990 to 1999
- 2461980 to 1989
- 1831970 to 1979
- 185Before 1970
Mean travel time to work (commute): & minutes
Percentage of county residents living and working in this county: 57.0%


Housing units in structures:
- One, detached: 18,724
- One, attached: 1,802
- Two: 245
- 3 or 4: 456
- 5 to 9: 544
- 10 to 19: 614
- 20 to 49: 118
- 50 or more: 100
- Mobile homes: 1,418
Housing units in Jefferson County with a mortgage: 13,088 (1,148 second mortgage, 83 home equity loan, 817 both second mortgage and home equity loan)
Houses without a mortgage: 156
| Here: | 7.7% with mortgage |
| State: | 97.1% with mortgage |
Religion statistics for Jefferson County
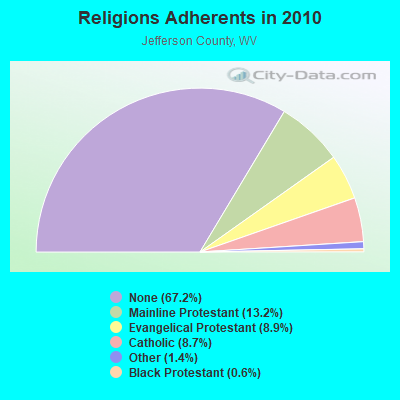
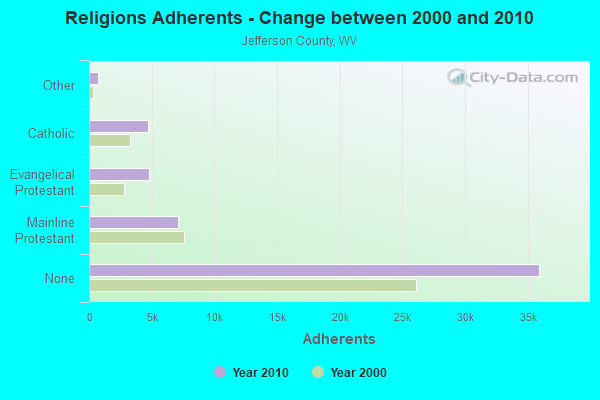
| Religion | Adherents | Congregations |
|---|---|---|
| Mainline Protestant | 7,083 | 37 |
| Evangelical Protestant | 4,756 | 27 |
| Catholic | 4,679 | 2 |
| Other | 729 | 5 |
| Black Protestant | 307 | 2 |
| None | 35,944 | - |
Source: Clifford Grammich, Kirk Hadaway, Richard Houseal, Dale E.Jones, Alexei Krindatch, Richie Stanley and Richard H.Taylor. 2012. 2010 U.S.Religion Census: Religious Congregations & Membership Study. Association of Statisticians of American Religious Bodies. Jones, Dale E., et al. 2002. Congregations and Membership in the United States 2000. Nashville, TN: Glenmary Research Center.
Food Environment Statistics:
| Jefferson County: | 1.58 / 10,000 pop. |
| State: | 2.41 / 10,000 pop. |
| Here: | 0.20 / 10,000 pop. |
| West Virginia: | 0.28 / 10,000 pop. |
| This county: | 0.98 / 10,000 pop. |
| West Virginia: | 1.09 / 10,000 pop. |
| Jefferson County: | 3.15 / 10,000 pop. |
| West Virginia: | 5.38 / 10,000 pop. |
| This county: | 7.68 / 10,000 pop. |
| State: | 6.22 / 10,000 pop. |
| Jefferson County: | 9.3% |
| West Virginia: | 12.2% |
| Jefferson County: | 30.0% |
| State: | 31.1% |
| Here: | 17.0% |
| State: | 13.1% |
Agriculture in Jefferson County:
Average size of farms: 152 acresAverage value of agricultural products sold per farm: $36,584
Average value of crops sold per acre for harvested cropland: $185.08
The value of nursery, greenhouse, floriculture, and sod as a percentage of the total market value of agricultural products sold: 2.42%
The value of livestock, poultry, and their products as a percentage of the total market value of agricultural products sold: 58.95%
Average total farm production expenses per farm: $46,886
Harvested cropland as a percentage of land in farms: 53.50%
Irrigated harvested cropland as a percentage of land in farms: 0.92%
Average market value of all machinery and equipment per farm: $45,349
The percentage of farms operated by a family or individual: 89.87%
Average age of principal farm operators: 57 years
Average number of cattle and calves per 100 acres of all land in farms: 20.13
Milk cows as a percentage of all cattle and calves: 19.56%
Corn for grain: 9660 harvested acres
All wheat for grain: 3797 harvested acres
Soybeans for beans: 8181 harvested acres
Vegetables: 96 harvested acres
Land in orchards: 1,078 acres
Earthquake activity:
Jefferson County-area historical earthquake activity is significantly above West Virginia state average. It is 54% smaller than the overall U.S. average.On 8/23/2011 at 17:51:04, a magnitude 5.8 (5.8 MW, Depth: 3.7 mi, Class: Moderate, Intensity: VI - VII) earthquake occurred 96.6 miles away from Jefferson County center
On 9/25/1998 at 19:52:52, a magnitude 5.2 (4.8 MB, 4.3 MS, 5.2 LG, 4.5 MW, Depth: 3.1 mi) earthquake occurred 202.4 miles away from the county center
On 8/25/2011 at 05:07:52, a magnitude 4.5 (4.5 ML, Depth: 4.2 mi, Class: Light, Intensity: IV - V) earthquake occurred 94.1 miles away from the county center
On 1/16/1994 at 01:49:16, a magnitude 4.6 (4.6 MB, 4.6 LG, Depth: 3.1 mi) earthquake occurred 119.3 miles away from the county center
On 12/9/2003 at 20:59:18, a magnitude 4.5 (4.5 ML, Depth: 6.2 mi) earthquake occurred 106.8 miles away from Jefferson County center
On 12/9/2003 at 20:59:14, a magnitude 4.5 (4.5 MB, 4.5 LG) earthquake occurred 118.8 miles away from the county center
Magnitude types: regional Lg-wave magnitude (LG), body-wave magnitude (MB), local magnitude (ML), surface-wave magnitude (MS), moment magnitude (MW)
Most recent natural disasters:
- West Virginia Covid-19 Pandemic, Incident Period: January 20, 2020, Major Disaster (Presidential) Declared DR-4517-WV: April 3, 2020, FEMA Id: 4517, Natural disaster type: Other
- West Virginia Severe Storms, Flooding, Landslides, And Mudslides, Incident Period: May 28, 2018 - June 3, 2018, FEMA Id: 4378, Natural disaster type: Storm, Mudslide, Landslide, Flood
- West Virginia Hurricane Sandy, Incident Period: October 29, 2012 to November 08, 2012, Emergency Declared EM-3358: October 29, 2012, FEMA Id: 3358, Natural disaster type: Hurricane
- West Virginia Severe Storms, Incident Period: June 29, 2012 to July 10, 2012, Emergency Declared EM-3345: June 30, 2012, FEMA Id: 3345, Natural disaster type: Storm
- West Virginia Severe Storms and Straight-Line Winds, Incident Period: June 29, 2012 to July 08, 2012, Major Disaster (Presidential) Declared DR-4071: July 23, 2012, FEMA Id: 4071, Natural disaster type: Storm, Wind
- West Virginia Severe Winter Storms and Snowstorms, Incident Period: February 05, 2010 to February 11, 2010, Major Disaster (Presidential) Declared DR-1903: April 23, 2010, FEMA Id: 1903, Natural disaster type: Snowstorm, Winter Storm
- West Virginia Severe Winter Storm and Snowstorm, Incident Period: December 18, 2009 to December 20, 2009, Major Disaster (Presidential) Declared DR-1881: March 02, 2010, FEMA Id: 1881, Natural disaster type: Snowstorm, Winter Storm
- West Virginia Severe Storms, Tornadoes, Flooding, Mudslides, and Landslides, Incident Period: June 03, 2008 to June 07, 2008, Major Disaster (Presidential) Declared DR-1769: June 19, 2008, FEMA Id: 1769, Natural disaster type: Storm, Tornado, Mudslide, Landslide, Flood
- West Virginia Hurricane Katrina Evacuation, Incident Period: August 29, 2005 to October 01, 2005, Emergency Declared EM-3221: September 05, 2005, FEMA Id: 3221, Natural disaster type: Hurricane
- West Virginia Hurricane Isabel, Incident Period: September 18, 2003 to September 30, 2003, Major Disaster (Presidential) Declared DR-1496: September 23, 2003, FEMA Id: 1496, Natural disaster type: Hurricane
- 6 other natural disasters have been reported since 1953.
The number of natural disasters in Jefferson County (16) is near the US average (15).
Major Disasters (Presidential) Declared: 11
Emergencies Declared: 4
Causes of natural disasters: Storms: 5, Floods: 4, Hurricanes: 4, Winter Storms: 3, Landslides: 2, Mudslides: 2, Snowstorms: 2, Blizzard: 1, Snowfall: 1, Tornado: 1, Tropical Storm: 1, Wind: 1, Other: 1 (Note: some incidents may be assigned to more than one category).

Means of transportation to work:
- Drove a car alone: 13,488 (68.7%)
- Carpooled: 1,175 (6.0%)
- Bus: 13 (0.1%)
- Subway or elevated rail: 9 (0.0%)
- Long-distance train or commuter rail: 21 (0.1%)
- Taxicab, motorcycle, or other means: 367 (1.9%)
- Bicycle: 32 (0.2%)
- Walked: 466 (2.4%)
- Worked at home: 4,857 (24.7%)


- Health care and social assistance (17%)
- Educational services (14%)
- Retail trade (11%)
- Accommodation and food services (7%)
- Professional, scientific, and technical services (7%)
- Public administration (6%)
- Finance and insurance (5%)

- Health care and social assistance (19%)
- Educational services (17%)
- Retail trade (12%)
- Accommodation and food services (8%)
- Professional, scientific, and technical services (8%)
- Public administration (6%)
- Finance and insurance (5%)

- Management occupations (14%)
- Construction and extraction occupations (10%)
- Computer and mathematical occupations (9%)
- Sales and related occupations (7%)
- Business and financial operations occupations (7%)
- Material moving occupations (6%)
- Production occupations (5%)

- Office and administrative support occupations (15%)
- Management occupations (12%)
- Educational instruction, and library occupations (11%)
- Business and financial operations occupations (10%)
- Sales and related occupations (9%)
- Health diagnosing and treating practitioners and other technical occupations (8%)
- Food preparation and serving related occupations (5%)

- Mexico (15%)
- El Salvador (8%)
- Philippines (6%)
- Germany (5%)
- Peru (5%)
- England (5%)
- Burma (Myanmar) (4%)

- German (13%)
- American (13%)
- English (12%)
- Irish (7%)
- Italian (6%)
- European (4%)
- Scotch-Irish (2%)


People in group quarters in Jefferson County, West Virginia in 2010:
- 1,038 people in college/university student housing
- 218 people in nursing facilities/skilled-nursing facilities
- 130 people in workers' group living quarters and job corps centers
- 5 people in group homes intended for adults
People in group quarters in Jefferson County, West Virginia in 2000:
- 909 people in college dormitories (includes college quarters off campus)
- 177 people in nursing homes
- 53 people in job corps and vocational training facilities
- 6 people in homes for the mentally ill
9.32% of this county's 2021 resident taxpayers lived in other counties in 2020 ($75,098 average adjusted gross income)
| Here: | 9.32% |
| West Virginia average: | 5.74% |
10 or fewer of this county's residents moved from foreign countries.
2.15% relocated from other counties in West Virginia ($13,394 average AGI)
7.16% relocated from other states ($61,705 average AGI)
Jefferson County: 7.16% West Virginia average: 3.02%

Top counties from which taxpayers relocated into this county between 2020 and 2021:
| from Berkeley County, WV | |
| from Loudoun County, VA | |
| from Frederick County, MD | |
| from Fairfax County, VA | |
| from Frederick County, VA | |
| from Montgomery County, MD | |
| from Washington County, MD |
8.21% of this county's 2020 resident taxpayers moved to other counties in 2021 ($66,106 average adjusted gross income)
| Here: | 8.21% |
| West Virginia average: | 5.65% |
10 or fewer of this county's residents moved to foreign countries.
3.09% relocated to other counties in West Virginia ($19,206 average AGI)
5.12% relocated to other states ($46,900 average AGI)
Jefferson County: 5.12% West Virginia average: 2.93%

Top counties to which taxpayers relocated from this county between 2020 and 2021:
| to Berkeley County, WV | |
| to Loudoun County, VA | |
| to Frederick County, MD | |
| to Washington County, MD | |
| to Frederick County, VA | |
| to Fairfax County, VA | |
| to Montgomery County, MD |
Births per 1000 population from 1990 to 1999: 12.8
Births per 1000 population from 2000 to 2006: 13.2

Deaths per 1000 population from 1990 to 1999: 8.4
Deaths per 1000 population from 2000 to 2009: 8.3
Deaths per 1000 population from 2010 to 2020: 8.6

Infant deaths per 1000 live births from 1990 to 1999: 6.7
Infant deaths per 1000 live births from 2000 to 2006: 6.6

Persons under 19 years old without health insurance coverage in 2018: 3.3%


Persons enrolled in hospital insurance and/or supplemental medical insurance (Medicare) in July 1, 2007: 6,662 (5,490 aged, 1,172 disabled)
Children under 18 without health insurance coverage in 2007: 1,477 (11%)


Most common underlying causes of death in Jefferson County, West Virginia in 1999 - 2019:
- Bronchus or lung, unspecified - Malignant neoplasms (654)
- Atherosclerotic heart disease (478)
- Chronic obstructive pulmonary disease, unspecified (389)
- Congestive heart failure (381)
- Acute myocardial infarction, unspecified (322)
- Alzheimer disease, unspecified (243)
- Unspecified dementia (215)
- Stroke, not specified as haemorrhage or infarction (207)
- Chronic ischaemic heart disease, unspecified (139)
- Colon, unspecified - Malignant neoplasms (113)
Population without health insurance coverage in 2000: 10%
Children under 18 without health insurance coverage in 2000: 7%
Short term general hospital admissions per 100,000 population in 2004: 4,805
Short term general hospital beds per 100,000 population in 2004: 126
Emergency room visits per 100,000 population in 2004: 41,567
General practice office based MDs per 100,000 population in 2005: 1,290
Medical specialist MDs per 100,000 population in 2005: 778
Dentists per 100,000 population in 1998: 2
Total births per 100,000 population, July 2005 - July 2006 : 22
Total deaths per 100,000 population, July 2005 - July 2006: 77
Limited-service eating places per 100,000 population in 2005 : 6
Beer, wine & liquor stores per 100,000 population in 2005: 1
Suicides per 1,000,000 population from 2000 to 2006: 115.1. This is less than state average.

- Firearm - 77.8
- Other - 37.3
Household type by relationship:
Households: 57,466- Male householders: 11,244 (2,791 living alone), Female householders: 10,822 (2,548 living alone)
11,389 spouses (11,348 opposite-sex spouses), 1,885 unmarried partners, (1,839 opposite-sex unmarried partners), 15,442 children (13,820 natural, 342 adopted, 1,222 stepchildren), 1,483 grandchildren, 367 brothers or sisters, 832 parents, 67 foster children, 847 other relatives, 1,601 non-relatives
- In group quarters: 1,381
Size of family households: 6,415 2-persons, 3,581 3-persons, 2,747 4-persons, 1,650 5-persons, 404 6-persons, 400 7-or-more-persons.
Size of nonfamily households: 5,332 1-person, 1,359 2-persons, 58 3-persons, 48 4-persons, 22 7-or-more-persons.
7,732 married couples with children.
2,549 single-parent households (714 men, 1,835 women).
94.0% of residents of Jefferson speak English at home.
3.7% of residents speak Spanish at home (63% speak English very well, 25% speak English well, 12% speak English not well).
1.2% of residents speak other Indo-European language at home (83% speak English very well, 16% speak English well, 1% speak English not well).
1.0% of residents speak Asian or Pacific Island language at home (50% speak English very well, 30% speak English well, 8% speak English not well, 11% don't speak English at all).
0.1% of residents speak other language at home (79% speak English very well, 21% speak English well).
In fiscal year 2004:
Federal Government expenditure: $341,188,000 ($7,158 per capita)
Department of Defense expenditure: $10,482,000
Federal direct payments to individuals for retirement and disability: $125,810,000
Federal other direct payments to individuals: $37,516,000
Federal direct payments not to individuals: $1,331,000
Federal grants: $36,641,000
Federal procurement contracts: $92,699,000 ($315,000 Department of Defense)
Federal salaries and wages: $47,191,000 ($0,000 Department of Defense)
Federal Government direct loans: $28,469,000
Federal guaranteed/insured loans: $66,973,000
Federal Government insurance: $30,375,000
Population change from April 1, 2000 to July 1, 2005:
Births: 3,119| Here: | 63 per 1000 residents |
| State: | 60 per 1000 residents |
Deaths: 2,119
| Here: | 43 per 1000 residents |
| State: | 61 per 1000 residents |
Net international migration: +116
| Here: | +2 per 1000 residents |
| State: | +2 per 1000 residents |
Net internal migration: +5,991
| Here: | +122 per 1000 residents |
| State: | +6 per 1000 residents |

Total withdrawal of fresh water for public supply: 2.21 millions of gallons per day (86% from ground, 14% from surface)
| Here: | 7.3 |
| State: | 6.5 |
| Here: | 4.6 |
| State: | 4.7 |

- Year house built in Jefferson County, West Virginia
- 952020 or later
- 3,3852010 to 2019
- 6,3502000 to 2009
- 3,6021990 to 1999
- 2,8651980 to 1989
- 3,3441970 to 1979
- 1,6961960 to 1969
- 1,0811950 to 1959
- 2711940 to 1949
- 2,2181939 or earlier

- Rooms in owner-occupied houses in Jefferson County, West Virginia
- 941 room
- 112 rooms
- 2293 rooms
- 1,0414 rooms
- 2,1415 rooms
- 3,1746 rooms
- 2,8537 rooms
- 2,6888 rooms
- 5,6029+ rooms

- Rooms in renter-occupied apartments in Jefferson County, West Virginia
- 501 room
- 1992 rooms
- 7493 rooms
- 1,0834 rooms
- 8375 rooms
- 6346 rooms
- 5167 rooms
- 1608 rooms
- 2519+ rooms

- Bedrooms in owner-occupied houses in Jefferson County, West Virginia
- 106no bedroom
- 2771 bedroom
- 1,6512 bedrooms
- 8,8493 bedrooms
- 5,2474 bedrooms
- 1,6665+ bedrooms

- Bedrooms in renter-occupied apartments in Jefferson County, West Virginia
- 52no bedroom
- 1,0441 bedroom
- 1,4442 bedrooms
- 1,3803 bedrooms
- 5154 bedrooms
- 815+ bedrooms

- Cars and other vehicles available in Jefferson County in owner-occupied houses/condos
- 562no vehicle
- 3,4241 vehicle
- 7,2592 vehicles
- 3,7763 vehicles
- 1,5494 vehicles
- 9255+ vehicles

- Cars and other vehicles available in Jefferson County in renter-occupied apartments
- 645no vehicle
- 1,8741 vehicle
- 1,2532 vehicles
- 4383 vehicles
- 2004 vehicles
- 635+ vehicles
89.1% of Jefferson County residents lived in the same house 1 years ago.
Out of people who lived in different houses, 23% lived in this county.
Out of people who lived in different counties, 26% lived in West Virginia.
| Jefferson County: | 89.1% |
| State average: | 89.6% |
Place of birth for U.S.-born residents:
- This state: 15,036
- Other state: 39,922
- Northeast: 6,470
- Midwest: 3,991
- South: 26,918
- West: 2,705


- 71.7%Electricity
- 11.4%Bottled, tank, or LP gas
- 6.4%Fuel oil, kerosene, etc.
- 4.5%Wood
- 4.4%Utility gas
- 0.8%No fuel used
- 0.5%Other fuel
- 0.4%Solar energy

- 82.1%Electricity
- 7.1%Fuel oil, kerosene, etc.
- 4.7%Wood
- 2.5%Bottled, tank, or LP gas
- 1.6%Utility gas
- 1.0%Solar energy
- 0.5%No fuel used
- 0.3%Other fuel
- 0.2%Coal or coke
Private vs. public school enrollment:
| Here: | 22.0% |
| West Virginia: | 12.2% |
| Here: | 9.5% |
| West Virginia: | 8.8% |
| Here: | 19.3% |
| West Virginia: | 17.3% |


Jefferson County government finances - Expenditure in 2020:
- Charges - Other: $4,498,000
Other: $4,027,000
- Construction - General - Other: $2,838,000
General Public Buildings: $133,000
Parks and Recreation: $79,000
- Current Operations - Police Protection: $4,275,000
Police Protection: $4,099,000
Central Staff Services: $3,732,000
Central Staff Services: $3,444,000
Judicial and Legal Services: $1,864,000
Judicial and Legal Services: $1,844,000
General Public Buildings: $1,695,000
General Public Buildings: $1,659,000
Financial Administration: $1,655,000
Financial Administration: $1,644,000
Correctional Institutions: $1,583,000
Local Fire Protection: $1,494,000
Parks and Recreation: $1,149,000
Health - Other: $1,128,000
Natural Resources - Other: $1,040,000
Parks and Recreation: $1,014,000
Health - Other: $973,000
General - Other: $858,000
Natural Resources - Other: $822,000
Correctional Institutions: $759,000
General - Other: $706,000
Local Fire Protection: $665,000
Housing and Community Development: $548,000
Housing and Community Development: $525,000
Libraries: $330,000
Libraries: $330,000
Corrections - Other: $239,000
Corrections - Other: $196,000
Transit Utilities: $60,000
Transit Utilities: $20,000
- Federal Intergovernmental - Other: $2,641,000
Other: $624,000
Public Welfare: $131,000
Public Welfare: $114,000
- Local Intergovernmental - Other: $20,000
- Long Term Debt - Beginning Outstanding - Unspecified Public Purpose: $540,000
Outstanding Unspecified Public Purpose: $360,000
Retired Unspecified Public Purpose: $180,000
Retired Unspecified Public Purpose: $180,000
Beginning Outstanding - Unspecified Public Purpose: $180,000
- Miscellaneous - General Revenue - Other: $5,668,000
General Revenue - Other: $4,812,000
Special Assessments: $1,591,000
Special Assessments: $1,582,000
Fines and Forfeits: $481,000
Fines and Forfeits: $477,000
Rents: $318,000
Rents: $308,000
Interest Earnings: $120,000
Interest Earnings: $105,000
Donations From Private Sources: $38,000
Sale of Property: $11,000
Donations From Private Sources: $3,000
- Other Capital Outlay - Police Protection: $354,000
Police Protection: $302,000
Central Staff Services: $209,000
General Public Building: $152,000
Financial Administration: $93,000
Central Staff Services: $59,000
Financial Administration: $39,000
Protective Inspection and Regulation - Other: $24,000
General Public Building: $20,000
Local Fire Protection: $20,000
Parks and Recreation: $20,000
- Other Funds - Cash and Securities: $17,857,000
Cash and Securities: $12,698,000
- State Intergovernmental - Other: $3,045,000
General Local Government Support: $900,000
Health and Hospitals: $429,000
Health and Hospitals: $345,000
Other: $262,000
General Local Government Support: $173,000
Public Welfare: $102,000
Public Welfare: $76,000
- Tax - Property: $14,656,000
Property: $13,840,000
Other: $1,121,000
Other: $971,000
Other License: $473,000
Other License: $352,000
- Total Salaries and Wages: $10,747,000
: $10,267,000
Jefferson County government finances - Revenue in 2020:
- Charges - Other: $4,498,000
Other: $4,027,000
- Construction - General - Other: $2,838,000
General Public Buildings: $133,000
Parks and Recreation: $79,000
- Current Operations - Police Protection: $4,275,000
Police Protection: $4,099,000
Central Staff Services: $3,732,000
Central Staff Services: $3,444,000
Judicial and Legal Services: $1,864,000
Judicial and Legal Services: $1,844,000
General Public Buildings: $1,695,000
General Public Buildings: $1,659,000
Financial Administration: $1,655,000
Financial Administration: $1,644,000
Correctional Institutions: $1,583,000
Local Fire Protection: $1,494,000
Parks and Recreation: $1,149,000
Health - Other: $1,128,000
Natural Resources - Other: $1,040,000
Parks and Recreation: $1,014,000
Health - Other: $973,000
General - Other: $858,000
Natural Resources - Other: $822,000
Correctional Institutions: $759,000
General - Other: $706,000
Local Fire Protection: $665,000
Housing and Community Development: $548,000
Housing and Community Development: $525,000
Libraries: $330,000
Libraries: $330,000
Corrections - Other: $239,000
Corrections - Other: $196,000
Transit Utilities: $60,000
Transit Utilities: $20,000
- Federal Intergovernmental - Other: $2,641,000
Other: $624,000
Public Welfare: $131,000
Public Welfare: $114,000
- Local Intergovernmental - Other: $20,000
- Long Term Debt - Beginning Outstanding - Unspecified Public Purpose: $540,000
Outstanding Unspecified Public Purpose: $360,000
Retired Unspecified Public Purpose: $180,000
Retired Unspecified Public Purpose: $180,000
Beginning Outstanding - Unspecified Public Purpose: $180,000
- Miscellaneous - General Revenue - Other: $5,668,000
General Revenue - Other: $4,812,000
Special Assessments: $1,591,000
Special Assessments: $1,582,000
Fines and Forfeits: $481,000
Fines and Forfeits: $477,000
Rents: $318,000
Rents: $308,000
Interest Earnings: $120,000
Interest Earnings: $105,000
Donations From Private Sources: $38,000
Sale of Property: $11,000
Donations From Private Sources: $3,000
- Other Capital Outlay - Police Protection: $354,000
Police Protection: $302,000
Central Staff Services: $209,000
General Public Building: $152,000
Financial Administration: $93,000
Central Staff Services: $59,000
Financial Administration: $39,000
Protective Inspection and Regulation - Other: $24,000
General Public Building: $20,000
Local Fire Protection: $20,000
Parks and Recreation: $20,000
- Other Funds - Cash and Securities: $17,857,000
Cash and Securities: $12,698,000
- State Intergovernmental - Other: $3,045,000
General Local Government Support: $900,000
Health and Hospitals: $429,000
Health and Hospitals: $345,000
Other: $262,000
General Local Government Support: $173,000
Public Welfare: $102,000
Public Welfare: $76,000
- Tax - Property: $14,656,000
Property: $13,840,000
Other: $1,121,000
Other: $971,000
Other License: $473,000
Other License: $352,000
- Total Salaries and Wages: $10,747,000
: $10,267,000
Jefferson County government finances - Debt in 2020:
- Charges - Other: $4,498,000
Other: $4,027,000
- Construction - General - Other: $2,838,000
General Public Buildings: $133,000
Parks and Recreation: $79,000
- Current Operations - Police Protection: $4,275,000
Police Protection: $4,099,000
Central Staff Services: $3,732,000
Central Staff Services: $3,444,000
Judicial and Legal Services: $1,864,000
Judicial and Legal Services: $1,844,000
General Public Buildings: $1,695,000
General Public Buildings: $1,659,000
Financial Administration: $1,655,000
Financial Administration: $1,644,000
Correctional Institutions: $1,583,000
Local Fire Protection: $1,494,000
Parks and Recreation: $1,149,000
Health - Other: $1,128,000
Natural Resources - Other: $1,040,000
Parks and Recreation: $1,014,000
Health - Other: $973,000
General - Other: $858,000
Natural Resources - Other: $822,000
Correctional Institutions: $759,000
General - Other: $706,000
Local Fire Protection: $665,000
Housing and Community Development: $548,000
Housing and Community Development: $525,000
Libraries: $330,000
Libraries: $330,000
Corrections - Other: $239,000
Corrections - Other: $196,000
Transit Utilities: $60,000
Transit Utilities: $20,000
- Federal Intergovernmental - Other: $2,641,000
Other: $624,000
Public Welfare: $131,000
Public Welfare: $114,000
- Local Intergovernmental - Other: $20,000
- Long Term Debt - Beginning Outstanding - Unspecified Public Purpose: $540,000
Outstanding Unspecified Public Purpose: $360,000
Retired Unspecified Public Purpose: $180,000
Retired Unspecified Public Purpose: $180,000
Beginning Outstanding - Unspecified Public Purpose: $180,000
- Miscellaneous - General Revenue - Other: $5,668,000
General Revenue - Other: $4,812,000
Special Assessments: $1,591,000
Special Assessments: $1,582,000
Fines and Forfeits: $481,000
Fines and Forfeits: $477,000
Rents: $318,000
Rents: $308,000
Interest Earnings: $120,000
Interest Earnings: $105,000
Donations From Private Sources: $38,000
Sale of Property: $11,000
Donations From Private Sources: $3,000
- Other Capital Outlay - Police Protection: $354,000
Police Protection: $302,000
Central Staff Services: $209,000
General Public Building: $152,000
Financial Administration: $93,000
Central Staff Services: $59,000
Financial Administration: $39,000
Protective Inspection and Regulation - Other: $24,000
General Public Building: $20,000
Local Fire Protection: $20,000
Parks and Recreation: $20,000
- Other Funds - Cash and Securities: $17,857,000
Cash and Securities: $12,698,000
- State Intergovernmental - Other: $3,045,000
General Local Government Support: $900,000
Health and Hospitals: $429,000
Health and Hospitals: $345,000
Other: $262,000
General Local Government Support: $173,000
Public Welfare: $102,000
Public Welfare: $76,000
- Tax - Property: $14,656,000
Property: $13,840,000
Other: $1,121,000
Other: $971,000
Other License: $473,000
Other License: $352,000
- Total Salaries and Wages: $10,747,000
: $10,267,000
Jefferson County government finances - Cash and Securities in 2020:
- Charges - Other: $4,498,000
Other: $4,027,000
- Construction - General - Other: $2,838,000
General Public Buildings: $133,000
Parks and Recreation: $79,000
- Current Operations - Police Protection: $4,275,000
Police Protection: $4,099,000
Central Staff Services: $3,732,000
Central Staff Services: $3,444,000
Judicial and Legal Services: $1,864,000
Judicial and Legal Services: $1,844,000
General Public Buildings: $1,695,000
General Public Buildings: $1,659,000
Financial Administration: $1,655,000
Financial Administration: $1,644,000
Correctional Institutions: $1,583,000
Local Fire Protection: $1,494,000
Parks and Recreation: $1,149,000
Health - Other: $1,128,000
Natural Resources - Other: $1,040,000
Parks and Recreation: $1,014,000
Health - Other: $973,000
General - Other: $858,000
Natural Resources - Other: $822,000
Correctional Institutions: $759,000
General - Other: $706,000
Local Fire Protection: $665,000
Housing and Community Development: $548,000
Housing and Community Development: $525,000
Libraries: $330,000
Libraries: $330,000
Corrections - Other: $239,000
Corrections - Other: $196,000
Transit Utilities: $60,000
Transit Utilities: $20,000
- Federal Intergovernmental - Other: $2,641,000
Other: $624,000
Public Welfare: $131,000
Public Welfare: $114,000
- Local Intergovernmental - Other: $20,000
- Long Term Debt - Beginning Outstanding - Unspecified Public Purpose: $540,000
Outstanding Unspecified Public Purpose: $360,000
Retired Unspecified Public Purpose: $180,000
Retired Unspecified Public Purpose: $180,000
Beginning Outstanding - Unspecified Public Purpose: $180,000
- Miscellaneous - General Revenue - Other: $5,668,000
General Revenue - Other: $4,812,000
Special Assessments: $1,591,000
Special Assessments: $1,582,000
Fines and Forfeits: $481,000
Fines and Forfeits: $477,000
Rents: $318,000
Rents: $308,000
Interest Earnings: $120,000
Interest Earnings: $105,000
Donations From Private Sources: $38,000
Sale of Property: $11,000
Donations From Private Sources: $3,000
- Other Capital Outlay - Police Protection: $354,000
Police Protection: $302,000
Central Staff Services: $209,000
General Public Building: $152,000
Financial Administration: $93,000
Central Staff Services: $59,000
Financial Administration: $39,000
Protective Inspection and Regulation - Other: $24,000
General Public Building: $20,000
Local Fire Protection: $20,000
Parks and Recreation: $20,000
- Other Funds - Cash and Securities: $17,857,000
Cash and Securities: $12,698,000
- State Intergovernmental - Other: $3,045,000
General Local Government Support: $900,000
Health and Hospitals: $429,000
Health and Hospitals: $345,000
Other: $262,000
General Local Government Support: $173,000
Public Welfare: $102,000
Public Welfare: $76,000
- Tax - Property: $14,656,000
Property: $13,840,000
Other: $1,121,000
Other: $971,000
Other License: $473,000
Other License: $352,000
- Total Salaries and Wages: $10,747,000
: $10,267,000
Supplemental Security Income (SSI) in 2006:
- Total number of recipients: 751
- Number of aged recipients: 85
- Number of blind and disabled recipients: 666
- Number of recipients under 18: 106
- Number of recipients between 18 and 64: 497
- Number of recipients older than 64: 148
- Number of recipients also receiving OASDI: 290
- Amount of payments (thousands of dollars): 343
| Home Mortgage Disclosure Act Aggregated Statistics For Year 2009 (Based on 7 full tracts) | ||||||||||||||
| A) FHA, FSA/RHS & VA Home Purchase Loans | B) Conventional Home Purchase Loans | C) Refinancings | D) Home Improvement Loans | E) Loans on Dwellings For 5+ Families | F) Non-occupant Loans on < 5 Family Dwellings (A B C & D) | G) Loans On Manufactured Home Dwelling (A B C & D) | ||||||||
|---|---|---|---|---|---|---|---|---|---|---|---|---|---|---|
| Number | Average Value | Number | Average Value | Number | Average Value | Number | Average Value | Number | Average Value | Number | Average Value | Number | Average Value | |
| LOANS ORIGINATED | 435 | $197,446 | 235 | $186,523 | 1,180 | $206,909 | 85 | $76,694 | 3 | $813,333 | 109 | $171,339 | 32 | $101,062 |
| APPLICATIONS APPROVED, NOT ACCEPTED | 24 | $203,083 | 18 | $242,889 | 112 | $206,348 | 13 | $92,154 | 0 | $0 | 7 | $249,286 | 4 | $110,000 |
| APPLICATIONS DENIED | 73 | $175,726 | 58 | $132,517 | 666 | $226,637 | 59 | $67,288 | 0 | $0 | 43 | $154,698 | 28 | $79,357 |
| APPLICATIONS WITHDRAWN | 49 | $203,163 | 26 | $164,038 | 427 | $225,007 | 14 | $141,000 | 0 | $0 | 24 | $154,042 | 8 | $101,250 |
| FILES CLOSED FOR INCOMPLETENESS | 8 | $173,750 | 11 | $174,364 | 87 | $205,448 | 2 | $25,000 | 0 | $0 | 6 | $209,833 | 5 | $123,000 |
| Private Mortgage Insurance Companies Aggregated Statistics For Year 2009 (Based on 7 full tracts) | ||||
| A) Conventional Home Purchase Loans | B) Refinancings | |||
|---|---|---|---|---|
| Number | Average Value | Number | Average Value | |
| LOANS ORIGINATED | 18 | $208,278 | 20 | $245,950 |
| APPLICATIONS APPROVED, NOT ACCEPTED | 5 | $199,200 | 12 | $234,833 |
| APPLICATIONS DENIED | 0 | $0 | 6 | $275,833 |
| APPLICATIONS WITHDRAWN | 0 | $0 | 2 | $207,000 |
| FILES CLOSED FOR INCOMPLETENESS | 1 | $250,000 | 0 | $0 |


| Most common first names in Jefferson County, WV among deceased individuals | ||
| Name | Count | Lived (average) |
|---|---|---|
| John | 216 | 75.2 years |
| Mary | 216 | 79.6 years |
| Charles | 194 | 73.5 years |
| William | 193 | 74.3 years |
| James | 146 | 70.5 years |
| Robert | 136 | 72.1 years |
| George | 110 | 75.1 years |
| Margaret | 98 | 78.2 years |
| Dorothy | 77 | 78.6 years |
| Joseph | 73 | 71.4 years |
| Most common last names in Jefferson County, WV among deceased individuals | ||
| Last name | Count | Lived (average) |
|---|---|---|
| Jones | 63 | 76.0 years |
| Smith | 52 | 76.5 years |
| Jenkins | 39 | 75.8 years |
| Wilt | 37 | 75.2 years |
| Jackson | 36 | 69.4 years |
| Taylor | 35 | 76.0 years |
| Thompson | 35 | 74.1 years |
| Johnson | 35 | 71.6 years |
| Brown | 33 | 73.9 years |
| Dillow | 32 | 73.8 years |
| Businesses in Jefferson County, WV | ||||
| Name | Count | Name | Count | |
|---|---|---|---|---|
| 7-Eleven | 8 | Lane Furniture | 1 | |
| AT&T | 1 | Long John Silver's | 1 | |
| Applebee's | 1 | Martin's | 1 | |
| AutoZone | 1 | MasterBrand Cabinets | 4 | |
| Baskin-Robbins | 1 | McDonald's | 3 | |
| Burger King | 1 | New Balance | 1 | |
| CVS | 3 | Nike | 2 | |
| Chick-Fil-A | 1 | Panera Bread | 1 | |
| Clarion | 1 | Papa John's Pizza | 1 | |
| Comfort Inn | 2 | Payless | 1 | |
| Curves | 1 | Penske | 1 | |
| Dairy Queen | 2 | Pizza Hut | 1 | |
| Domino's Pizza | 2 | Quality | 1 | |
| Dunkin Donuts | 1 | RadioShack | 1 | |
| Famous Footwear | 1 | Rite Aid | 2 | |
| Fashion Bug | 1 | Ruby Tuesday | 1 | |
| FedEx | 7 | Sears | 1 | |
| Ford | 1 | Sprint Nextel | 1 | |
| GNC | 2 | Staples | 1 | |
| GameStop | 1 | Subway | 5 | |
| Goodwill | 2 | T-Mobile | 1 | |
| H&R Block | 2 | Taco Bell | 1 | |
| Holiday Inn | 1 | U-Haul | 5 | |
| Home Depot | 1 | U.S. Cellular | 1 | |
| IHOP | 1 | UPS | 4 | |
| KFC | 1 | Walmart | 1 | |
| Kohl's | 1 | Wendy's | 2 | |
| La-Z-Boy | 1 | |||