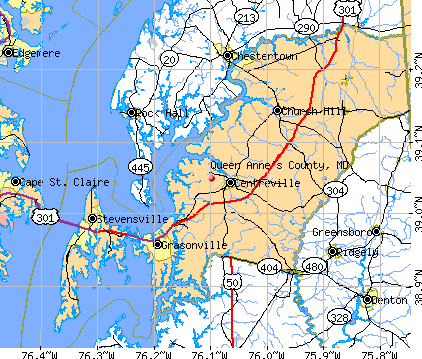
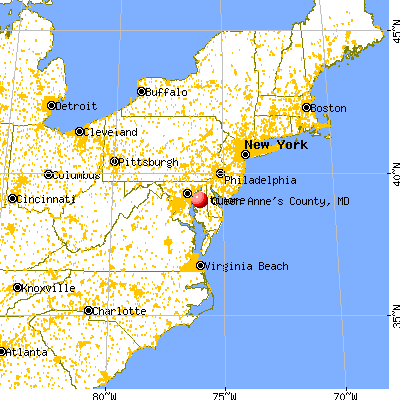
Queen Anne's County, Maryland (MD)
County owner-occupied free and clear houses and condos in 2010: 3,202
County owner-occupied houses and condos in 2000: 12,746
Renter-occupied apartments: 3,088 (it was 2,569 in 2000)
| % of renters here: | 17% |
| State: | 32% |
Land area: 372 sq. mi.
Water area: 137.6 sq. mi.
Population density: 135 people per square mile (average).
Industries providing employment: Educational, health and social services (22.3%), Professional, scientific, management, administrative, and waste management services (13.1%), Construction (11.0%), Retail trade (10.7%), Public administration (10.0%).
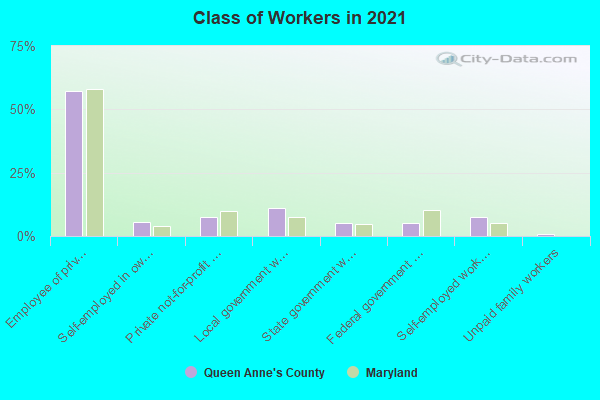
Type of workers:
- Private wage or salary: 72%
- Government: 19%
- Self-employed, not incorporated: 8%
- Unpaid family work: 1%
- OSM Map
- General Map
- Google Map
- MSN Map

- 41,17282.8%White Non-Hispanic Alone
- 2,9005.8%Black Non-Hispanic Alone
- 2,4154.9%Hispanic or Latino
- 2,2654.6%Two or more races
- 5631.1%Asian alone
- 4110.8%Some other race alone
- 90.02%American Indian and Alaska Native alone

| Median resident age: | 45.3 years |
| Maryland median age: | 39.7 years |
| Males: 25,055 | |
| Females: 25,285 |

 | Moving to work 3 days a week in DC. Queen Anne's Co schools and housing? (13 replies) |
| Coronavirus Count in Maryland (114 replies) |
| Is Sykesville/Eldersburg conservative? (34 replies) |
| Who gets to claim suburbs between Baltimore and DC? (27 replies) |
| It's official: Maryland is a NORTHEASTERN state! (262 replies) |
| Modern Baltimore (25 replies) |
| Queen Anne's County: | 2.0 people |
| Maryland: | 3 people |
Estimated median household income in 2022: $104,514 ($57,037 in 1999)
| This county: | $104,514 |
| Maryland: | $94,991 |
Median contract rent in 2022 for apartments: $1,291 (lower quartile is $868, upper quartile is $1,699)
| This county: | $1291 |
| State: | $1388 |
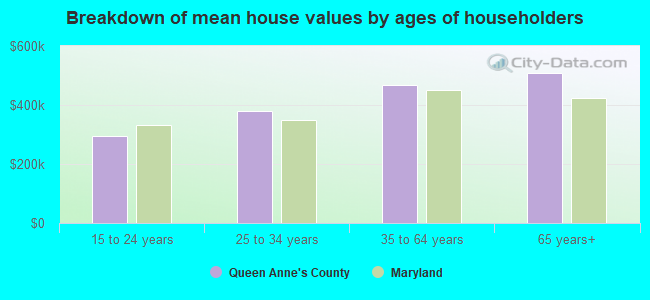
Estimated median house or condo value in 2022: $441,415 (it was $160,000 in 2000)
| Queen Anne's: | $441,415 |
| Maryland: | $398,100 |
Mean price in 2022:
Median monthly housing costs for homes and condos with a mortgage: $2,209Detached houses: $551,367
Here: $551,367 State: $526,819 Townhouses or other attached units: $427,341
Here: $427,341 State: $328,305 In 2-unit structures: $220,029
Here: $220,029 State: $346,599 In 3-to-4-unit structures: $59,373
Here: $59,373 State: $295,378 In 5-or-more-unit structures: $363,798
Here: $363,798 State: $350,378 Mobile homes: $284,885
Here: $284,885 State: $89,353
Median monthly housing costs for units without a mortgage: $719
Institutionalized population: 371
Crime in 2020 (reported by the sheriff's office or county police, not the county total):
- Murders: 0
- Rapes: 6
- Robberies: 5
- Assaults: 43
- Burglaries: 41
- Thefts: 160
- Auto thefts: 10
Crime in 2019 (reported by the sheriff's office or county police, not the county total):
- Murders: 0
- Rapes: 5
- Robberies: 4
- Assaults: 36
- Burglaries: 52
- Thefts: 249
- Auto thefts: 16
Health of residents in Queen Anne's County based on CDC Behavioral Risk Factor Surveillance System Survey Questionnaires from 2013 to 2021:
General health status score of residents in this county from 1 (poor) to 5 (excellent) is 3.5. This is about average.73.7% of residents exercised in the past month. This is about average.
41.4% of residents smoked 100+ cigarettes in their lives. This is about average.
56.5% of adult residents drank alcohol in the past 30 days. This is less than average.
72.1% of residents visited a dentist within the past year. This is about average.
Average weight of males is 198 pounds. This is about average.
Average weight of females is 166 pounds. This is about average.
Health of residents in Queen Anne's County based on CDC Behavioral Risk Factor Surveillance System Survey Questionnaires from 2003 to 2012:
General health status score of residents in this county from 1 (poor) to 5 (excellent) is 3.6. This is better than average.75.2% of residents exercised in the past month. This is about average.
50.6% of residents smoked 100+ cigarettes in their lives. This is about average.
99.1% of adult residents drank alcohol in the past 30 days. This is more than average.
77.8% of residents visited a dentist within the past year. This is more than average.
Average weight of males is 199 pounds. This is more than average.
Average weight of females is 159 pounds. This is about average.
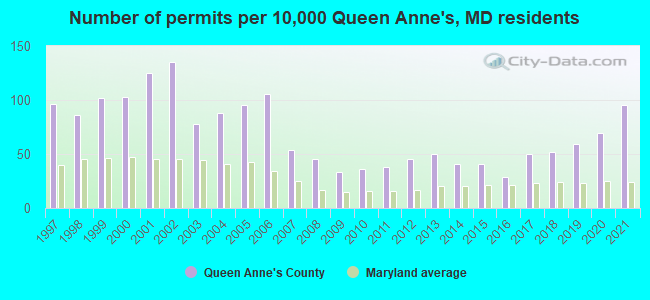
Single-family new house construction building permits:
- 2022: 317 buildings, average cost: $232,500
- 2021: 386 buildings, average cost: $228,500
- 2020: 281 buildings, average cost: $203,600
- 2019: 241 buildings, average cost: $211,000
- 2018: 209 buildings, average cost: $228,600
- 2017: 203 buildings, average cost: $248,000
- 2016: 119 buildings, average cost: $294,300
- 2015: 166 buildings, average cost: $205,100
- 2014: 168 buildings, average cost: $172,400
- 2013: 203 buildings, average cost: $174,800
- 2012: 184 buildings, average cost: $170,800
- 2011: 156 buildings, average cost: $196,900
- 2010: 145 buildings, average cost: $189,200
- 2009: 132 buildings, average cost: $163,300
- 2008: 183 buildings, average cost: $182,800
- 2007: 221 buildings, average cost: $239,900
- 2006: 431 buildings, average cost: $169,700
- 2005: 385 buildings, average cost: $151,800
- 2004: 356 buildings, average cost: $172,800
- 2003: 316 buildings, average cost: $171,900
- 2002: 549 buildings, average cost: $172,300
- 2001: 507 buildings, average cost: $156,300
- 2000: 419 buildings, average cost: $131,000
- 1999: 413 buildings, average cost: $128,500
- 1998: 349 buildings, average cost: $122,200
- 1997: 388 buildings, average cost: $112,000

Median real estate property taxes paid for housing units with mortgages in 2022: $3,410 (0.8%)
Median real estate property taxes paid for housing units with no mortgage in 2022: $3,392 (0.8%)


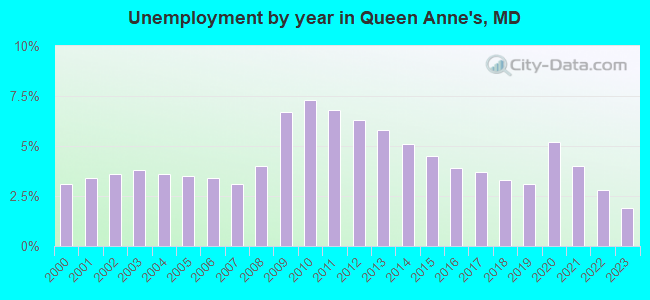
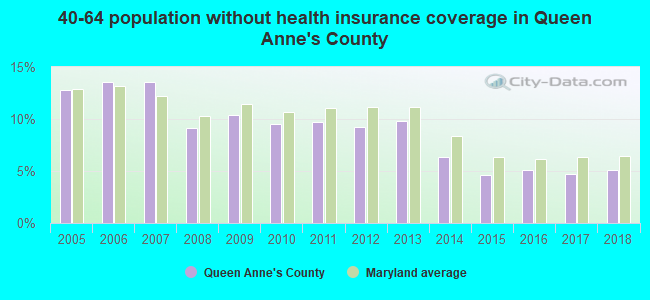
| Queen Anne's County: | 7.1% |
| Maryland: | 9.6% |
Median age of residents in 2022: 45.3 years old
(Males: 43.9 years old, Females: 46.3 years old)
(Median age for: White residents: 46.7 years old, Black residents: 46.7 years old, American Indian residents: 25.6 years old, Asian residents: 47.9 years old, Hispanic or Latino residents: 28.4 years old, Other race residents: 22.4 years old)
Area name: Baltimore-Towson, MD HUD Metro FMR Area
Fair market rent in 2006 for a 1-bedroom apartment in Queen Anne's County is $791 a month.
Fair market rent for a 2-bedroom apartment is $950 a month.
Fair market rent for a 3-bedroom apartment is $1220 a month.
Cities in this county include: District 5, Queenstown, Stevensville, Chester, Grasonville, Centreville, Kingstown, Queenstown, Kent Narrows, Church Hill, Sudlersville.
Neighboring counties: Jefferson County, West Virginia  , Jefferson County, Indiana , Jasper County, Illinois , Wirt County, West Virginia , Vigo County, Indiana , Randolph County, Missouri .
| Here: | 1.6% |
| Maryland: | 2.0% |
Current college students: 1,540
People 25 years of age or older with a high school degree or higher: 93.3%
People 25 years of age or older with a bachelor's degree or higher: 36.6%
Number of foreign born residents: 2,290 (47.0% naturalized citizens)
| Queen Anne's County: | 4.6% |
| Whole state: | 16.7% |
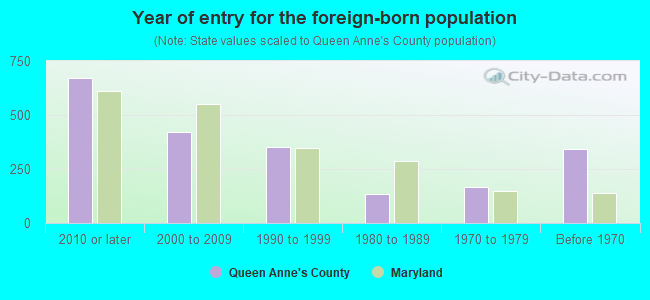
- Year of entry for the foreign-born population
- 9262010 or later
- 4752000 to 2009
- 3021990 to 1999
- 1331980 to 1989
- 1651970 to 1979
- 342Before 1970
Mean travel time to work (commute): ! minutes
Percentage of county residents living and working in this county: 96.1%


Housing units in structures:
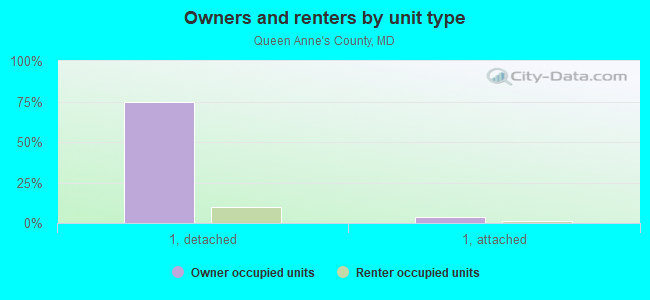
- One, detached: 17,838
- One, attached: 1,101
- Two: 149
- 3 or 4: 318
- 5 to 9: 778
- 10 to 19: 179
- 20 to 49: 278
- 50 or more: 136
- Mobile homes: 726
- Boats, RVs, vans, etc.: 12
Housing units in Queen Anne's County with a mortgage: 11,862 (1,490 second mortgage, 69 home equity loan, 1,278 both second mortgage and home equity loan)
Houses without a mortgage: 260
| Here: | 4.1% with mortgage |
| State: | 97.5% with mortgage |
Religion statistics for Queen Anne's County
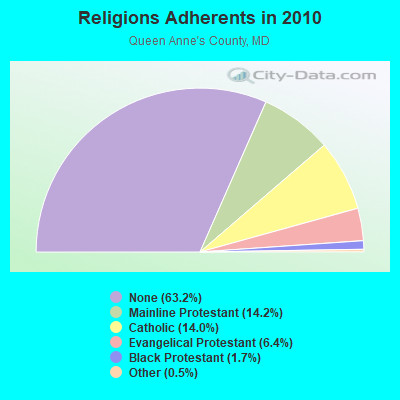
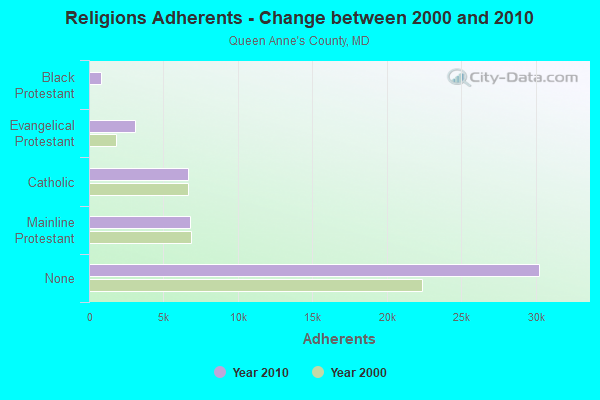
| Religion | Adherents | Congregations |
|---|---|---|
| Mainline Protestant | 6,786 | 31 |
| Catholic | 6,673 | 3 |
| Evangelical Protestant | 3,072 | 21 |
| Black Protestant | 805 | 5 |
| Other | 230 | 2 |
| None | 30,232 | - |
Source: Clifford Grammich, Kirk Hadaway, Richard Houseal, Dale E.Jones, Alexei Krindatch, Richie Stanley and Richard H.Taylor. 2012. 2010 U.S.Religion Census: Religious Congregations & Membership Study. Association of Statisticians of American Religious Bodies. Jones, Dale E., et al. 2002. Congregations and Membership in the United States 2000. Nashville, TN: Glenmary Research Center.
Food Environment Statistics:
| Queen Anne's County: | 2.36 / 10,000 pop. |
| State: | 1.96 / 10,000 pop. |
| This county: | 0.86 / 10,000 pop. |
| Maryland: | 1.22 / 10,000 pop. |
| Queen Anne's County: | 4.30 / 10,000 pop. |
| Maryland: | 2.05 / 10,000 pop. |
| This county: | 6.02 / 10,000 pop. |
| State: | 5.40 / 10,000 pop. |
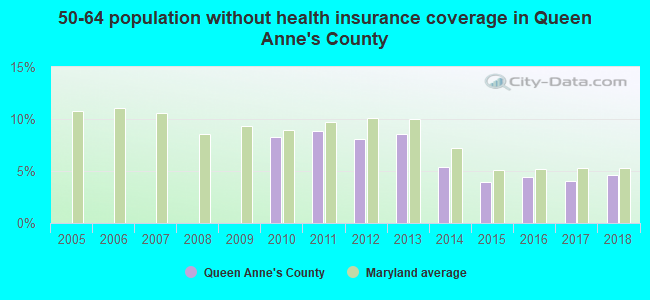
| Queen Anne's County: | 7.8% |
| Maryland: | 9.1% |
| Queen Anne's County: | 24.4% |
| State: | 26.7% |
| Here: | 13.3% |
| State: | 15.5% |
Agriculture in Queen Anne's County:
Average size of farms: 351 acresAverage value of agricultural products sold per farm: $149,038
Average value of crops sold per acre for harvested cropland: $365.22
The value of nursery, greenhouse, floriculture, and sod as a percentage of the total market value of agricultural products sold: 26.67%
The value of livestock, poultry, and their products as a percentage of the total market value of agricultural products sold: 31.15%
Average total farm production expenses per farm: $129,349
Harvested cropland as a percentage of land in farms: 80.01%
Average market value of all machinery and equipment per farm: $149,908
The percentage of farms operated by a family or individual: 79.91%
Average age of principal farm operators: 55 years
Average number of cattle and calves per 100 acres of all land in farms: 4.24
Milk cows as a percentage of all cattle and calves: 31.79%
Corn for grain: 44742 harvested acres
All wheat for grain: 27508 harvested acres
Soybeans for beans: 64878 harvested acres
Vegetables: 3,916 harvested acres
Land in orchards: 74 acres
Earthquake activity:
Queen Anne's County-area historical earthquake activity is significantly above Maryland state average. It is 62% smaller than the overall U.S. average.On 8/23/2011 at 17:51:04, a magnitude 5.8 (5.8 MW, Depth: 3.7 mi, Class: Moderate, Intensity: VI - VII) earthquake occurred 126.8 miles away from Queen Anne's County center
On 1/16/1994 at 01:49:16, a magnitude 4.6 (4.6 MB, 4.6 LG, Depth: 3.1 mi, Class: Light, Intensity: IV - V) earthquake occurred 88.7 miles away from the county center
On 11/30/2017 at 21:47:31, a magnitude 4.1 (4.1 MW, Depth: 6.1 mi) earthquake occurred 37.3 miles away from the county center
On 8/25/2011 at 05:07:52, a magnitude 4.5 (4.5 ML, Depth: 4.2 mi) earthquake occurred 126.6 miles away from the county center
On 12/9/2003 at 20:59:18, a magnitude 4.5 (4.5 ML, Depth: 6.2 mi) earthquake occurred 139.7 miles away from Queen Anne's County center
On 12/9/2003 at 20:59:14, a magnitude 4.5 (4.5 MB, 4.5 LG) earthquake occurred 140.7 miles away from the county center
Magnitude types: regional Lg-wave magnitude (LG), body-wave magnitude (MB), local magnitude (ML), moment magnitude (MW)
Most recent natural disasters:
- Maryland Severe Winter Storm and Snowstorm, Incident Period: January 22, 2016 to January 23, 2016, Major Disaster (Presidential) Declared DR-4261: March 04, 2016, FEMA Id: 4261, Natural disaster type: Snowstorm, Winter Storm
- Maryland Hurricane Sandy, Incident Period: October 26, 2012 to November 08, 2012, Emergency Declared EM-3349: October 28, 2012, FEMA Id: 3349, Natural disaster type: Hurricane
- Maryland Hurricane Sandy, Incident Period: October 26, 2012 to November 04, 2012, Major Disaster (Presidential) Declared DR-4091: November 20, 2012, FEMA Id: 4091, Natural disaster type: Hurricane
- Maryland Hurricane Irene, Incident Period: August 26, 2011 to September 05, 2011, Emergency Declared EM-3335: August 27, 2011, FEMA Id: 3335, Natural disaster type: Hurricane
- Maryland Hurricane Irene, Incident Period: August 24, 2011 to September 05, 2011, Major Disaster (Presidential) Declared DR-4034: September 16, 2011, FEMA Id: 4034, Natural disaster type: Hurricane
- Maryland Severe Winter Storms and Snowstorms, Incident Period: February 05, 2010 to February 11, 2010, Major Disaster (Presidential) Declared DR-1910: May 06, 2010, FEMA Id: 1910, Natural disaster type: Snowstorm, Winter Storm
- Maryland Severe Winter Storm and Snowstorm, Incident Period: December 18, 2009 to December 20, 2009, Major Disaster (Presidential) Declared DR-1875: February 19, 2010, FEMA Id: 1875, Natural disaster type: Snowstorm, Winter Storm
- Maryland Hurricane Katrina Evacuation, Incident Period: August 29, 2005 to October 01, 2005, Emergency Declared EM-3251: September 13, 2005, FEMA Id: 3251, Natural disaster type: Hurricane
- Maryland Hurricane Isabel, Incident Period: September 18, 2003 to September 29, 2003, Major Disaster (Presidential) Declared DR-1492: September 19, 2003, FEMA Id: 1492, Natural disaster type: Hurricane
- Maryland Snowstorm, Incident Period: February 14, 2003 to February 23, 2003, Emergency Declared EM-3179: March 14, 2003, FEMA Id: 3179, Natural disaster type: Snowstorm
- 4 other natural disasters have been reported since 1953.
The number of natural disasters in Queen Anne's County (14) is near the US average (15).
Major Disasters (Presidential) Declared: 9
Emergencies Declared: 5
Causes of natural disasters: Hurricanes: 7, Winter Storms: 5, Snowstorms: 4, Blizzard: 1, Snowfall: 1 (Note: some incidents may be assigned to more than one category).
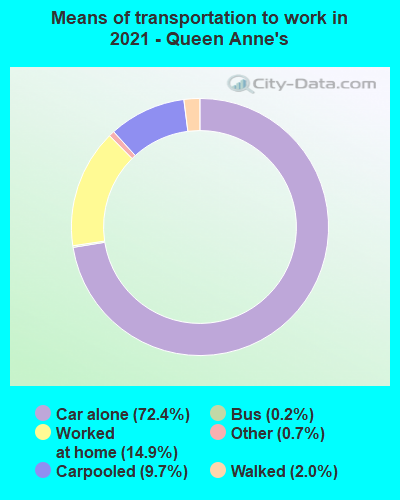
Means of transportation to work:
- Drove a car alone: 13,130 (68.4%)
- Carpooled: 1,754 (9.1%)
- Bus: 40 (0.2%)
- Subway or elevated rail: 1 (0.0%)
- Ferryboat: 17 (0.1%)
- Taxicab, motorcycle, or other means: 136 (0.7%)
- Bicycle: 1 (0.0%)
- Walked: 289 (1.5%)
- Worked at home: 3,941 (20.5%)
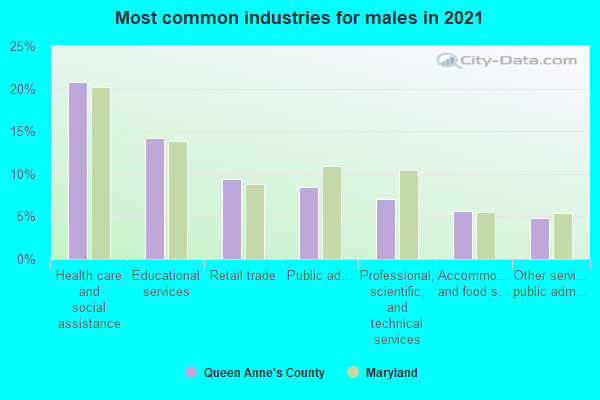
- Health care and social assistance (21%)
- Educational services (14%)
- Retail trade (9%)
- Public administration (7%)
- Professional, scientific, and technical services (7%)
- Accommodation and food services (6%)
- Other services, except public administration (5%)
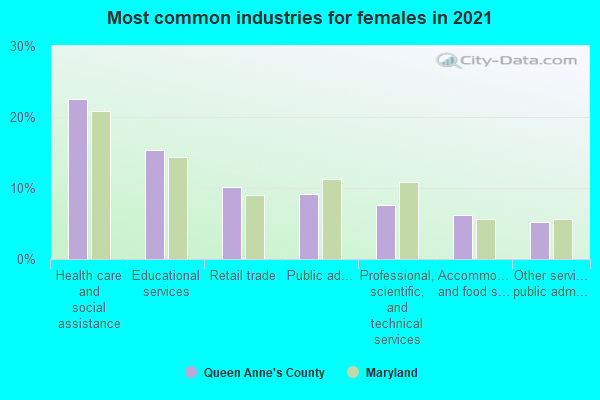
- Health care and social assistance (23%)
- Educational services (15%)
- Retail trade (10%)
- Public administration (8%)
- Professional, scientific, and technical services (8%)
- Accommodation and food services (6%)
- Other services, except public administration (6%)
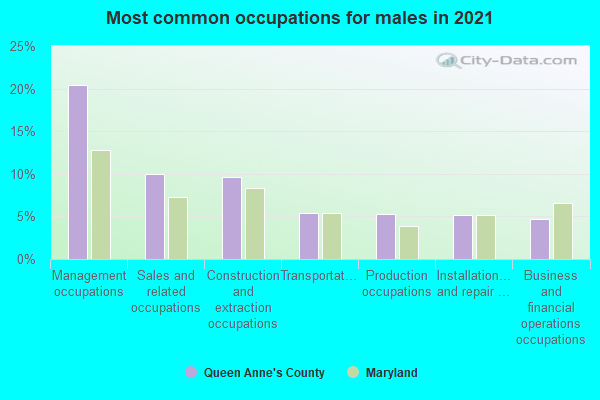
- Management occupations (20%)
- Construction and extraction occupations (12%)
- Sales and related occupations (12%)
- Production occupations (6%)
- Installation, maintenance, and repair occupations (6%)
- Transportation occupations (5%)
- Food preparation and serving related occupations (4%)
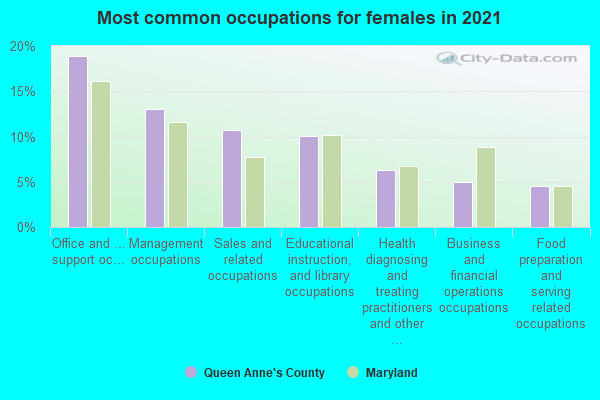
- Office and administrative support occupations (15%)
- Management occupations (12%)
- Sales and related occupations (11%)
- Educational instruction, and library occupations (11%)
- Health diagnosing and treating practitioners and other technical occupations (7%)
- Business and financial operations occupations (5%)
- Personal care and service occupations (5%)
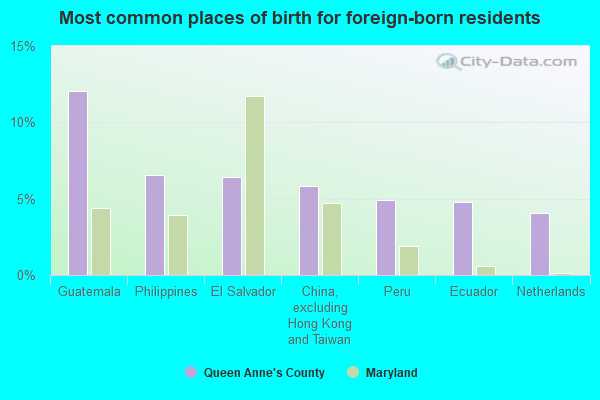
- Guatemala (16%)
- Ethiopia (7%)
- Ecuador (7%)
- Philippines (6%)
- China, excluding Hong Kong and Taiwan (6%)
- Mexico (6%)
- Peru (4%)
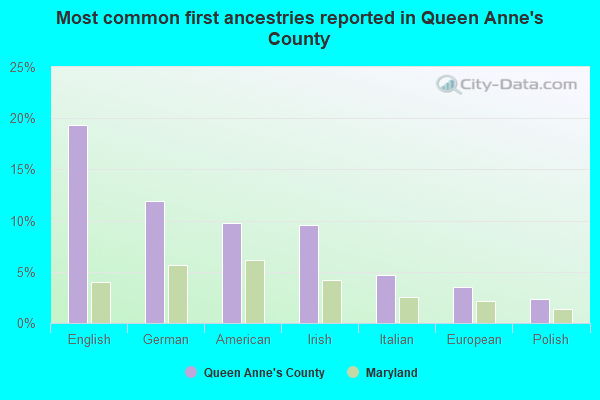
- English (19%)
- German (12%)
- Irish (10%)
- American (9%)
- Italian (4%)
- European (3%)
- Polish (2%)
People in group quarters in Queen Anne's County, Maryland in 2010:
- 167 people in state prisons
- 113 people in nursing facilities/skilled-nursing facilities
- 87 people in local jails and other municipal confinement facilities
- 35 people in workers' group living quarters and job corps centers
- 9 people in group homes intended for adults
- 8 people in emergency and transitional shelters (with sleeping facilities) for people experiencing homelessness
- 4 people in in-patient hospice facilities
- 3 people in residential treatment centers for adults
People in group quarters in Queen Anne's County, Maryland in 2000:
- 174 people in state prisons
- 160 people in nursing homes
- 100 people in local jails and other confinement facilities (including police lockups)
- 26 people in agriculture workers' dormitories on farms
- 15 people in other group homes
- 14 people in homes for the mentally ill
- 14 people in other noninstitutional group quarters
- 3 people in unknown juvenile institutions
- 3 people in homes for the mentally retarded
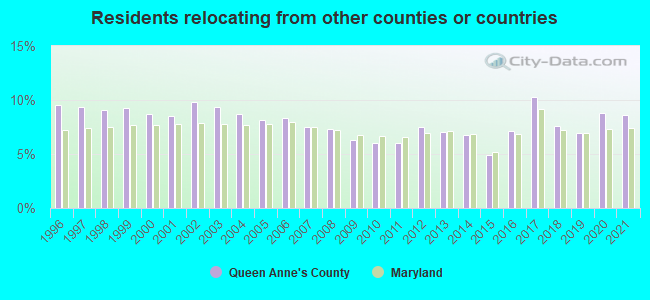
8.64% of this county's 2021 resident taxpayers lived in other counties in 2020 ($105,325 average adjusted gross income)
| Here: | 8.64% |
| Maryland average: | 7.42% |
10 or fewer of this county's residents moved from foreign countries.
6.15% relocated from other counties in Maryland ($71,205 average AGI)
2.49% relocated from other states ($34,121 average AGI)
Queen Anne's County: 2.49% Maryland average: 3.41%
Top counties from which taxpayers relocated into this county between 2020 and 2021:
| from Anne Arundel County, MD | |
| from Caroline County, MD | |
| from Kent County, MD | |
| from Baltimore County, MD | |
| from Montgomery County, MD | |
| from Talbot County, MD | |
| from Prince George's County, MD |
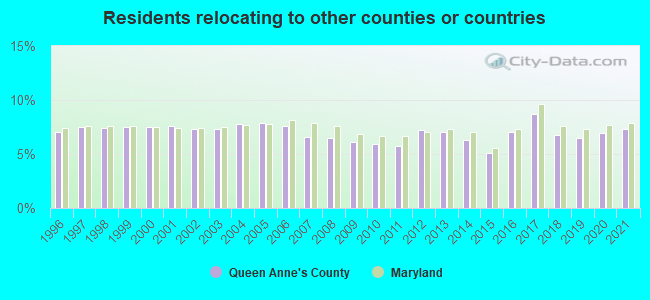
7.30% of this county's 2020 resident taxpayers moved to other counties in 2021 ($92,737 average adjusted gross income)
| Here: | 7.30% |
| Maryland average: | 7.91% |
10 or fewer of this county's residents moved to foreign countries.
4.24% relocated to other counties in Maryland ($41,895 average AGI)
3.05% relocated to other states ($50,842 average AGI)
Queen Anne's County: 3.05% Maryland average: 3.93%
Top counties to which taxpayers relocated from this county between 2020 and 2021:
| to Anne Arundel County, MD | |
| to Caroline County, MD | |
| to Kent County, MD | |
| to Talbot County, MD | |
| to Sussex County, DE | |
| to Kent County, DE | |
| to Baltimore County, MD |
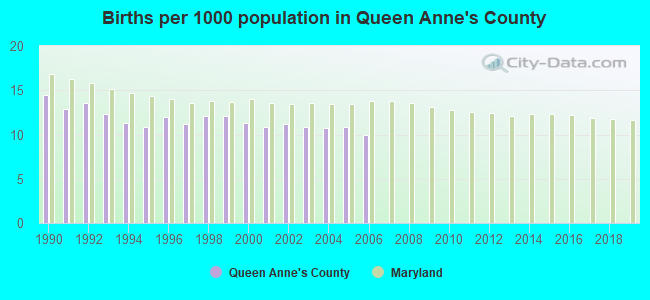
Births per 1000 population from 1990 to 1999: 12.3
Births per 1000 population from 2000 to 2006: 10.8
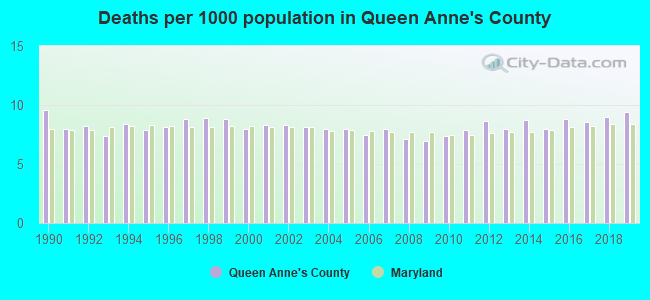
Deaths per 1000 population from 1990 to 1999: 8.4
Deaths per 1000 population from 2000 to 2009: 7.8
Deaths per 1000 population from 2010 to 2020: 8.5
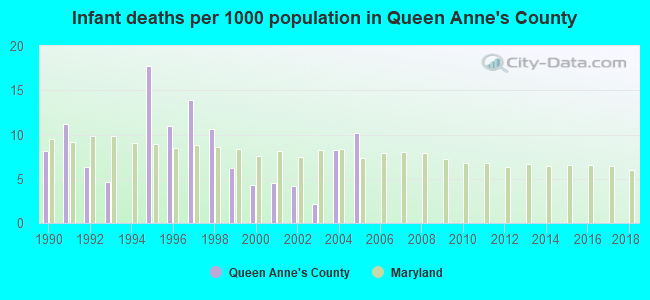
Infant deaths per 1000 live births from 1990 to 1999: 9.0
Infant deaths per 1000 live births from 2000 to 2006: 4.8
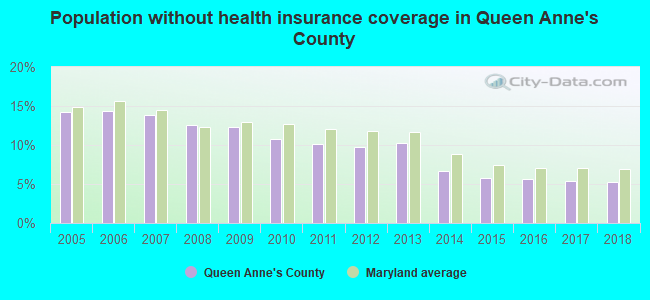
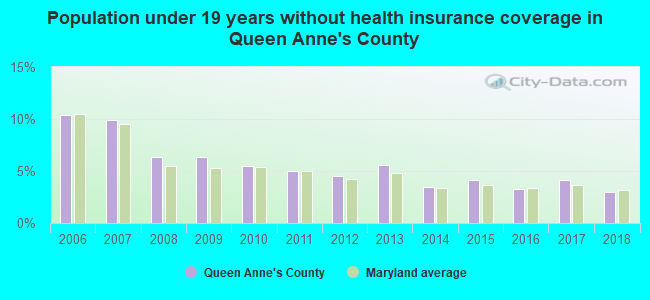
Persons under 19 years old without health insurance coverage in 2018: 3.0%
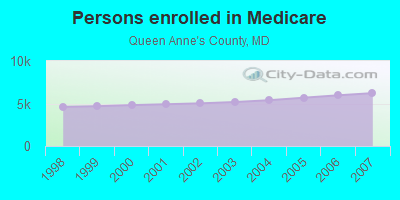
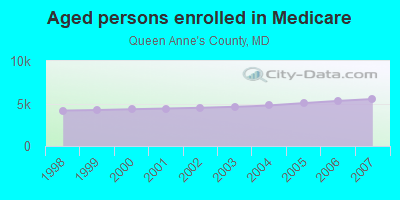
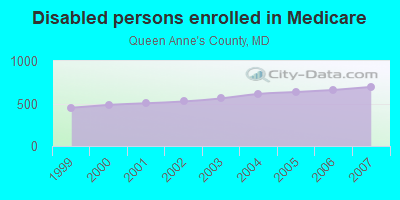
Persons enrolled in hospital insurance and/or supplemental medical insurance (Medicare) in July 1, 2007: 6,220 (5,525 aged, 695 disabled)
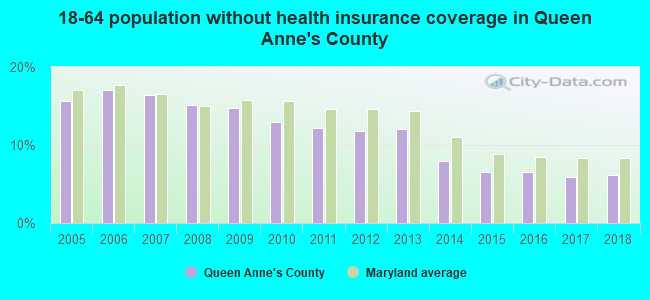
Children under 18 without health insurance coverage in 2007: 749 (6%)
Most common underlying causes of death in Queen Anne's County, Maryland in 1999 - 2019:
- Bronchus or lung, unspecified - Malignant neoplasms (597)
- Acute myocardial infarction, unspecified (450)
- Atherosclerotic heart disease (437)
- Chronic obstructive pulmonary disease, unspecified (339)
- Alzheimer disease, unspecified (218)
- Unspecified dementia (212)
- Stroke, not specified as haemorrhage or infarction (140)
- Atherosclerotic cardiovascular disease, so described (97)
- Pneumonia, unspecified (65)
- Congestive heart failure (45)
Population without health insurance coverage in 2000: 10%
Children under 18 without health insurance coverage in 2000: 7%
Medical specialist MDs per 100,000 population in 2005: 838
Dentists per 100,000 population in 1998: 24
Total births per 100,000 population, July 2005 - July 2006 : 20
Total deaths per 100,000 population, July 2005 - July 2006: 68
Limited-service eating places per 100,000 population in 2005 : 13
Beer, wine & liquor stores per 100,000 population in 2005: 1
Suicides per 1,000,000 population from 2000 to 2006: 98.7. This is more than state average.
Household type by relationship:
Households: 50,340- Male householders: 10,257 (2,129 living alone), Female householders: 9,572 (2,342 living alone)
11,733 spouses (11,603 opposite-sex spouses), 1,286 unmarried partners, (1,271 opposite-sex unmarried partners), 13,802 children (12,467 natural, 346 adopted, 967 stepchildren), 875 grandchildren, 364 brothers or sisters, 781 parents, 46 foster children, 516 other relatives, 840 non-relatives
- In group quarters: 435
Size of family households: 6,902 2-persons, 3,248 3-persons, 2,690 4-persons, 1,207 5-persons, 336 6-persons, 133 7-or-more-persons.
Size of nonfamily households: 4,481 1-person, 671 2-persons, 48 3-persons, 66 4-persons, 6 5-persons.
7,524 married couples with children.
2,064 single-parent households (528 men, 1,536 women).
93.7% of residents of Queen Anne's speak English at home.
3.4% of residents speak Spanish at home (56% speak English very well, 16% speak English well, 21% speak English not well, 7% don't speak English at all).
0.8% of residents speak other Indo-European language at home (83% speak English very well, 14% speak English well, 3% speak English not well).
0.8% of residents speak Asian or Pacific Island language at home (64% speak English very well, 18% speak English well, 18% speak English not well).
0.6% of residents speak other language at home (86% speak English very well, 3% speak English well, 11% speak English not well).
In fiscal year 2004:
Federal Government expenditure: $213,505,000 ($4,736 per capita)
Department of Defense expenditure: $36,151,000
Federal direct payments to individuals for retirement and disability: $101,257,000
Federal other direct payments to individuals: $32,322,000
Federal direct payments not to individuals: $19,291,000
Federal grants: $22,621,000
Federal procurement contracts: $31,599,000 ($27,753,000 Department of Defense)
Federal salaries and wages: $6,415,000 ($69,000 Department of Defense)
Federal Government direct loans: $4,441,000
Federal guaranteed/insured loans: $44,386,000
Federal Government insurance: $394,857,000
Population change from April 1, 2000 to July 1, 2005:
Births: 2,602| Here: | 57 per 1000 residents |
| State: | 71 per 1000 residents |
Deaths: 1,882
| Here: | 41 per 1000 residents |
| State: | 41 per 1000 residents |
Net international migration: +229
| Here: | +5 per 1000 residents |
| State: | +19 per 1000 residents |
Net internal migration: +4,165
| Here: | +91 per 1000 residents |
| State: | +2 per 1000 residents |
Total withdrawal of fresh water for public supply: 1.69 millions of gallons per day (all from ground)
| Here: | 7.4 |
| State: | 7.3 |
| Here: | 5.1 |
| State: | 4.2 |
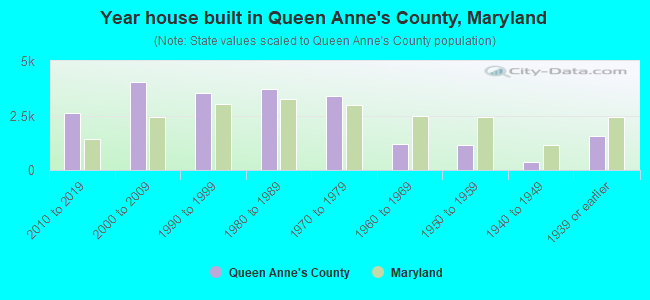
- Year house built in Queen Anne's County, Maryland
- 1672020 or later
- 2,5362010 to 2019
- 4,1222000 to 2009
- 3,5311990 to 1999
- 3,6731980 to 1989
- 3,5601970 to 1979
- 1,2741960 to 1969
- 1,0551950 to 1959
- 2831940 to 1949
- 1,5581939 or earlier

- Rooms in owner-occupied houses in Queen Anne's County, Maryland
- 181 room
- 252 rooms
- 1083 rooms
- 6814 rooms
- 2,0505 rooms
- 2,7966 rooms
- 2,7677 rooms
- 3,0778 rooms
- 4,6209+ rooms
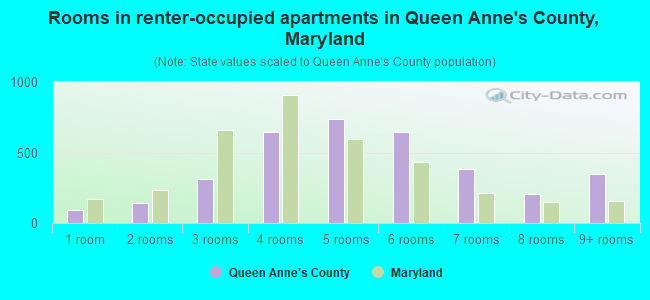
- Rooms in renter-occupied apartments in Queen Anne's County, Maryland
- 1051 room
- 1292 rooms
- 3293 rooms
- 6684 rooms
- 8715 rooms
- 6786 rooms
- 3937 rooms
- 2108 rooms
- 2559+ rooms

- Bedrooms in owner-occupied houses in Queen Anne's County, Maryland
- 15no bedroom
- 1111 bedroom
- 1,7182 bedrooms
- 7,8453 bedrooms
- 5,1254 bedrooms
- 1,3405+ bedrooms

- Bedrooms in renter-occupied apartments in Queen Anne's County, Maryland
- 109no bedroom
- 6571 bedroom
- 1,0242 bedrooms
- 1,4133 bedrooms
- 3694 bedrooms
- 325+ bedrooms

- Cars and other vehicles available in Queen Anne's County in owner-occupied houses/condos
- 291no vehicle
- 2,9761 vehicle
- 6,7002 vehicles
- 4,1603 vehicles
- 1,4464 vehicles
- 5045+ vehicles
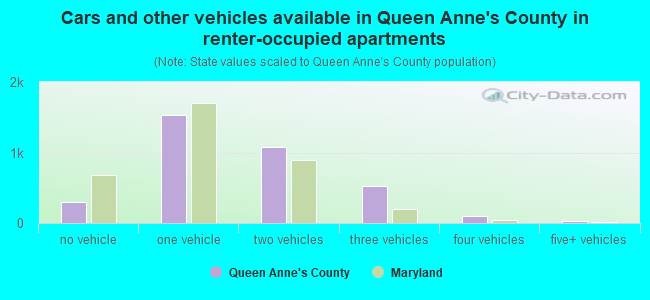
- Cars and other vehicles available in Queen Anne's County in renter-occupied apartments
- 340no vehicle
- 1,5111 vehicle
- 1,0562 vehicles
- 5793 vehicles
- 564 vehicles
- 1035+ vehicles
90.3% of Queen Anne's County residents lived in the same house 1 years ago.
Out of people who lived in different houses, 27% lived in this county.
Out of people who lived in different counties, 70% lived in Maryland.
| Queen Anne's County: | 90.3% |
| State average: | 88.5% |
Place of birth for U.S.-born residents:
- This state: 31,060
- Other state: 16,226
- Northeast: 6,197
- Midwest: 2,239
- South: 6,760
- West: 1,046
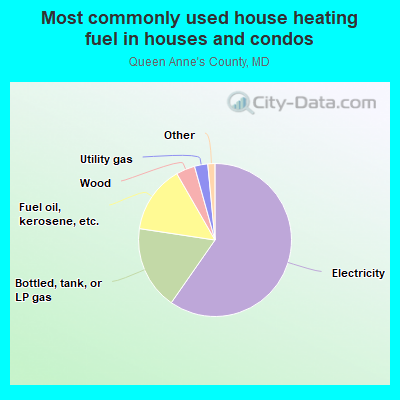
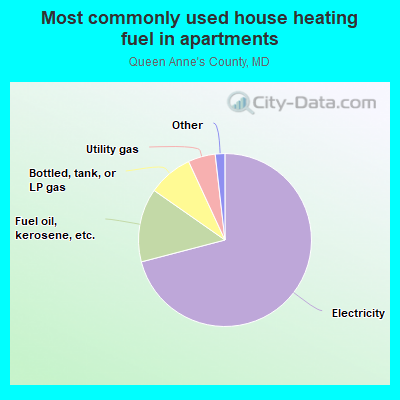
- 61.1%Electricity
- 18.6%Bottled, tank, or LP gas
- 13.1%Fuel oil, kerosene, etc.
- 3.4%Wood
- 2.7%Utility gas
- 0.5%Other fuel
- 0.4%No fuel used
- 0.2%Solar energy
- 73.5%Electricity
- 11.9%Fuel oil, kerosene, etc.
- 8.6%Bottled, tank, or LP gas
- 3.5%Utility gas
- 1.1%Wood
- 0.9%Other fuel
- 0.5%No fuel used
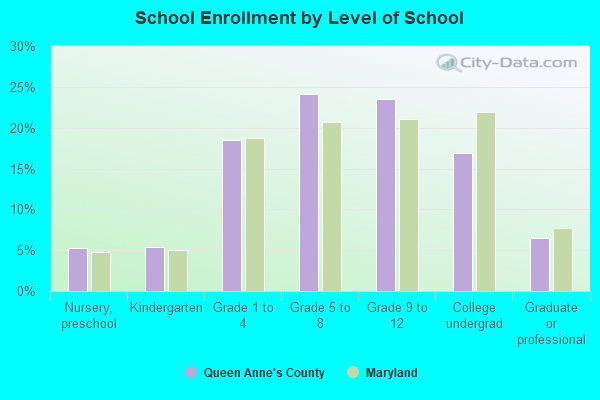
Private vs. public school enrollment:
| Here: | 12.1% |
| Maryland: | 15.2% |
| Here: | 14.8% |
| Maryland: | 14.4% |
| Here: | 25.5% |
| Maryland: | 20.2% |

Queen Anne's County government finances - Expenditure in 2018:
- Bond Funds - Cash and Securities: $47,762,000
Cash and Securities: $39,205,000
- Charges - Other: $9,033,000
Sewerage: $6,227,000
Sewerage: $5,872,000
Higher Education - Other: $5,758,000
Higher Education - Other: $5,506,000
Other: $4,930,000
Parks and Recreation: $1,423,000
Parks and Recreation: $1,319,000
Elementary and Secondary Education School Lunch: $1,118,000
Higher Education Auxiliary Enterprises: $888,000
Elementary and Secondary Education School Lunch: $822,000
Higher Education Auxiliary Enterprises: $765,000
Solid Waste Management: $698,000
Solid Waste Management: $659,000
Regular Highways: $142,000
Regular Highways: $125,000
Elementary and Secondary Education School Tuition and Transportation: $118,000
Elementary and Secondary Education School Tuition and Transportation: $102,000
Air Transportation: $26,000
Air Transportation: $24,000
Elementary and Secondary Education - Other: $6,000
- Construction - Elementary and Secondary Education: $6,558,000
Elementary and Secondary Education: $6,073,000
Other Higher Education: $969,000
- Current Operations - Elementary and Secondary Education: $102,661,000
Elementary and Secondary Education: $97,153,000
General - Other: $30,151,000
General - Other: $27,848,000
Other Higher Education: $23,108,000
Other Higher Education: $22,773,000
Judicial and Legal Services: $11,595,000
Parks and Recreation: $9,650,000
Police Protection: $9,453,000
Sewerage: $8,698,000
Police Protection: $8,281,000
Sewerage: $8,245,000
Regular Highways: $8,044,000
Regular Highways: $7,187,000
Parks and Recreation: $6,055,000
Correctional Institutions: $4,964,000
Correctional Institutions: $4,913,000
Local Fire Protection: $4,757,000
Local Fire Protection: $4,207,000
Water Utilities: $3,187,000
Central Staff Services: $3,133,000
Central Staff Services: $3,108,000
Financial Administration: $3,091,000
Water Utilities: $2,967,000
Financial Administration: $2,944,000
Judicial and Legal Services: $2,682,000
Natural Resources - Other: $2,596,000
Health - Other: $2,400,000
General Public Buildings: $2,253,000
General Public Buildings: $2,225,000
Health - Other: $2,182,000
Libraries: $1,889,000
Libraries: $1,765,000
Solid Waste Management: $1,538,000
Solid Waste Management: $1,504,000
Natural Resources - Other: $1,476,000
Higher Education Auxiliary Enterprises: $1,076,000
Air Transportation: $973,000
Higher Education Auxiliary Enterprises: $964,000
Air Transportation: $877,000
Housing and Community Development: $807,000
Housing and Community Development: $552,000
Protective Inspection and Regulation - Other: $194,000
- Federal Intergovernmental - Education: $4,623,000
Other: $3,941,000
Education: $2,225,000
Other: $1,566,000
Housing and Community Development: $716,000
Air Transportation: $61,000
Air Transportation: $59,000
Housing and Community Development: $48,000
Sewerage: $26,000
Highways: $20,000
- General - Interest on Debt: $7,044,000
Interest on Debt: $4,726,000
- Intergovernmental to Local - Other - Elementary and Secondary Education: $1,238,000
Other - Elementary and Secondary Education: $793,000
- Local Intergovernmental - Education: $7,171,000
Education: $6,902,000
Other: $5,284,000
Other: $2,547,000
- Long Term Debt - Outstanding Unspecified Public Purpose: $176,613,000
Beginning Outstanding - Unspecified Public Purpose: $174,278,000
Outstanding Unspecified Public Purpose: $163,828,000
Beginning Outstanding - Unspecified Public Purpose: $146,238,000
Issue, Unspecified Public Purpose: $32,189,000
Retired Unspecified Public Purpose: $29,856,000
Issue, Unspecified Public Purpose: $27,013,000
Retired Unspecified Public Purpose: $9,423,000
- Miscellaneous - General Revenue - Other: $2,699,000
Interest Earnings: $2,139,000
General Revenue - Other: $2,016,000
Interest Earnings: $1,480,000
Fines and Forfeits: $268,000
Rents: $195,000
Rents: $161,000
Fines and Forfeits: $154,000
Sale of Property: $42,000
Sale of Property: $31,000
- Other Capital Outlay - Other Higher Education: $621,000
Other Higher Education: $289,000
Elementary and Secondary Education: $127,000
Elementary and Secondary Education: $88,000
- Other Funds - Cash and Securities: $82,377,000
Cash and Securities: $61,934,000
- Revenue - Water Utilities: $2,659,000
Water Utilities: $2,341,000
- Short Term Debt Outstanding - Beginning: $5,649,000
End of Fiscal Year: $5,575,000
Beginning: $5,367,000
End of Fiscal Year: $5,137,000
- State Intergovernmental - Education: $51,852,000
Education: $43,836,000
Other: $4,834,000
Other: $4,541,000
Sewerage: $2,542,000
Highways: $1,074,000
Highways: $769,000
Housing and Community Development: $130,000
Sewerage: $90,000
Housing and Community Development: $50,000
- Tax - Property: $71,867,000
Property: $67,945,000
Individual Income: $61,548,000
Individual Income: $51,834,000
Documentary and Stock Transfer: $6,339,000
Documentary and Stock Transfer: $5,723,000
Death and Gift: $2,284,000
Death and Gift: $1,997,000
Other Selective Sales: $685,000
Other Selective Sales: $648,000
Other License: $526,000
Other License: $500,000
Public Utility License: $488,000
Public Utility License: $486,000
Amusements Sales: $159,000
Amusements Sales: $150,000
Alcoholic Beverage License: $98,000
Occupation and Business License - Other: $84,000
Occupation and Business License - Other: $72,000
Alcoholic Beverage License: $5,000
- Total Salaries and Wages: $74,577,000
: $72,398,000
Queen Anne's County government finances - Revenue in 2018:
- Bond Funds - Cash and Securities: $47,762,000
Cash and Securities: $39,205,000
- Charges - Other: $9,033,000
Sewerage: $6,227,000
Sewerage: $5,872,000
Higher Education - Other: $5,758,000
Higher Education - Other: $5,506,000
Other: $4,930,000
Parks and Recreation: $1,423,000
Parks and Recreation: $1,319,000
Elementary and Secondary Education School Lunch: $1,118,000
Higher Education Auxiliary Enterprises: $888,000
Elementary and Secondary Education School Lunch: $822,000
Higher Education Auxiliary Enterprises: $765,000
Solid Waste Management: $698,000
Solid Waste Management: $659,000
Regular Highways: $142,000
Regular Highways: $125,000
Elementary and Secondary Education School Tuition and Transportation: $118,000
Elementary and Secondary Education School Tuition and Transportation: $102,000
Air Transportation: $26,000
Air Transportation: $24,000
Elementary and Secondary Education - Other: $6,000
- Construction - Elementary and Secondary Education: $6,558,000
Elementary and Secondary Education: $6,073,000
Other Higher Education: $969,000
- Current Operations - Elementary and Secondary Education: $102,661,000
Elementary and Secondary Education: $97,153,000
General - Other: $30,151,000
General - Other: $27,848,000
Other Higher Education: $23,108,000
Other Higher Education: $22,773,000
Judicial and Legal Services: $11,595,000
Parks and Recreation: $9,650,000
Police Protection: $9,453,000
Sewerage: $8,698,000
Police Protection: $8,281,000
Sewerage: $8,245,000
Regular Highways: $8,044,000
Regular Highways: $7,187,000
Parks and Recreation: $6,055,000
Correctional Institutions: $4,964,000
Correctional Institutions: $4,913,000
Local Fire Protection: $4,757,000
Local Fire Protection: $4,207,000
Water Utilities: $3,187,000
Central Staff Services: $3,133,000
Central Staff Services: $3,108,000
Financial Administration: $3,091,000
Water Utilities: $2,967,000
Financial Administration: $2,944,000
Judicial and Legal Services: $2,682,000
Natural Resources - Other: $2,596,000
Health - Other: $2,400,000
General Public Buildings: $2,253,000
General Public Buildings: $2,225,000
Health - Other: $2,182,000
Libraries: $1,889,000
Libraries: $1,765,000
Solid Waste Management: $1,538,000
Solid Waste Management: $1,504,000
Natural Resources - Other: $1,476,000
Higher Education Auxiliary Enterprises: $1,076,000
Air Transportation: $973,000
Higher Education Auxiliary Enterprises: $964,000
Air Transportation: $877,000
Housing and Community Development: $807,000
Housing and Community Development: $552,000
Protective Inspection and Regulation - Other: $194,000
- Federal Intergovernmental - Education: $4,623,000
Other: $3,941,000
Education: $2,225,000
Other: $1,566,000
Housing and Community Development: $716,000
Air Transportation: $61,000
Air Transportation: $59,000
Housing and Community Development: $48,000
Sewerage: $26,000
Highways: $20,000
- General - Interest on Debt: $7,044,000
Interest on Debt: $4,726,000
- Intergovernmental to Local - Other - Elementary and Secondary Education: $1,238,000
Other - Elementary and Secondary Education: $793,000
- Local Intergovernmental - Education: $7,171,000
Education: $6,902,000
Other: $5,284,000
Other: $2,547,000
- Long Term Debt - Outstanding Unspecified Public Purpose: $176,613,000
Beginning Outstanding - Unspecified Public Purpose: $174,278,000
Outstanding Unspecified Public Purpose: $163,828,000
Beginning Outstanding - Unspecified Public Purpose: $146,238,000
Issue, Unspecified Public Purpose: $32,189,000
Retired Unspecified Public Purpose: $29,856,000
Issue, Unspecified Public Purpose: $27,013,000
Retired Unspecified Public Purpose: $9,423,000
- Miscellaneous - General Revenue - Other: $2,699,000
Interest Earnings: $2,139,000
General Revenue - Other: $2,016,000
Interest Earnings: $1,480,000
Fines and Forfeits: $268,000
Rents: $195,000
Rents: $161,000
Fines and Forfeits: $154,000
Sale of Property: $42,000
Sale of Property: $31,000
- Other Capital Outlay - Other Higher Education: $621,000
Other Higher Education: $289,000
Elementary and Secondary Education: $127,000
Elementary and Secondary Education: $88,000
- Other Funds - Cash and Securities: $82,377,000
Cash and Securities: $61,934,000
- Revenue - Water Utilities: $2,659,000
Water Utilities: $2,341,000
- Short Term Debt Outstanding - Beginning: $5,649,000
End of Fiscal Year: $5,575,000
Beginning: $5,367,000
End of Fiscal Year: $5,137,000
- State Intergovernmental - Education: $51,852,000
Education: $43,836,000
Other: $4,834,000
Other: $4,541,000
Sewerage: $2,542,000
Highways: $1,074,000
Highways: $769,000
Housing and Community Development: $130,000
Sewerage: $90,000
Housing and Community Development: $50,000
- Tax - Property: $71,867,000
Property: $67,945,000
Individual Income: $61,548,000
Individual Income: $51,834,000
Documentary and Stock Transfer: $6,339,000
Documentary and Stock Transfer: $5,723,000
Death and Gift: $2,284,000
Death and Gift: $1,997,000
Other Selective Sales: $685,000
Other Selective Sales: $648,000
Other License: $526,000
Other License: $500,000
Public Utility License: $488,000
Public Utility License: $486,000
Amusements Sales: $159,000
Amusements Sales: $150,000
Alcoholic Beverage License: $98,000
Occupation and Business License - Other: $84,000
Occupation and Business License - Other: $72,000
Alcoholic Beverage License: $5,000
- Total Salaries and Wages: $74,577,000
: $72,398,000
Queen Anne's County government finances - Debt in 2018:
- Bond Funds - Cash and Securities: $47,762,000
Cash and Securities: $39,205,000
- Charges - Other: $9,033,000
Sewerage: $6,227,000
Sewerage: $5,872,000
Higher Education - Other: $5,758,000
Higher Education - Other: $5,506,000
Other: $4,930,000
Parks and Recreation: $1,423,000
Parks and Recreation: $1,319,000
Elementary and Secondary Education School Lunch: $1,118,000
Higher Education Auxiliary Enterprises: $888,000
Elementary and Secondary Education School Lunch: $822,000
Higher Education Auxiliary Enterprises: $765,000
Solid Waste Management: $698,000
Solid Waste Management: $659,000
Regular Highways: $142,000
Regular Highways: $125,000
Elementary and Secondary Education School Tuition and Transportation: $118,000
Elementary and Secondary Education School Tuition and Transportation: $102,000
Air Transportation: $26,000
Air Transportation: $24,000
Elementary and Secondary Education - Other: $6,000
- Construction - Elementary and Secondary Education: $6,558,000
Elementary and Secondary Education: $6,073,000
Other Higher Education: $969,000
- Current Operations - Elementary and Secondary Education: $102,661,000
Elementary and Secondary Education: $97,153,000
General - Other: $30,151,000
General - Other: $27,848,000
Other Higher Education: $23,108,000
Other Higher Education: $22,773,000
Judicial and Legal Services: $11,595,000
Parks and Recreation: $9,650,000
Police Protection: $9,453,000
Sewerage: $8,698,000
Police Protection: $8,281,000
Sewerage: $8,245,000
Regular Highways: $8,044,000
Regular Highways: $7,187,000
Parks and Recreation: $6,055,000
Correctional Institutions: $4,964,000
Correctional Institutions: $4,913,000
Local Fire Protection: $4,757,000
Local Fire Protection: $4,207,000
Water Utilities: $3,187,000
Central Staff Services: $3,133,000
Central Staff Services: $3,108,000
Financial Administration: $3,091,000
Water Utilities: $2,967,000
Financial Administration: $2,944,000
Judicial and Legal Services: $2,682,000
Natural Resources - Other: $2,596,000
Health - Other: $2,400,000
General Public Buildings: $2,253,000
General Public Buildings: $2,225,000
Health - Other: $2,182,000
Libraries: $1,889,000
Libraries: $1,765,000
Solid Waste Management: $1,538,000
Solid Waste Management: $1,504,000
Natural Resources - Other: $1,476,000
Higher Education Auxiliary Enterprises: $1,076,000
Air Transportation: $973,000
Higher Education Auxiliary Enterprises: $964,000
Air Transportation: $877,000
Housing and Community Development: $807,000
Housing and Community Development: $552,000
Protective Inspection and Regulation - Other: $194,000
- Federal Intergovernmental - Education: $4,623,000
Other: $3,941,000
Education: $2,225,000
Other: $1,566,000
Housing and Community Development: $716,000
Air Transportation: $61,000
Air Transportation: $59,000
Housing and Community Development: $48,000
Sewerage: $26,000
Highways: $20,000
- General - Interest on Debt: $7,044,000
Interest on Debt: $4,726,000
- Intergovernmental to Local - Other - Elementary and Secondary Education: $1,238,000
Other - Elementary and Secondary Education: $793,000
- Local Intergovernmental - Education: $7,171,000
Education: $6,902,000
Other: $5,284,000
Other: $2,547,000
- Long Term Debt - Outstanding Unspecified Public Purpose: $176,613,000
Beginning Outstanding - Unspecified Public Purpose: $174,278,000
Outstanding Unspecified Public Purpose: $163,828,000
Beginning Outstanding - Unspecified Public Purpose: $146,238,000
Issue, Unspecified Public Purpose: $32,189,000
Retired Unspecified Public Purpose: $29,856,000
Issue, Unspecified Public Purpose: $27,013,000
Retired Unspecified Public Purpose: $9,423,000
- Miscellaneous - General Revenue - Other: $2,699,000
Interest Earnings: $2,139,000
General Revenue - Other: $2,016,000
Interest Earnings: $1,480,000
Fines and Forfeits: $268,000
Rents: $195,000
Rents: $161,000
Fines and Forfeits: $154,000
Sale of Property: $42,000
Sale of Property: $31,000
- Other Capital Outlay - Other Higher Education: $621,000
Other Higher Education: $289,000
Elementary and Secondary Education: $127,000
Elementary and Secondary Education: $88,000
- Other Funds - Cash and Securities: $82,377,000
Cash and Securities: $61,934,000
- Revenue - Water Utilities: $2,659,000
Water Utilities: $2,341,000
- Short Term Debt Outstanding - Beginning: $5,649,000
End of Fiscal Year: $5,575,000
Beginning: $5,367,000
End of Fiscal Year: $5,137,000
- State Intergovernmental - Education: $51,852,000
Education: $43,836,000
Other: $4,834,000
Other: $4,541,000
Sewerage: $2,542,000
Highways: $1,074,000
Highways: $769,000
Housing and Community Development: $130,000
Sewerage: $90,000
Housing and Community Development: $50,000
- Tax - Property: $71,867,000
Property: $67,945,000
Individual Income: $61,548,000
Individual Income: $51,834,000
Documentary and Stock Transfer: $6,339,000
Documentary and Stock Transfer: $5,723,000
Death and Gift: $2,284,000
Death and Gift: $1,997,000
Other Selective Sales: $685,000
Other Selective Sales: $648,000
Other License: $526,000
Other License: $500,000
Public Utility License: $488,000
Public Utility License: $486,000
Amusements Sales: $159,000
Amusements Sales: $150,000
Alcoholic Beverage License: $98,000
Occupation and Business License - Other: $84,000
Occupation and Business License - Other: $72,000
Alcoholic Beverage License: $5,000
- Total Salaries and Wages: $74,577,000
: $72,398,000
Queen Anne's County government finances - Cash and Securities in 2018:
- Bond Funds - Cash and Securities: $47,762,000
Cash and Securities: $39,205,000
- Charges - Other: $9,033,000
Sewerage: $6,227,000
Sewerage: $5,872,000
Higher Education - Other: $5,758,000
Higher Education - Other: $5,506,000
Other: $4,930,000
Parks and Recreation: $1,423,000
Parks and Recreation: $1,319,000
Elementary and Secondary Education School Lunch: $1,118,000
Higher Education Auxiliary Enterprises: $888,000
Elementary and Secondary Education School Lunch: $822,000
Higher Education Auxiliary Enterprises: $765,000
Solid Waste Management: $698,000
Solid Waste Management: $659,000
Regular Highways: $142,000
Regular Highways: $125,000
Elementary and Secondary Education School Tuition and Transportation: $118,000
Elementary and Secondary Education School Tuition and Transportation: $102,000
Air Transportation: $26,000
Air Transportation: $24,000
Elementary and Secondary Education - Other: $6,000
- Construction - Elementary and Secondary Education: $6,558,000
Elementary and Secondary Education: $6,073,000
Other Higher Education: $969,000
- Current Operations - Elementary and Secondary Education: $102,661,000
Elementary and Secondary Education: $97,153,000
General - Other: $30,151,000
General - Other: $27,848,000
Other Higher Education: $23,108,000
Other Higher Education: $22,773,000
Judicial and Legal Services: $11,595,000
Parks and Recreation: $9,650,000
Police Protection: $9,453,000
Sewerage: $8,698,000
Police Protection: $8,281,000
Sewerage: $8,245,000
Regular Highways: $8,044,000
Regular Highways: $7,187,000
Parks and Recreation: $6,055,000
Correctional Institutions: $4,964,000
Correctional Institutions: $4,913,000
Local Fire Protection: $4,757,000
Local Fire Protection: $4,207,000
Water Utilities: $3,187,000
Central Staff Services: $3,133,000
Central Staff Services: $3,108,000
Financial Administration: $3,091,000
Water Utilities: $2,967,000
Financial Administration: $2,944,000
Judicial and Legal Services: $2,682,000
Natural Resources - Other: $2,596,000
Health - Other: $2,400,000
General Public Buildings: $2,253,000
General Public Buildings: $2,225,000
Health - Other: $2,182,000
Libraries: $1,889,000
Libraries: $1,765,000
Solid Waste Management: $1,538,000
Solid Waste Management: $1,504,000
Natural Resources - Other: $1,476,000
Higher Education Auxiliary Enterprises: $1,076,000
Air Transportation: $973,000
Higher Education Auxiliary Enterprises: $964,000
Air Transportation: $877,000
Housing and Community Development: $807,000
Housing and Community Development: $552,000
Protective Inspection and Regulation - Other: $194,000
- Federal Intergovernmental - Education: $4,623,000
Other: $3,941,000
Education: $2,225,000
Other: $1,566,000
Housing and Community Development: $716,000
Air Transportation: $61,000
Air Transportation: $59,000
Housing and Community Development: $48,000
Sewerage: $26,000
Highways: $20,000
- General - Interest on Debt: $7,044,000
Interest on Debt: $4,726,000
- Intergovernmental to Local - Other - Elementary and Secondary Education: $1,238,000
Other - Elementary and Secondary Education: $793,000
- Local Intergovernmental - Education: $7,171,000
Education: $6,902,000
Other: $5,284,000
Other: $2,547,000
- Long Term Debt - Outstanding Unspecified Public Purpose: $176,613,000
Beginning Outstanding - Unspecified Public Purpose: $174,278,000
Outstanding Unspecified Public Purpose: $163,828,000
Beginning Outstanding - Unspecified Public Purpose: $146,238,000
Issue, Unspecified Public Purpose: $32,189,000
Retired Unspecified Public Purpose: $29,856,000
Issue, Unspecified Public Purpose: $27,013,000
Retired Unspecified Public Purpose: $9,423,000
- Miscellaneous - General Revenue - Other: $2,699,000
Interest Earnings: $2,139,000
General Revenue - Other: $2,016,000
Interest Earnings: $1,480,000
Fines and Forfeits: $268,000
Rents: $195,000
Rents: $161,000
Fines and Forfeits: $154,000
Sale of Property: $42,000
Sale of Property: $31,000
- Other Capital Outlay - Other Higher Education: $621,000
Other Higher Education: $289,000
Elementary and Secondary Education: $127,000
Elementary and Secondary Education: $88,000
- Other Funds - Cash and Securities: $82,377,000
Cash and Securities: $61,934,000
- Revenue - Water Utilities: $2,659,000
Water Utilities: $2,341,000
- Short Term Debt Outstanding - Beginning: $5,649,000
End of Fiscal Year: $5,575,000
Beginning: $5,367,000
End of Fiscal Year: $5,137,000
- State Intergovernmental - Education: $51,852,000
Education: $43,836,000
Other: $4,834,000
Other: $4,541,000
Sewerage: $2,542,000
Highways: $1,074,000
Highways: $769,000
Housing and Community Development: $130,000
Sewerage: $90,000
Housing and Community Development: $50,000
- Tax - Property: $71,867,000
Property: $67,945,000
Individual Income: $61,548,000
Individual Income: $51,834,000
Documentary and Stock Transfer: $6,339,000
Documentary and Stock Transfer: $5,723,000
Death and Gift: $2,284,000
Death and Gift: $1,997,000
Other Selective Sales: $685,000
Other Selective Sales: $648,000
Other License: $526,000
Other License: $500,000
Public Utility License: $488,000
Public Utility License: $486,000
Amusements Sales: $159,000
Amusements Sales: $150,000
Alcoholic Beverage License: $98,000
Occupation and Business License - Other: $84,000
Occupation and Business License - Other: $72,000
Alcoholic Beverage License: $5,000
- Total Salaries and Wages: $74,577,000
: $72,398,000
Supplemental Security Income (SSI) in 2006:
- Total number of recipients: 337
- Number of aged recipients: 37
- Number of blind and disabled recipients: 300
- Number of recipients under 18: 51
- Number of recipients between 18 and 64: 221
- Number of recipients older than 64: 65
- Number of recipients also receiving OASDI: 147
- Amount of payments (thousands of dollars): 133
| Home Mortgage Disclosure Act Aggregated Statistics For Year 2009 (Based on 10 full tracts) | ||||||||||||||
| A) FHA, FSA/RHS & VA Home Purchase Loans | B) Conventional Home Purchase Loans | C) Refinancings | D) Home Improvement Loans | E) Loans on Dwellings For 5+ Families | F) Non-occupant Loans on < 5 Family Dwellings (A B C & D) | G) Loans On Manufactured Home Dwelling (A B C & D) | ||||||||
|---|---|---|---|---|---|---|---|---|---|---|---|---|---|---|
| Number | Average Value | Number | Average Value | Number | Average Value | Number | Average Value | Number | Average Value | Number | Average Value | Number | Average Value | |
| LOANS ORIGINATED | 224 | $275,304 | 228 | $302,096 | 1,911 | $274,964 | 123 | $128,350 | 0 | $0 | 160 | $289,888 | 21 | $123,952 |
| APPLICATIONS APPROVED, NOT ACCEPTED | 15 | $290,600 | 21 | $237,095 | 106 | $279,019 | 9 | $52,111 | 0 | $0 | 14 | $254,000 | 2 | $113,500 |
| APPLICATIONS DENIED | 24 | $290,042 | 38 | $282,974 | 650 | $299,991 | 54 | $82,037 | 1 | $335,000 | 44 | $296,682 | 13 | $150,846 |
| APPLICATIONS WITHDRAWN | 27 | $238,074 | 29 | $254,931 | 401 | $292,112 | 24 | $185,292 | 0 | $0 | 20 | $285,250 | 3 | $81,667 |
| FILES CLOSED FOR INCOMPLETENESS | 2 | $304,500 | 7 | $544,714 | 90 | $303,856 | 9 | $170,444 | 0 | $0 | 8 | $359,250 | 2 | $210,000 |
| Private Mortgage Insurance Companies Aggregated Statistics For Year 2009 (Based on 9 full tracts) | ||||||
| A) Conventional Home Purchase Loans | B) Refinancings | C) Non-occupant Loans on < 5 Family Dwellings (A & B) | ||||
|---|---|---|---|---|---|---|
| Number | Average Value | Number | Average Value | Number | Average Value | |
| LOANS ORIGINATED | 20 | $291,450 | 32 | $330,625 | 2 | $330,000 |
| APPLICATIONS APPROVED, NOT ACCEPTED | 15 | $337,200 | 13 | $322,308 | 0 | $0 |
| APPLICATIONS DENIED | 4 | $391,250 | 11 | $290,000 | 1 | $307,000 |
| APPLICATIONS WITHDRAWN | 1 | $202,000 | 6 | $369,167 | 0 | $0 |
| FILES CLOSED FOR INCOMPLETENESS | 0 | $0 | 0 | $0 | 0 | $0 |

| Most common first names in Queen Anne's County, MD among deceased individuals | ||
| Name | Count | Lived (average) |
|---|---|---|
| William | 317 | 75.3 years |
| John | 265 | 75.1 years |
| Mary | 255 | 79.4 years |
| James | 220 | 72.3 years |
| Charles | 211 | 73.9 years |
| Robert | 129 | 70.9 years |
| George | 127 | 73.7 years |
| Margaret | 115 | 79.9 years |
| Joseph | 111 | 75.0 years |
| Helen | 106 | 80.2 years |
| Most common last names in Queen Anne's County, MD among deceased individuals | ||
| Last name | Count | Lived (average) |
|---|---|---|
| Smith | 104 | 75.5 years |
| Thomas | 87 | 76.5 years |
| Jones | 73 | 75.4 years |
| Brown | 72 | 77.7 years |
| Thompson | 56 | 72.9 years |
| Johnson | 42 | 75.6 years |
| Green | 41 | 76.0 years |
| Taylor | 40 | 77.2 years |
| Wilson | 40 | 76.0 years |
| Wright | 39 | 76.7 years |
| Businesses in Queen Anne's County, MD | ||||
| Name | Count | Name | Count | |
|---|---|---|---|---|
| 7-Eleven | 3 | Holiday Inn | 1 | |
| AT&T | 1 | IZOD | 1 | |
| Ace Hardware | 1 | J.Crew | 1 | |
| Aeropostale | 1 | Jones New York | 1 | |
| Banana Republic | 1 | KFC | 1 | |
| Bath & Body Works | 1 | Kmart | 1 | |
| Best Western | 1 | MasterBrand Cabinets | 8 | |
| Blockbuster | 1 | McDonald's | 2 | |
| Brooks Brothers | 1 | Old Navy | 1 | |
| Burger King | 1 | Pac Sun | 1 | |
| CVS | 1 | Papa John's Pizza | 1 | |
| Chick-Fil-A | 1 | Pizza Hut | 1 | |
| Chico's | 1 | Quiznos | 1 | |
| Clarks | 1 | RadioShack | 1 | |
| Cracker Barrel | 1 | Rite Aid | 1 | |
| Curves | 1 | Safeway | 1 | |
| Dairy Queen | 1 | Sears | 2 | |
| Decora Cabinetry | 2 | Sleep Inn | 1 | |
| Domino's Pizza | 2 | Starbucks | 1 | |
| DressBarn | 1 | Subway | 3 | |
| Dressbarn | 1 | T-Mobile | 1 | |
| Dunkin Donuts | 2 | Taco Bell | 1 | |
| Eddie Bauer | 1 | Talbots | 1 | |
| Famous Footwear | 1 | The Room Place | 1 | |
| FedEx | 8 | True Value | 2 | |
| GNC | 1 | U-Haul | 2 | |
| Gap | 1 | UPS | 8 | |
| Gymboree | 1 | Vons | 1 | |
| H&R Block | 2 | Walgreens | 2 | |
| Hardee's | 2 | Wendy's | 1 | |
Queen Anne's County on our top lists:
- #60 on the list of "Top 101 counties with the highest percentage of residents that drank alcohol in the past 30 days"
- #63 on the list of "Top 101 counties with the highest percentage of residents that visited a dentist within the past year"
- #72 on the list of "Top 101 counties with the highest percentage of residents that smoked 100+ cigarettes in their lives"