DeKalb County, Georgia (GA)
County owner-occupied free and clear houses and condos in 2010: 26,294
County owner-occupied houses and condos in 2000: 145,821
Renter-occupied apartments: 117,162 (it was 103,518 in 2000)
| % of renters here: | 42% |
| State: | 34% |
Land area: 268 sq. mi.
Water area: 2.7 sq. mi.
Population density: 2844 people per square mile (very high).
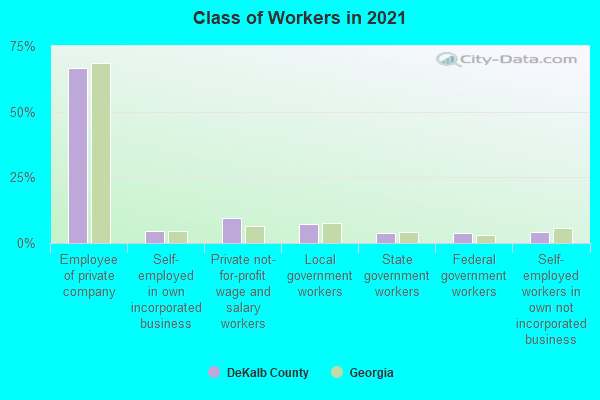
Industries providing employment: Educational, health and social services (22.1%), Professional, scientific, management, administrative, and waste management services (17.2%).
Type of workers:
- Private wage or salary: 81%
- Government: 14%
- Self-employed, not incorporated: 5%
- Unpaid family work: 0%
- OSM Map
- General Map
- Google Map
- MSN Map

- 396,42452.0%Black Non-Hispanic Alone
- 219,53928.8%White Non-Hispanic Alone
- 65,8328.6%Hispanic or Latino
- 46,8046.1%Asian alone
- 30,4954.0%Two or more races
- 2,7370.4%Some other race alone
- 9420.1%American Indian and Alaska Native alone
- 470.01%Native Hawaiian and Other
Pacific Islander alone

| Median resident age: | 36.5 years |
| Georgia median age: | 37.6 years |
| Males: 361,602 | |
| Females: 401,218 |

 | DeKalb County water (65 replies) |
| Ban the Dollar Store? DeKalb County passed a 45-day moratorium on new dollar stores (106 replies) |
| Is the City of Atlanta grossly underpopulated by today's standards? (117 replies) |
| DeKalb County leaders launch “No Mask, No Service” campaign (12 replies) |
| MARTA News (945 replies) |
| Are there any areas in DeKalb county that are actually considered bad? (60 replies) |
| DeKalb County: | 2.0 people |
| Georgia: | 3 people |
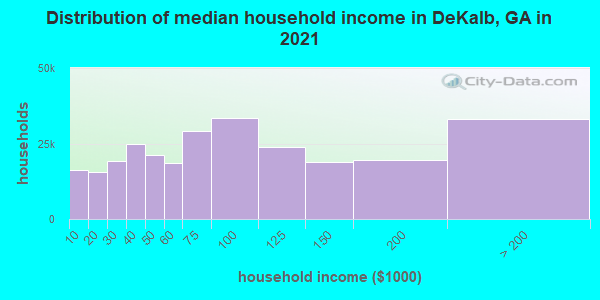
Estimated median household income in 2022: $77,169 ($49,117 in 1999)
| This county: | $77,169 |
| Georgia: | $72,837 |
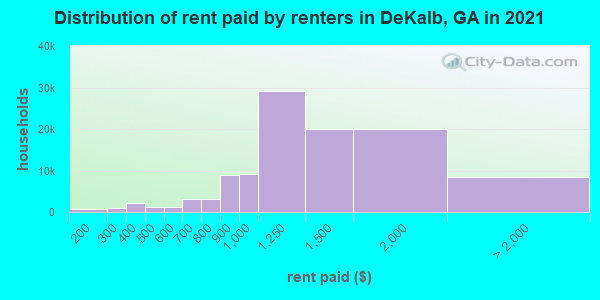
Median contract rent in 2022 for apartments: $1,360 (lower quartile is $1,047, upper quartile is $1,770)
| This county: | $1360 |
| State: | $1065 |
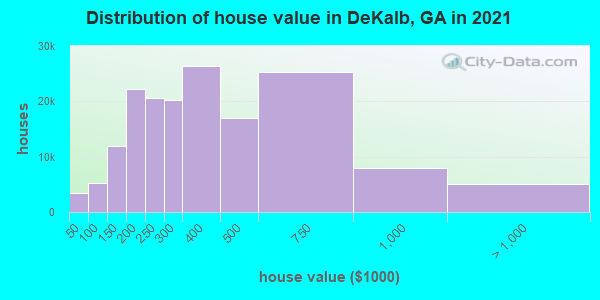
Estimated median house or condo value in 2022: $352,200 (it was $133,500 in 2000)
| DeKalb: | $352,200 |
| Georgia: | $297,400 |
Mean price in 2022:
Median monthly housing costs for homes and condos with a mortgage: $1,841Detached houses: $464,119
Here: $464,119 State: $376,364 Townhouses or other attached units: $325,058
Here: $325,058 State: $341,709 In 2-unit structures: $536,753
Here: $536,753 State: $269,631 In 3-to-4-unit structures: $192,674
Here: $192,674 State: $250,092 In 5-or-more-unit structures: $257,617
Here: $257,617 State: $370,730 Mobile homes: $89,445
Here: $89,445 State: $102,413
Median monthly housing costs for units without a mortgage: $637
Institutionalized population: 6,795
Crime in 2021 (reported by the sheriff's office or county police, not the county total):
- Murders: 0
- Rapes: 0
- Robberies: 0
- Assaults: 25
- Burglaries: 0
- Thefts: 0
- Auto thefts: 0
Crime in 2020 (reported by the sheriff's office or county police, not the county total):
- Murders: 112
- Rapes: 189
- Robberies: 763
- Assaults: 1659
- Burglaries: 1888
- Thefts: 8818
- Auto thefts: 2428
Health of residents in DeKalb County based on CDC Behavioral Risk Factor Surveillance System Survey Questionnaires from 2013 to 2021:
General health status score of residents in this county from 1 (poor) to 5 (excellent) is 3.5. This is about average.72.9% of residents exercised in the past month. This is about average.
36.6% of residents smoked 100+ cigarettes in their lives. This is less than average.
52.3% of adult residents drank alcohol in the past 30 days. This is less than average.
66.6% of residents visited a dentist within the past year. This is less than average.
Average weight of males is 197 pounds. This is about average.
Average weight of females is 164 pounds. This is about average.
Health of residents in DeKalb County based on CDC Behavioral Risk Factor Surveillance System Survey Questionnaires from 2003 to 2012:
General health status score of residents in this county from 1 (poor) to 5 (excellent) is 3.6. This is better than average.77.9% of residents exercised in the past month. This is about average.
37.0% of residents smoked 100+ cigarettes in their lives. This is less than average.
79.4% of adult residents drank alcohol in the past 30 days. This is about average.
76.2% of residents visited a dentist within the past year. This is about average.
Average weight of males is 191 pounds. This is about average.
Average weight of females is 170 pounds. This is more than average.
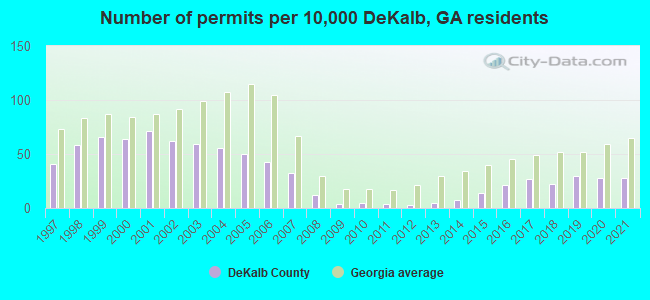
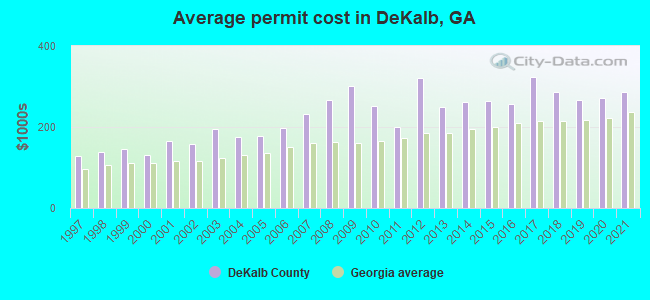
Single-family new house construction building permits:
- 2022: 1138 buildings, average cost: $301,700
- 2021: 1889 buildings, average cost: $285,700
- 2020: 1878 buildings, average cost: $270,700
- 2019: 1993 buildings, average cost: $266,300
- 2018: 1450 buildings, average cost: $286,400
- 2017: 1796 buildings, average cost: $322,900
- 2016: 1425 buildings, average cost: $256,900
- 2015: 900 buildings, average cost: $265,000
- 2014: 485 buildings, average cost: $261,900
- 2013: 336 buildings, average cost: $249,800
- 2012: 208 buildings, average cost: $322,100
- 2011: 295 buildings, average cost: $199,200
- 2010: 354 buildings, average cost: $252,700
- 2009: 295 buildings, average cost: $301,000
- 2008: 768 buildings, average cost: $267,300
- 2007: 2122 buildings, average cost: $233,000
- 2006: 2867 buildings, average cost: $196,900
- 2005: 3347 buildings, average cost: $177,100
- 2004: 3761 buildings, average cost: $174,900
- 2003: 3931 buildings, average cost: $196,000
- 2002: 4134 buildings, average cost: $158,800
- 2001: 4719 buildings, average cost: $166,000
- 2000: 4266 buildings, average cost: $129,800
- 1999: 4376 buildings, average cost: $145,500
- 1998: 3895 buildings, average cost: $138,400
- 1997: 2698 buildings, average cost: $127,900
Median real estate property taxes paid for housing units with mortgages in 2022: $3,411 (0.9%)
Median real estate property taxes paid for housing units with no mortgage in 2022: $2,755 (0.8%)
| DeKalb County: | 13.4% |
| Georgia: | 12.7% |
Median age of residents in 2022: 36.5 years old
(Males: 35.5 years old, Females: 37.8 years old)
(Median age for: White residents: 41.2 years old, Black residents: 36.1 years old, American Indian residents: 24.9 years old, Asian residents: 34.6 years old, Hispanic or Latino residents: 25.5 years old, Other race residents: 31.1 years old)
Area name: Atlanta-Sandy Springs-Marietta, GA HUD Metro FMR Area
Fair market rent in 2006 for a 1-bedroom apartment in DeKalb County is $686 a month.
Fair market rent for a 2-bedroom apartment is $763 a month.
Fair market rent for a 3-bedroom apartment is $929 a month.
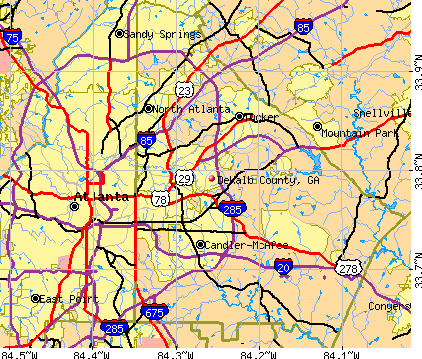
Cities in this county include: North Atlanta, Redan, Dunwoody, Candler-McAfee, Tucker, Belvedere Park, North Druid Hills, Decatur, North Decatur, Druid Hills.
2023 air pollution in DeKalb County:
Carbon Monoxide: 0.282 ppm (standard limit: 9 ppm). Near U.S. average.
Ozone (1-hour): 0.025 ppm (standard limit: 0.12 ppm). Below U.S. average.
Particulate Matter (PM10) Annual: 19.7 µg/m3. Near U.S. average.
Particulate Matter (PM2.5) Annual: 11.1 µg/m3(standard limit: 15.0 µg/m3). Near U.S. average.
Sulfur Oxides Annual: 0.000 ppm (standard limit: 0.03 ppm). Near U.S. average.
Notable locations in this county outside city limits:
Streams, rivers, and creeks: Hales Fork (A). Display/hide its location on the map
Neighboring counties: Newberry County, South Carolina  , Columbia County , Oconee County , Wilkes County , Wichita County, Texas
  .
.
| Here: | 3.1% |
| Georgia: | 2.9% |
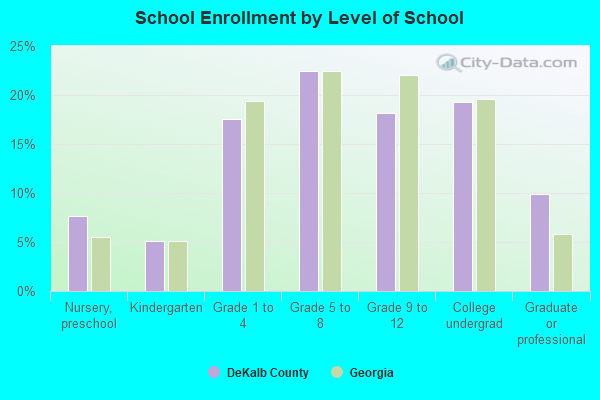
Current college students: 47,609
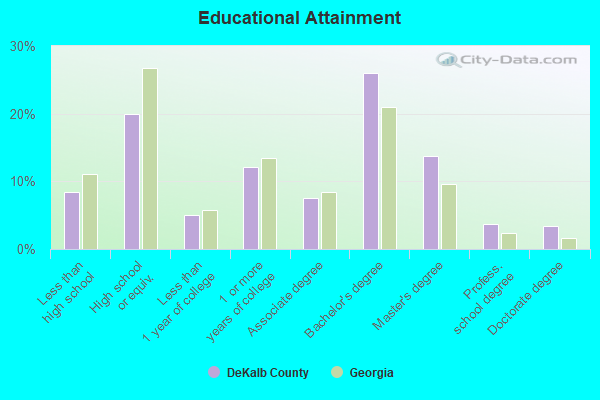
People 25 years of age or older with a high school degree or higher: 91.3%
People 25 years of age or older with a bachelor's degree or higher: 46.3%
Number of foreign born residents: 120,972 (50.7% naturalized citizens)
| DeKalb County: | 15.9% |
| Whole state: | 10.7% |

- Year of entry for the foreign-born population
- 48,4722010 or later
- 31,0452000 to 2009
- 20,4151990 to 1999
- 20,8671980 to 1989
- 9,1371970 to 1979
- 5,689Before 1970
Mean travel time to work (commute): minutes
Percentage of county residents living and working in this county: 99.5%
Housing units in structures:
- One, detached: 180,839
- One, attached: 31,247
- Two: 4,198
- 3 or 4: 13,296
- 5 to 9: 23,147
- 10 to 19: 24,555
- 20 to 49: 16,452
- 50 or more: 34,814
- Mobile homes: 2,217
Housing units in DeKalb County with a mortgage: 118,456 (10,116 second mortgage, 486 home equity loan, 8,230 both second mortgage and home equity loan)
Houses without a mortgage: 2,176
| Here: | 98.3% with mortgage |
| State: | 98.2% with mortgage |
Religion statistics for DeKalb County
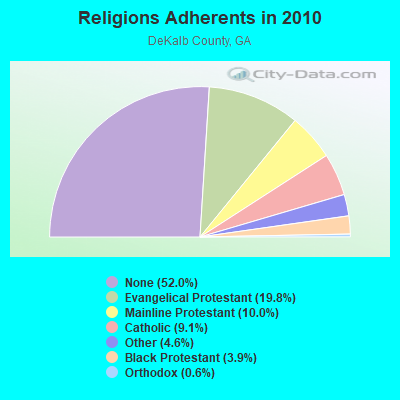
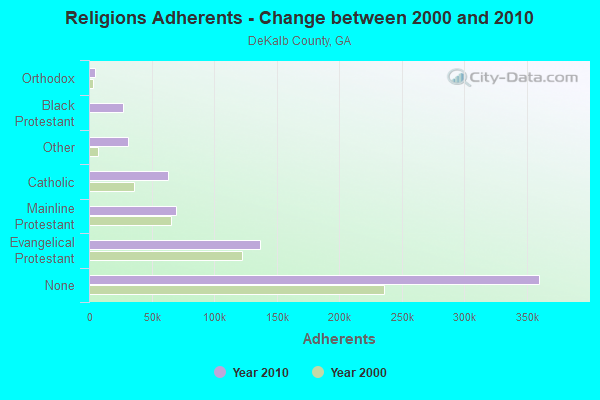
| Religion | Adherents | Congregations |
|---|---|---|
| Evangelical Protestant | 136,806 | 276 |
| Mainline Protestant | 69,164 | 104 |
| Catholic | 62,844 | 11 |
| Other | 31,499 | 63 |
| Black Protestant | 27,228 | 58 |
| Orthodox | 4,458 | 8 |
| None | 359,894 | - |
Source: Clifford Grammich, Kirk Hadaway, Richard Houseal, Dale E.Jones, Alexei Krindatch, Richie Stanley and Richard H.Taylor. 2012. 2010 U.S.Religion Census: Religious Congregations & Membership Study. Association of Statisticians of American Religious Bodies. Jones, Dale E., et al. 2002. Congregations and Membership in the United States 2000. Nashville, TN: Glenmary Research Center.
Food Environment Statistics:
| DeKalb County: | 1.75 / 10,000 pop. |
| State: | 1.91 / 10,000 pop. |
| Here: | 0.04 / 10,000 pop. |
| Georgia: | 0.15 / 10,000 pop. |
| This county: | 0.82 / 10,000 pop. |
| Georgia: | 0.86 / 10,000 pop. |
| DeKalb County: | 3.53 / 10,000 pop. |
| Georgia: | 5.12 / 10,000 pop. |
| This county: | 7.09 / 10,000 pop. |
| State: | 7.41 / 10,000 pop. |
| DeKalb County: | 9.6% |
| Georgia: | 10.4% |
| DeKalb County: | 27.4% |
| State: | 27.8% |
| Here: | 15.5% |
| State: | 14.6% |
Agriculture in DeKalb County:
Average size of farms: 29 acresAverage value of agricultural products sold per farm: $23,158
Average value of crops sold per acre for harvested cropland: $7471.57
The value of nursery, greenhouse, floriculture, and sod as a percentage of the total market value of agricultural products sold: 94.00%
The value of livestock, poultry, and their products as a percentage of the total market value of agricultural products sold: 0.59%
Average total farm production expenses per farm: $30,964
Harvested cropland as a percentage of land in farms: 10.50%
Irrigated harvested cropland as a percentage of land in farms: 7.89%
Average market value of all machinery and equipment per farm: $13,631
The percentage of farms operated by a family or individual: 86.49%
Average age of principal farm operators: 56 years
Average number of cattle and calves per 100 acres of all land in farms: 23.20
Earthquake activity:
DeKalb County-area historical earthquake activity is significantly above Georgia state average. It is 50% greater than the overall U.S. average.On 4/29/2003 at 08:59:39, a magnitude 4.9 (4.4 MB, 4.6 MW, 4.9 LG, Class: Light, Intensity: IV - V) earthquake occurred 92.3 miles away from DeKalb County center
On 8/2/1974 at 08:52:09, a magnitude 4.9 (4.3 MB, 4.9 LG) earthquake occurred 101.8 miles away from the county center
On 4/29/2003 at 08:59:39, a magnitude 4.6 (4.6 MW, Depth: 12.3 mi) earthquake occurred 92.4 miles away from the county center
On 11/30/1973 at 07:48:41, a magnitude 4.7 (4.7 MB, 4.6 ML) earthquake occurred 139.9 miles away from the county center
On 1/18/1999 at 07:00:53, a magnitude 4.8 (4.8 MB, 4.0 LG, Depth: 0.6 mi) earthquake occurred 174.7 miles away from DeKalb County center
On 8/9/2020 at 12:07:37, a magnitude 5.1 (5.1 MW, Depth: 4.7 mi, Class: Moderate, Intensity: VI - VII) earthquake occurred 257.9 miles away from the county center
Magnitude types: regional Lg-wave magnitude (LG), body-wave magnitude (MB), local magnitude (ML), moment magnitude (MW)
Most recent natural disasters:
- Georgia Covid-19 Pandemic, Incident Period: January 20, 2020, FEMA Id: 4501, Natural disaster type: Other
- Georgia Severe Winter Storm, Incident Period: February 10, 2014 to February 14, 2014, Emergency Declared EM-3368: February 11, 2014, FEMA Id: 3368, Natural disaster type: Winter Storm
- Georgia Severe Storms and Flooding, Incident Period: September 18, 2009 to October 08, 2009, Major Disaster (Presidential) Declared DR-1858: September 24, 2009, FEMA Id: 1858, Natural disaster type: Storm, Flood
- Georgia Severe Storms and Tornadoes, Incident Period: March 14, 2008 to March 16, 2008, Major Disaster (Presidential) Declared DR-1750: March 20, 2008, FEMA Id: 1750, Natural disaster type: Storm, Tornado
- Georgia Hurricane Katrina Evacuation, Incident Period: August 27, 2005 to October 01, 2005, Emergency Declared EM-3218: September 05, 2005, FEMA Id: 3218, Natural disaster type: Hurricane
- Georgia Hurricane Ivan, Incident Period: September 14, 2004 to October 30, 2004, Major Disaster (Presidential) Declared DR-1554: September 18, 2004, FEMA Id: 1554, Natural disaster type: Hurricane
- Georgia Winter Storm, Incident Period: January 22, 2000 to February 01, 2000, Major Disaster (Presidential) Declared DR-1311: January 28, 2000, FEMA Id: 1311, Natural disaster type: Winter Storm
- Georgia Severe Storms, Tornadoes and Flooding, Incident Period: February 14, 1998 to May 11, 1998, Major Disaster (Presidential) Declared DR-1209: March 11, 1998, FEMA Id: 1209, Natural disaster type: Storm, Tornado, Flood
- Georgia Hurricane Opal, Incident Period: October 04, 1995 to October 05, 1995, Major Disaster (Presidential) Declared DR-1071: October 10, 1995, FEMA Id: 1071, Natural disaster type: Hurricane
- Georgia Severe Snowfall, Winter Storm, Incident Period: March 13, 1993 to March 17, 1993, Emergency Declared EM-3097: March 15, 1993, FEMA Id: 3097, Natural disaster type: Winter Storm, Snowfall
- 2 other natural disasters have been reported since 1953.
The number of natural disasters in DeKalb County (12) is smaller than the US average (15).
Major Disasters (Presidential) Declared: 7
Emergencies Declared: 4
Causes of natural disasters: Floods: 3, Hurricanes: 3, Storms: 3, Tornadoes: 3, Winter Storms: 3, Drought: 1, Snowfall: 1, Other: 1 (Note: some incidents may be assigned to more than one category).
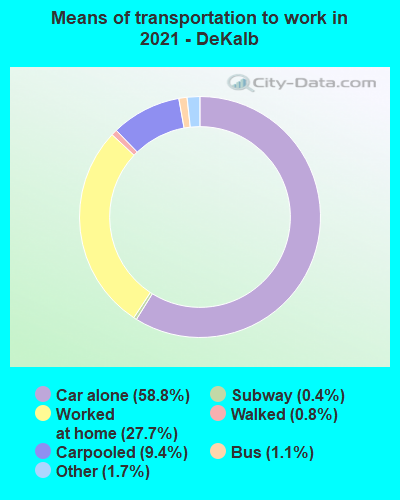
Means of transportation to work:
- Drove a car alone: 222,781 (62.0%)
- Carpooled: 27,237 (7.6%)
- Bus: 6,683 (1.9%)
- Subway or elevated rail: 805 (0.2%)
- Long-distance train or commuter rail: 273 (0.1%)
- Light rail, streetcar or trolley: 278 (0.1%)
- Taxicab, motorcycle, or other means: 5,586 (1.6%)
- Bicycle: 1,428 (0.4%)
- Walked: 4,815 (1.3%)
- Worked at home: 89,390 (24.9%)
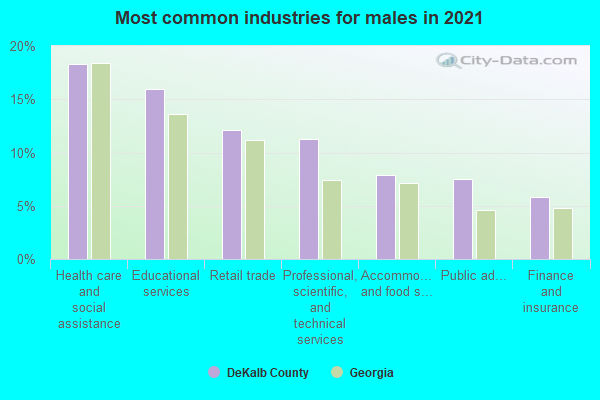
- Health care and social assistance (19%)
- Educational services (13%)
- Professional, scientific, and technical services (13%)
- Retail trade (10%)
- Public administration (7%)
- Accommodation and food services (7%)
- Finance and insurance (6%)
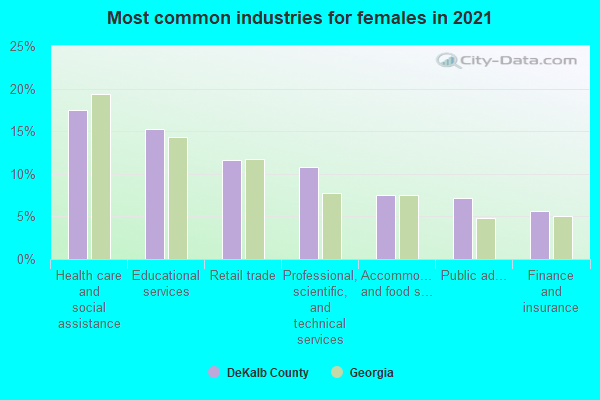
- Health care and social assistance (18%)
- Educational services (12%)
- Professional, scientific, and technical services (12%)
- Retail trade (10%)
- Public administration (7%)
- Accommodation and food services (7%)
- Finance and insurance (5%)
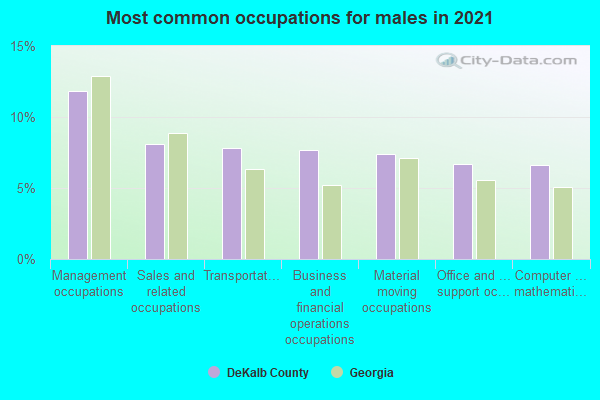
- Management occupations (13%)
- Sales and related occupations (9%)
- Business and financial operations occupations (8%)
- Transportation occupations (7%)
- Material moving occupations (7%)
- Office and administrative support occupations (7%)
- Computer and mathematical occupations (7%)
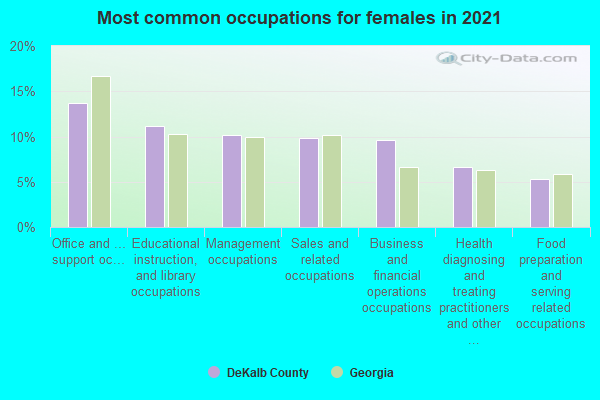
- Office and administrative support occupations (14%)
- Management occupations (13%)
- Business and financial operations occupations (10%)
- Sales and related occupations (9%)
- Educational instruction, and library occupations (9%)
- Health diagnosing and treating practitioners and other technical occupations (6%)
- Food preparation and serving related occupations (5%)
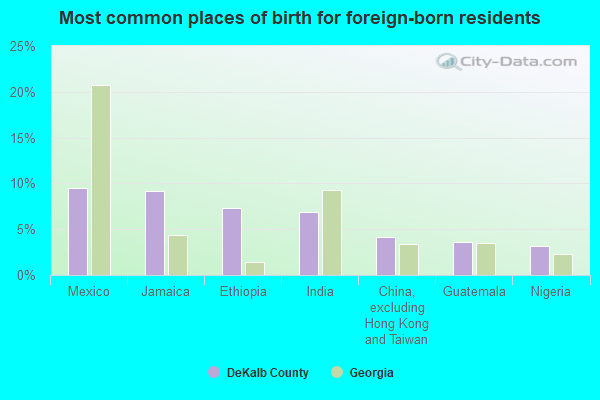
- Jamaica (10%)
- Mexico (9%)
- Ethiopia (8%)
- India (8%)
- Guatemala (5%)
- Nigeria (4%)
- China, excluding Hong Kong and Taiwan (4%)
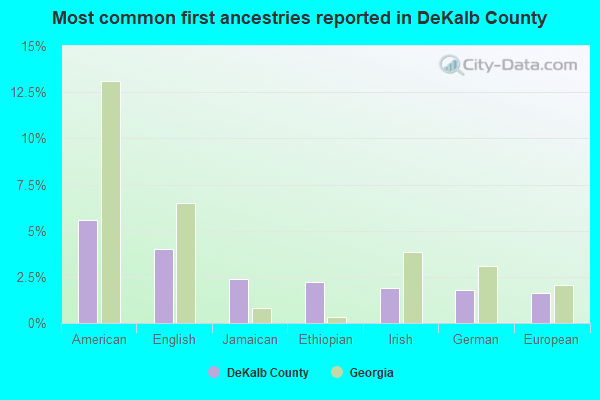
- American (6%)
- English (4%)
- Jamaican (3%)
- Ethiopian (3%)
- German (2%)
- Irish (2%)
- African (2%)
People in group quarters in DeKalb County, Georgia in 2010:
- 5,034 people in college/university student housing
- 3,219 people in local jails and other municipal confinement facilities
- 1,935 people in nursing facilities/skilled-nursing facilities
- 735 people in state prisons
- 501 people in correctional residential facilities
- 429 people in group homes intended for adults
- 306 people in workers' group living quarters and job corps centers
- 239 people in residential treatment centers for adults
- 177 people in emergency and transitional shelters (with sleeping facilities) for people experiencing homelessness
- 167 people in group homes for juveniles (non-correctional)
- 134 people in mental (psychiatric) hospitals and psychiatric units in other hospitals
- 69 people in other noninstitutional facilities
- 59 people in correctional facilities intended for juveniles
- 36 people in in-patient hospice facilities
- 9 people in residential treatment centers for juveniles (non-correctional)
People in group quarters in DeKalb County, Georgia in 2000:
- 4,086 people in college dormitories (includes college quarters off campus)
- 2,486 people in local jails and other confinement facilities (including police lockups)
- 2,409 people in other noninstitutional group quarters
- 2,164 people in nursing homes
- 695 people in state prisons
- 429 people in mental (psychiatric) hospitals or wards
- 344 people in homes or halfway houses for drug/alcohol abuse
- 306 people in hospitals or wards for drug/alcohol abuse
- 146 people in hospitals/wards and hospices for chronically ill
- 110 people in other group homes
- 98 people in homes for the mentally ill
- 96 people in schools, hospitals, or wards for the intellectually disabled
- 89 people in other hospitals or wards for chronically ill
- 78 people in homes for the mentally retarded
- 71 people in training schools for juvenile delinquents
- 71 people in short-term care, detention or diagnostic centers for delinquent children
- 51 people in hospices or homes for chronically ill
- 35 people in homes for the physically handicapped
- 23 people in wards in general hospitals for patients who have no usual home elsewhere
- 17 people in religious group quarters
- 7 people in other nonhousehold living situations
- 6 people in military hospitals or wards for chronically ill
11.63% of this county's 2021 resident taxpayers lived in other counties in 2020 ($62,119 average adjusted gross income)
| Here: | 11.63% |
| Georgia average: | 10.21% |
0.02% of residents moved from foreign countries ($97 average AGI)
DeKalb County: 0.02% Georgia average: 0.04%
7.53% relocated from other counties in Georgia ($40,348 average AGI)
4.08% relocated from other states ($21,673 average AGI)
DeKalb County: 4.08% Georgia average: 3.80%
Top counties from which taxpayers relocated into this county between 2020 and 2021:
| from Fulton County, GA | |
| from Gwinnett County, GA | |
| from Cobb County, GA | |
| from Clayton County, GA | |
| from Rockdale County, GA | |
| from Henry County, GA | |
| from Newton County, GA |
12.30% of this county's 2020 resident taxpayers moved to other counties in 2021 ($66,119 average adjusted gross income)
| Here: | 12.30% |
| Georgia average: | 9.60% |
0.01% of residents moved to foreign countries ($74 average AGI)
DeKalb County: 0.01% Georgia average: 0.03%
8.83% relocated to other counties in Georgia ($45,650 average AGI)
3.45% relocated to other states ($20,396 average AGI)
DeKalb County: 3.45% Georgia average: 3.15%

Top counties to which taxpayers relocated from this county between 2020 and 2021:
| to Fulton County, GA | |
| to Gwinnett County, GA | |
| to Cobb County, GA | |
| to Clayton County, GA | |
| to Henry County, GA | |
| to Rockdale County, GA | |
| to Newton County, GA |
Births per 1000 population from 1990 to 1999: 15.9
Births per 1000 population from 2000 to 2009: 16.2
Births per 1000 population from 2010 to 2022: 12.5
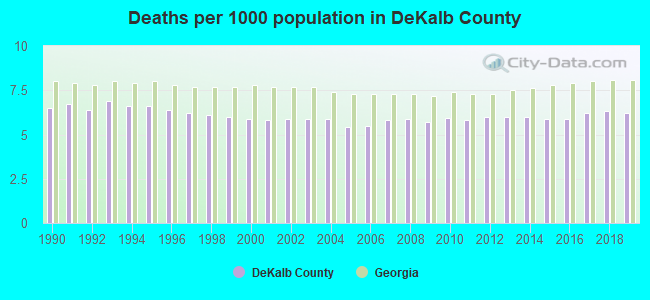
Deaths per 1000 population from 1990 to 1999: 6.4
Deaths per 1000 population from 2000 to 2009: 5.8
Deaths per 1000 population from 2010 to 2020: 6.1
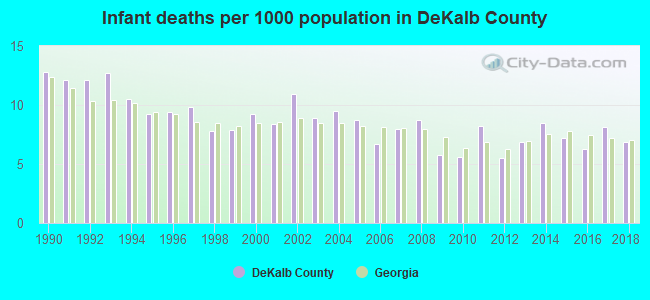
Infant deaths per 1000 live births from 1990 to 1999: 10.4
Infant deaths per 1000 live births from 2000 to 2009: 8.5
Infant deaths per 1000 live births from 2010 to 2021: 7.0
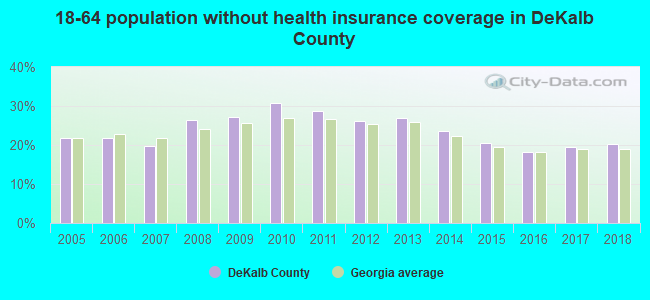
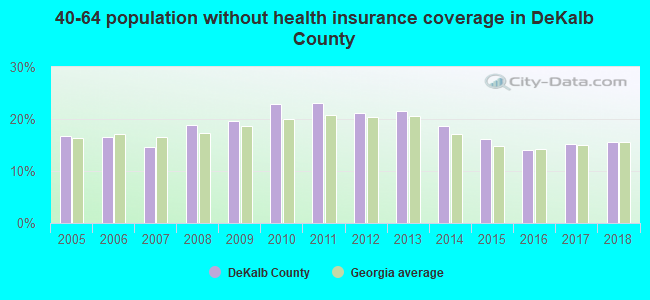
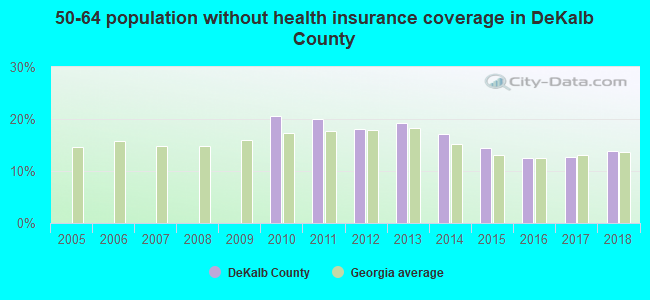
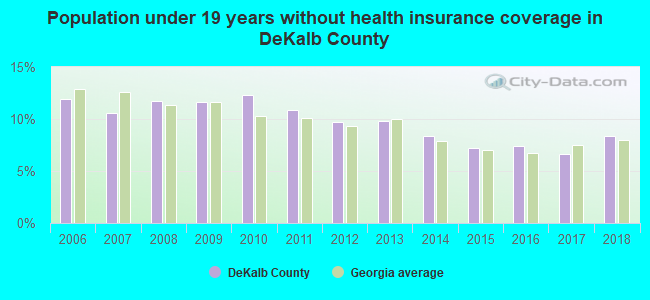
Persons under 19 years old without health insurance coverage in 2018: 8.4%
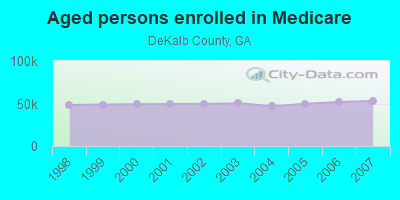
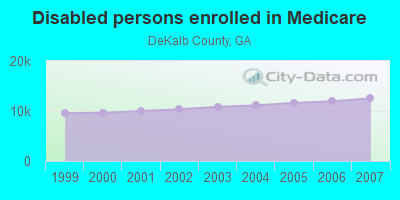
Persons enrolled in hospital insurance and/or supplemental medical insurance (Medicare) in July 1, 2007: 65,700 (53,133 aged, 12,567 disabled)
Children under 18 without health insurance coverage in 2007: 17,978 (10%)

Most common underlying causes of death in DeKalb County, Georgia in 1999 - 2019:
- Bronchus or lung, unspecified - Malignant neoplasms (4,371)
- Atherosclerotic heart disease (3,719)
- Unspecified dementia (3,666)
- Congestive heart failure (2,457)
- Acute myocardial infarction, unspecified (2,416)
- Stroke, not specified as haemorrhage or infarction (2,394)
- Alzheimer disease, unspecified (2,308)
- Chronic obstructive pulmonary disease, unspecified (2,273)
- Hypertensive heart disease without (congestive) heart failure (1,977)
- Breast, unspecified - Malignant neoplasms (1,855)
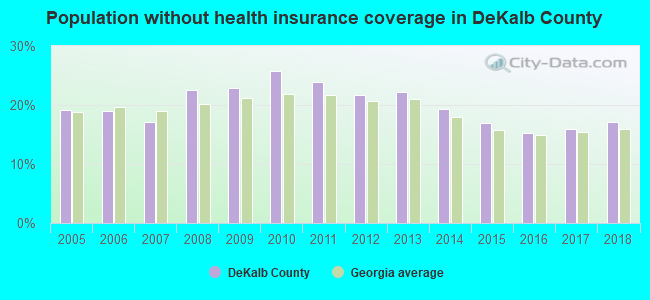
Population without health insurance coverage in 2000: 16%
Children under 18 without health insurance coverage in 2000: 16%
Short term general hospital admissions per 100,000 population in 2004: 8,321
Short term general hospital beds per 100,000 population in 2004: 198
Emergency room visits per 100,000 population in 2004: 20,307
General practice office based MDs per 100,000 population in 2005: 1,619
Medical specialist MDs per 100,000 population in 2005: 617
Dentists per 100,000 population in 1998: 13
Total births per 100,000 population, July 2005 - July 2006 : 41
Total deaths per 100,000 population, July 2005 - July 2006: 88
Limited-service eating places per 100,000 population in 2005 : 9
Beer, wine & liquor stores per 100,000 population in 2005: 1
Fitness & recreation sports centers per 100,000 population in 2005: 10,334
EPA green book nonattainment status in 2004-2006: 1
Homicides per 1,000,000 population from 2000 to 2006: 125.5. This is more than state average.
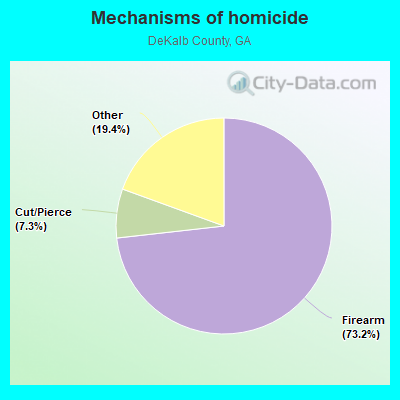
- Firearm - 91.9
- Cut/Pierce - 9.2
- Other - 24.4
Suicides per 1,000,000 population from 2000 to 2006: 84.0. This is less than state average.
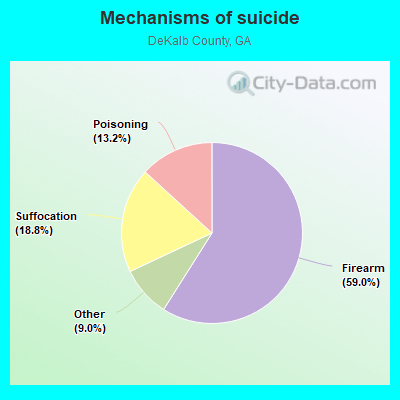
- Firearm - 49.6
- Suffocation - 15.8
- Poisoning - 11.1
- Other - 7.6
Household type by relationship:
Households: 762,820- Male householders: 121,094 (36,201 living alone), Female householders: 158,767 (54,900 living alone)
106,647 spouses (103,825 opposite-sex spouses), 20,822 unmarried partners, (18,066 opposite-sex unmarried partners), 230,564 children (218,984 natural, 3,692 adopted, 7,888 stepchildren), 27,068 grandchildren, 15,677 brothers or sisters, 13,116 parents, 2,122 foster children, 22,893 other relatives, 33,390 non-relatives
- In group quarters: 10,660
Size of family households: 69,261 2-persons, 43,548 3-persons, 28,840 4-persons, 12,437 5-persons, 5,625 6-persons, 3,651 7-or-more-persons.
Size of nonfamily households: 91,101 1-person, 21,019 2-persons, 3,347 3-persons, 473 4-persons, 515 5-persons, 44 7-or-more-persons.
89,894 married couples with children.
51,829 single-parent households (8,825 men, 43,004 women).
81.0% of residents of DeKalb speak English at home.
6.4% of residents speak Spanish at home (54% speak English very well, 16% speak English well, 20% speak English not well, 10% don't speak English at all).
4.9% of residents speak other Indo-European language at home (68% speak English very well, 19% speak English well, 11% speak English not well, 2% don't speak English at all).
3.1% of residents speak Asian or Pacific Island language at home (63% speak English very well, 18% speak English well, 14% speak English not well, 5% don't speak English at all).
4.6% of residents speak other language at home (76% speak English very well, 15% speak English well, 7% speak English not well, 1% don't speak English at all).
In fiscal year 2004:
Federal Government expenditure: $2,909,879,000 ($4,306 per capita)
Department of Defense expenditure: $183,923,000
Federal direct payments to individuals for retirement and disability: $826,965,000
Federal other direct payments to individuals: $596,208,000
Federal direct payments not to individuals: $8,688,000
Federal grants: $463,396,000
Federal procurement contracts: $121,909,000 ($34,640,000 Department of Defense)
Federal salaries and wages: $892,712,000 ($71,311,000 Department of Defense)
Federal Government direct loans: $65,000
Federal guaranteed/insured loans: $698,685,000
Federal Government insurance: $317,589,000
Population change from April 1, 2000 to July 1, 2005:
Births: 60,340| Here: | 89 per 1000 residents |
| State: | 79 per 1000 residents |
Deaths: 21,842
| Here: | 32 per 1000 residents |
| State: | 38 per 1000 residents |
Net international migration: +38,772
| Here: | +57 per 1000 residents |
| State: | +21 per 1000 residents |
Net internal migration: -64,393
| Here: | |
| State: |
Total withdrawal of fresh water for public supply: 86.72 millions of gallons per day (all from surface)
| Here: | 6.9 |
| State: | 6.8 |
| Here: | 4.2 |
| State: | 4.6 |

- Year house built in DeKalb County, Georgia
- 8,4422020 or later
- 31,5932010 to 2019
- 58,1752000 to 2009
- 39,5451990 to 1999
- 51,1721980 to 1989
- 48,3531970 to 1979
- 40,6781960 to 1969
- 31,7621950 to 1959
- 8,9401940 to 1949
- 12,1051939 or earlier
- Rooms in owner-occupied houses in DeKalb County, Georgia
- 1901 room
- 3692 rooms
- 2,6973 rooms
- 14,3084 rooms
- 26,2205 rooms
- 30,7226 rooms
- 24,1717 rooms
- 25,1628 rooms
- 44,3739+ rooms
- Rooms in renter-occupied apartments in DeKalb County, Georgia
- 3,9601 room
- 7,7072 rooms
- 22,0813 rooms
- 29,8884 rooms
- 22,2635 rooms
- 11,3486 rooms
- 6,4447 rooms
- 4,0248 rooms
- 3,9349+ rooms
- Bedrooms in owner-occupied houses in DeKalb County, Georgia
- 364no bedroom
- 2,8381 bedroom
- 20,1042 bedrooms
- 71,4663 bedrooms
- 55,0154 bedrooms
- 18,4255+ bedrooms
- Bedrooms in renter-occupied apartments in DeKalb County, Georgia
- 4,325no bedroom
- 28,0301 bedroom
- 48,9732 bedrooms
- 22,3283 bedrooms
- 6,4504 bedrooms
- 1,5435+ bedrooms
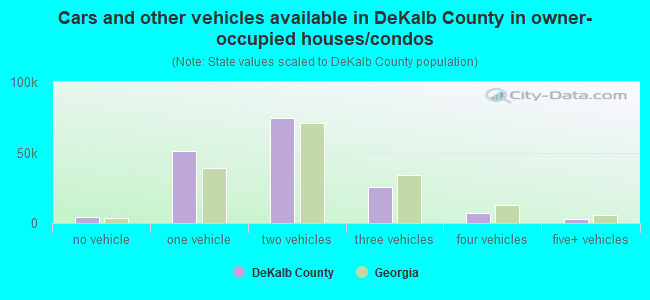
- Cars and other vehicles available in DeKalb County in owner-occupied houses/condos
- 4,854no vehicle
- 54,2161 vehicle
- 69,8512 vehicles
- 28,6383 vehicles
- 6,9384 vehicles
- 3,7155+ vehicles
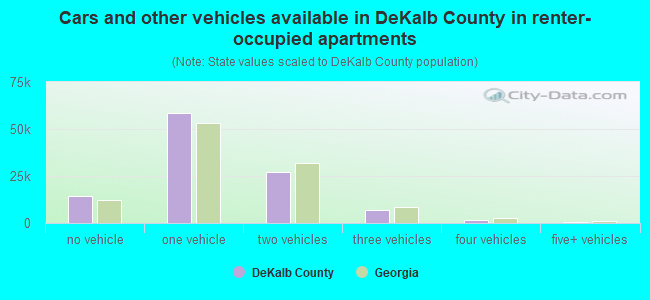
- Cars and other vehicles available in DeKalb County in renter-occupied apartments
- 14,699no vehicle
- 62,1201 vehicle
- 27,3232 vehicles
- 5,8993 vehicles
- 1,3464 vehicles
- 2625+ vehicles
85.1% of DeKalb County residents lived in the same house 1 years ago.
Out of people who lived in different houses, 30% lived in this county.
Out of people who lived in different counties, 63% lived in Georgia.
| DeKalb County: | 85.1% |
| State average: | 86.6% |
Place of birth for U.S.-born residents:
- This state: 356,108
- Other state: 273,748
- Northeast: 65,269
- Midwest: 55,537
- South: 129,086
- West: 23,856
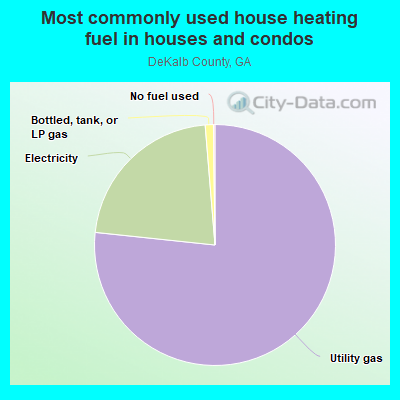
- 75.3%Utility gas
- 23.1%Electricity
- 1.3%Bottled, tank, or LP gas
- 0.2%No fuel used
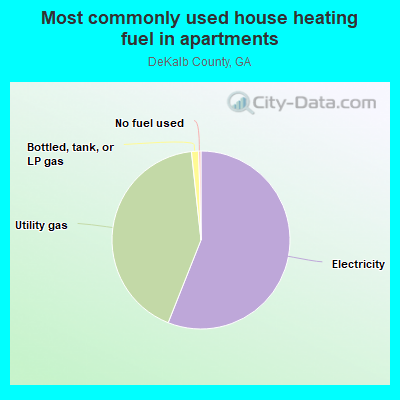
- 55.5%Electricity
- 42.1%Utility gas
- 1.6%Bottled, tank, or LP gas
- 0.5%No fuel used
- 0.1%Other fuel
Private vs. public school enrollment:
| Here: | 14.9% |
| Georgia: | 12.1% |
| Here: | 11.2% |
| Georgia: | 10.8% |
| Here: | 19.6% |
| Georgia: | 17.1% |

DeKalb County government finances - Expenditure in 2018:
- Bond Funds - Cash and Securities: $199,978,000
Cash and Securities: $88,571,000
- Charges - Sewerage: $226,577,000
Sewerage: $179,856,000
Solid Waste Management: $70,406,000
Solid Waste Management: $67,438,000
Other: $64,940,000
Other: $27,762,000
Air Transportation: $5,008,000
Parks and Recreation: $1,765,000
Parking Facilities: $602,000
Parking Facilities: $567,000
Parks and Recreation: $283,000
- Construction - Water Utilities: $92,163,000
Sewerage: $61,443,000
- Current Operations - Judicial and Legal Services: $187,717,000
Judicial and Legal Services: $166,166,000
Sewerage: $109,148,000
Police Protection: $108,096,000
Police Protection: $105,071,000
Water Utilities: $84,969,000
Solid Waste Management: $76,997,000
Local Fire Protection: $71,439,000
Water Utilities: $66,160,000
Sewerage: $56,646,000
Solid Waste Management: $56,542,000
General - Other: $55,888,000
Correctional Institutions: $55,527,000
Local Fire Protection: $52,256,000
General - Other: $52,237,000
Regular Highways: $48,369,000
Health - Other: $31,270,000
Health - Other: $29,836,000
Regular Highways: $26,132,000
Financial Administration: $24,622,000
Financial Administration: $24,543,000
Libraries: $19,508,000
General Public Buildings: $17,310,000
Libraries: $16,740,000
Parks and Recreation: $15,959,000
Central Staff Services: $14,806,000
Central Staff Services: $14,776,000
General Public Buildings: $14,261,000
Parks and Recreation: $9,967,000
Public Welfare - Other: $8,648,000
Public Welfare - Other: $5,692,000
Protective Inspection and Regulation - Other: $4,222,000
Protective Inspection and Regulation - Other: $3,663,000
Natural Resources - Other: $407,000
Natural Resources - Other: $313,000
- Federal Intergovernmental - Housing and Community Development: $35,700,000
General Local Government Support: $8,116,000
Other: $570,000
- General - Interest on Debt: $52,050,000
Interest on Debt: $48,254,000
- Local Intergovernmental - Other: $1,737,000
General Local Government Support: $708,000
- Long Term Debt - Beginning Outstanding - Unspecified Public Purpose: $1,097,719,000
Outstanding Unspecified Public Purpose: $1,048,691,000
Beginning Outstanding - Unspecified Public Purpose: $996,918,000
Outstanding Unspecified Public Purpose: $941,756,000
Beginning Outstanding - Public Debt for Private Purpose: $521,812,000
Outstanding Nonguaranteed - Industrial Revenue: $521,812,000
Beginning Outstanding - Public Debt for Private Purpose: $521,812,000
Outstanding Nonguaranteed - Industrial Revenue: $521,812,000
Retired Unspecified Public Purpose: $81,978,000
Retired Unspecified Public Purpose: $55,162,000
Issue, Unspecified Public Purpose: $32,950,000
- Miscellaneous - Fines and Forfeits: $23,188,000
Fines and Forfeits: $20,061,000
General Revenue - Other: $13,495,000
Rents: $7,723,000
Interest Earnings: $7,223,000
General Revenue - Other: $6,597,000
Rents: $6,479,000
Donations From Private Sources: $5,384,000
Special Assessments: $5,129,000
Special Assessments: $5,005,000
Interest Earnings: $4,363,000
Sale of Property: $1,479,000
Sale of Property: $626,000
Donations From Private Sources: $44,000
- Other Funds - Cash and Securities: $238,158,000
Cash and Securities: $215,001,000
- Revenue - Water Utilities: $73,907,000
Water Utilities: $45,830,000
- Sinking Funds - Cash and Securities: $541,079,000
Cash and Securities: $538,548,000
- State Intergovernmental - Housing and Community Development: $16,195,000
Other: $12,192,000
Housing and Community Development: $7,142,000
Other: $3,010,000
General Local Government Support: $92,000
- Tax - Property: $374,918,000
Property: $352,440,000
General Sales and Gross Receipts: $189,760,000
General Sales and Gross Receipts: $94,436,000
Insurance Premiums Sales: $29,164,000
Insurance Premiums Sales: $27,520,000
Occupation and Business License - Other: $18,918,000
Occupation and Business License - Other: $14,750,000
Other License: $8,140,000
Other License: $8,015,000
Other Selective Sales: $5,347,000
Alcoholic Beverage Sales: $3,809,000
Alcoholic Beverage Sales: $3,741,000
Other Selective Sales: $3,455,000
Alcoholic Beverage License: $1,763,000
Other: $1,136,000
Other: $1,100,000
Alcoholic Beverage License: $610,000
- Total Salaries and Wages: $973,000
- Water Utilities - Interest on Debt: $25,247,000
DeKalb County government finances - Revenue in 2018:
- Bond Funds - Cash and Securities: $199,978,000
Cash and Securities: $88,571,000
- Charges - Sewerage: $226,577,000
Sewerage: $179,856,000
Solid Waste Management: $70,406,000
Solid Waste Management: $67,438,000
Other: $64,940,000
Other: $27,762,000
Air Transportation: $5,008,000
Parks and Recreation: $1,765,000
Parking Facilities: $602,000
Parking Facilities: $567,000
Parks and Recreation: $283,000
- Construction - Water Utilities: $92,163,000
Sewerage: $61,443,000
- Current Operations - Judicial and Legal Services: $187,717,000
Judicial and Legal Services: $166,166,000
Sewerage: $109,148,000
Police Protection: $108,096,000
Police Protection: $105,071,000
Water Utilities: $84,969,000
Solid Waste Management: $76,997,000
Local Fire Protection: $71,439,000
Water Utilities: $66,160,000
Sewerage: $56,646,000
Solid Waste Management: $56,542,000
General - Other: $55,888,000
Correctional Institutions: $55,527,000
Local Fire Protection: $52,256,000
General - Other: $52,237,000
Regular Highways: $48,369,000
Health - Other: $31,270,000
Health - Other: $29,836,000
Regular Highways: $26,132,000
Financial Administration: $24,622,000
Financial Administration: $24,543,000
Libraries: $19,508,000
General Public Buildings: $17,310,000
Libraries: $16,740,000
Parks and Recreation: $15,959,000
Central Staff Services: $14,806,000
Central Staff Services: $14,776,000
General Public Buildings: $14,261,000
Parks and Recreation: $9,967,000
Public Welfare - Other: $8,648,000
Public Welfare - Other: $5,692,000
Protective Inspection and Regulation - Other: $4,222,000
Protective Inspection and Regulation - Other: $3,663,000
Natural Resources - Other: $407,000
Natural Resources - Other: $313,000
- Federal Intergovernmental - Housing and Community Development: $35,700,000
General Local Government Support: $8,116,000
Other: $570,000
- General - Interest on Debt: $52,050,000
Interest on Debt: $48,254,000
- Local Intergovernmental - Other: $1,737,000
General Local Government Support: $708,000
- Long Term Debt - Beginning Outstanding - Unspecified Public Purpose: $1,097,719,000
Outstanding Unspecified Public Purpose: $1,048,691,000
Beginning Outstanding - Unspecified Public Purpose: $996,918,000
Outstanding Unspecified Public Purpose: $941,756,000
Beginning Outstanding - Public Debt for Private Purpose: $521,812,000
Outstanding Nonguaranteed - Industrial Revenue: $521,812,000
Beginning Outstanding - Public Debt for Private Purpose: $521,812,000
Outstanding Nonguaranteed - Industrial Revenue: $521,812,000
Retired Unspecified Public Purpose: $81,978,000
Retired Unspecified Public Purpose: $55,162,000
Issue, Unspecified Public Purpose: $32,950,000
- Miscellaneous - Fines and Forfeits: $23,188,000
Fines and Forfeits: $20,061,000
General Revenue - Other: $13,495,000
Rents: $7,723,000
Interest Earnings: $7,223,000
General Revenue - Other: $6,597,000
Rents: $6,479,000
Donations From Private Sources: $5,384,000
Special Assessments: $5,129,000
Special Assessments: $5,005,000
Interest Earnings: $4,363,000
Sale of Property: $1,479,000
Sale of Property: $626,000
Donations From Private Sources: $44,000
- Other Funds - Cash and Securities: $238,158,000
Cash and Securities: $215,001,000
- Revenue - Water Utilities: $73,907,000
Water Utilities: $45,830,000
- Sinking Funds - Cash and Securities: $541,079,000
Cash and Securities: $538,548,000
- State Intergovernmental - Housing and Community Development: $16,195,000
Other: $12,192,000
Housing and Community Development: $7,142,000
Other: $3,010,000
General Local Government Support: $92,000
- Tax - Property: $374,918,000
Property: $352,440,000
General Sales and Gross Receipts: $189,760,000
General Sales and Gross Receipts: $94,436,000
Insurance Premiums Sales: $29,164,000
Insurance Premiums Sales: $27,520,000
Occupation and Business License - Other: $18,918,000
Occupation and Business License - Other: $14,750,000
Other License: $8,140,000
Other License: $8,015,000
Other Selective Sales: $5,347,000
Alcoholic Beverage Sales: $3,809,000
Alcoholic Beverage Sales: $3,741,000
Other Selective Sales: $3,455,000
Alcoholic Beverage License: $1,763,000
Other: $1,136,000
Other: $1,100,000
Alcoholic Beverage License: $610,000
- Total Salaries and Wages: $973,000
- Water Utilities - Interest on Debt: $25,247,000
DeKalb County government finances - Debt in 2018:
- Bond Funds - Cash and Securities: $199,978,000
Cash and Securities: $88,571,000
- Charges - Sewerage: $226,577,000
Sewerage: $179,856,000
Solid Waste Management: $70,406,000
Solid Waste Management: $67,438,000
Other: $64,940,000
Other: $27,762,000
Air Transportation: $5,008,000
Parks and Recreation: $1,765,000
Parking Facilities: $602,000
Parking Facilities: $567,000
Parks and Recreation: $283,000
- Construction - Water Utilities: $92,163,000
Sewerage: $61,443,000
- Current Operations - Judicial and Legal Services: $187,717,000
Judicial and Legal Services: $166,166,000
Sewerage: $109,148,000
Police Protection: $108,096,000
Police Protection: $105,071,000
Water Utilities: $84,969,000
Solid Waste Management: $76,997,000
Local Fire Protection: $71,439,000
Water Utilities: $66,160,000
Sewerage: $56,646,000
Solid Waste Management: $56,542,000
General - Other: $55,888,000
Correctional Institutions: $55,527,000
Local Fire Protection: $52,256,000
General - Other: $52,237,000
Regular Highways: $48,369,000
Health - Other: $31,270,000
Health - Other: $29,836,000
Regular Highways: $26,132,000
Financial Administration: $24,622,000
Financial Administration: $24,543,000
Libraries: $19,508,000
General Public Buildings: $17,310,000
Libraries: $16,740,000
Parks and Recreation: $15,959,000
Central Staff Services: $14,806,000
Central Staff Services: $14,776,000
General Public Buildings: $14,261,000
Parks and Recreation: $9,967,000
Public Welfare - Other: $8,648,000
Public Welfare - Other: $5,692,000
Protective Inspection and Regulation - Other: $4,222,000
Protective Inspection and Regulation - Other: $3,663,000
Natural Resources - Other: $407,000
Natural Resources - Other: $313,000
- Federal Intergovernmental - Housing and Community Development: $35,700,000
General Local Government Support: $8,116,000
Other: $570,000
- General - Interest on Debt: $52,050,000
Interest on Debt: $48,254,000
- Local Intergovernmental - Other: $1,737,000
General Local Government Support: $708,000
- Long Term Debt - Beginning Outstanding - Unspecified Public Purpose: $1,097,719,000
Outstanding Unspecified Public Purpose: $1,048,691,000
Beginning Outstanding - Unspecified Public Purpose: $996,918,000
Outstanding Unspecified Public Purpose: $941,756,000
Beginning Outstanding - Public Debt for Private Purpose: $521,812,000
Outstanding Nonguaranteed - Industrial Revenue: $521,812,000
Beginning Outstanding - Public Debt for Private Purpose: $521,812,000
Outstanding Nonguaranteed - Industrial Revenue: $521,812,000
Retired Unspecified Public Purpose: $81,978,000
Retired Unspecified Public Purpose: $55,162,000
Issue, Unspecified Public Purpose: $32,950,000
- Miscellaneous - Fines and Forfeits: $23,188,000
Fines and Forfeits: $20,061,000
General Revenue - Other: $13,495,000
Rents: $7,723,000
Interest Earnings: $7,223,000
General Revenue - Other: $6,597,000
Rents: $6,479,000
Donations From Private Sources: $5,384,000
Special Assessments: $5,129,000
Special Assessments: $5,005,000
Interest Earnings: $4,363,000
Sale of Property: $1,479,000
Sale of Property: $626,000
Donations From Private Sources: $44,000
- Other Funds - Cash and Securities: $238,158,000
Cash and Securities: $215,001,000
- Revenue - Water Utilities: $73,907,000
Water Utilities: $45,830,000
- Sinking Funds - Cash and Securities: $541,079,000
Cash and Securities: $538,548,000
- State Intergovernmental - Housing and Community Development: $16,195,000
Other: $12,192,000
Housing and Community Development: $7,142,000
Other: $3,010,000
General Local Government Support: $92,000
- Tax - Property: $374,918,000
Property: $352,440,000
General Sales and Gross Receipts: $189,760,000
General Sales and Gross Receipts: $94,436,000
Insurance Premiums Sales: $29,164,000
Insurance Premiums Sales: $27,520,000
Occupation and Business License - Other: $18,918,000
Occupation and Business License - Other: $14,750,000
Other License: $8,140,000
Other License: $8,015,000
Other Selective Sales: $5,347,000
Alcoholic Beverage Sales: $3,809,000
Alcoholic Beverage Sales: $3,741,000
Other Selective Sales: $3,455,000
Alcoholic Beverage License: $1,763,000
Other: $1,136,000
Other: $1,100,000
Alcoholic Beverage License: $610,000
- Total Salaries and Wages: $973,000
- Water Utilities - Interest on Debt: $25,247,000
DeKalb County government finances - Cash and Securities in 2018:
- Bond Funds - Cash and Securities: $199,978,000
Cash and Securities: $88,571,000
- Charges - Sewerage: $226,577,000
Sewerage: $179,856,000
Solid Waste Management: $70,406,000
Solid Waste Management: $67,438,000
Other: $64,940,000
Other: $27,762,000
Air Transportation: $5,008,000
Parks and Recreation: $1,765,000
Parking Facilities: $602,000
Parking Facilities: $567,000
Parks and Recreation: $283,000
- Construction - Water Utilities: $92,163,000
Sewerage: $61,443,000
- Current Operations - Judicial and Legal Services: $187,717,000
Judicial and Legal Services: $166,166,000
Sewerage: $109,148,000
Police Protection: $108,096,000
Police Protection: $105,071,000
Water Utilities: $84,969,000
Solid Waste Management: $76,997,000
Local Fire Protection: $71,439,000
Water Utilities: $66,160,000
Sewerage: $56,646,000
Solid Waste Management: $56,542,000
General - Other: $55,888,000
Correctional Institutions: $55,527,000
Local Fire Protection: $52,256,000
General - Other: $52,237,000
Regular Highways: $48,369,000
Health - Other: $31,270,000
Health - Other: $29,836,000
Regular Highways: $26,132,000
Financial Administration: $24,622,000
Financial Administration: $24,543,000
Libraries: $19,508,000
General Public Buildings: $17,310,000
Libraries: $16,740,000
Parks and Recreation: $15,959,000
Central Staff Services: $14,806,000
Central Staff Services: $14,776,000
General Public Buildings: $14,261,000
Parks and Recreation: $9,967,000
Public Welfare - Other: $8,648,000
Public Welfare - Other: $5,692,000
Protective Inspection and Regulation - Other: $4,222,000
Protective Inspection and Regulation - Other: $3,663,000
Natural Resources - Other: $407,000
Natural Resources - Other: $313,000
- Federal Intergovernmental - Housing and Community Development: $35,700,000
General Local Government Support: $8,116,000
Other: $570,000
- General - Interest on Debt: $52,050,000
Interest on Debt: $48,254,000
- Local Intergovernmental - Other: $1,737,000
General Local Government Support: $708,000
- Long Term Debt - Beginning Outstanding - Unspecified Public Purpose: $1,097,719,000
Outstanding Unspecified Public Purpose: $1,048,691,000
Beginning Outstanding - Unspecified Public Purpose: $996,918,000
Outstanding Unspecified Public Purpose: $941,756,000
Beginning Outstanding - Public Debt for Private Purpose: $521,812,000
Outstanding Nonguaranteed - Industrial Revenue: $521,812,000
Beginning Outstanding - Public Debt for Private Purpose: $521,812,000
Outstanding Nonguaranteed - Industrial Revenue: $521,812,000
Retired Unspecified Public Purpose: $81,978,000
Retired Unspecified Public Purpose: $55,162,000
Issue, Unspecified Public Purpose: $32,950,000
- Miscellaneous - Fines and Forfeits: $23,188,000
Fines and Forfeits: $20,061,000
General Revenue - Other: $13,495,000
Rents: $7,723,000
Interest Earnings: $7,223,000
General Revenue - Other: $6,597,000
Rents: $6,479,000
Donations From Private Sources: $5,384,000
Special Assessments: $5,129,000
Special Assessments: $5,005,000
Interest Earnings: $4,363,000
Sale of Property: $1,479,000
Sale of Property: $626,000
Donations From Private Sources: $44,000
- Other Funds - Cash and Securities: $238,158,000
Cash and Securities: $215,001,000
- Revenue - Water Utilities: $73,907,000
Water Utilities: $45,830,000
- Sinking Funds - Cash and Securities: $541,079,000
Cash and Securities: $538,548,000
- State Intergovernmental - Housing and Community Development: $16,195,000
Other: $12,192,000
Housing and Community Development: $7,142,000
Other: $3,010,000
General Local Government Support: $92,000
- Tax - Property: $374,918,000
Property: $352,440,000
General Sales and Gross Receipts: $189,760,000
General Sales and Gross Receipts: $94,436,000
Insurance Premiums Sales: $29,164,000
Insurance Premiums Sales: $27,520,000
Occupation and Business License - Other: $18,918,000
Occupation and Business License - Other: $14,750,000
Other License: $8,140,000
Other License: $8,015,000
Other Selective Sales: $5,347,000
Alcoholic Beverage Sales: $3,809,000
Alcoholic Beverage Sales: $3,741,000
Other Selective Sales: $3,455,000
Alcoholic Beverage License: $1,763,000
Other: $1,136,000
Other: $1,100,000
Alcoholic Beverage License: $610,000
- Total Salaries and Wages: $973,000
- Water Utilities - Interest on Debt: $25,247,000
Supplemental Security Income (SSI) in 2006:
- Total number of recipients: 13,175
- Number of aged recipients: 2,060
- Number of blind and disabled recipients: 11,115
- Number of recipients under 18: 2,571
- Number of recipients between 18 and 64: 7,323
- Number of recipients older than 64: 3,281
- Number of recipients also receiving OASDI: 3,907
- Amount of payments (thousands of dollars): 6,291
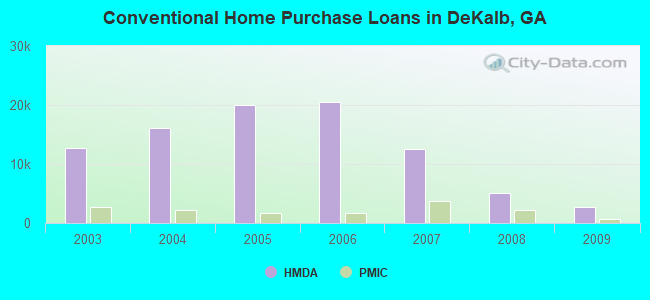
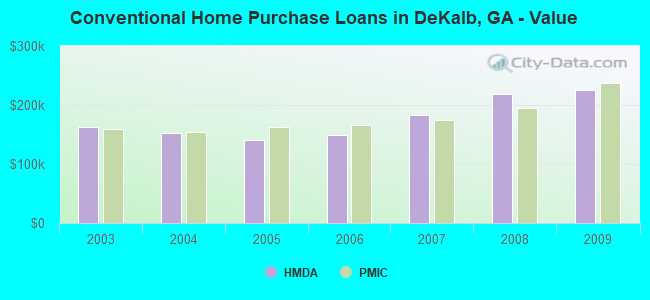
| Home Mortgage Disclosure Act Aggregated Statistics For Year 2009 (Based on 115 full tracts) | ||||||||||||||
| A) FHA, FSA/RHS & VA Home Purchase Loans | B) Conventional Home Purchase Loans | C) Refinancings | D) Home Improvement Loans | E) Loans on Dwellings For 5+ Families | F) Non-occupant Loans on < 5 Family Dwellings (A B C & D) | G) Loans On Manufactured Home Dwelling (A B C & D) | ||||||||
|---|---|---|---|---|---|---|---|---|---|---|---|---|---|---|
| Number | Average Value | Number | Average Value | Number | Average Value | Number | Average Value | Number | Average Value | Number | Average Value | Number | Average Value | |
| LOANS ORIGINATED | 3,108 | $153,630 | 2,714 | $225,348 | 11,279 | $220,426 | 330 | $112,118 | 19 | $8,224,000 | 1,002 | $129,908 | 1 | $235,000 |
| APPLICATIONS APPROVED, NOT ACCEPTED | 206 | $131,238 | 239 | $244,167 | 1,178 | $202,896 | 98 | $38,408 | 1 | $176,000 | 112 | $101,732 | 0 | $0 |
| APPLICATIONS DENIED | 858 | $126,531 | 689 | $161,202 | 5,795 | $181,709 | 651 | $46,049 | 4 | $3,950,000 | 694 | $101,575 | 8 | $56,000 |
| APPLICATIONS WITHDRAWN | 660 | $140,921 | 552 | $195,904 | 3,490 | $186,352 | 140 | $79,736 | 2 | $14,828,000 | 275 | $112,509 | 3 | $127,333 |
| FILES CLOSED FOR INCOMPLETENESS | 169 | $135,627 | 122 | $184,393 | 794 | $196,458 | 48 | $94,167 | 0 | $0 | 67 | $114,104 | 1 | $154,000 |
| Private Mortgage Insurance Companies Aggregated Statistics For Year 2009 (Based on 112 full tracts) | ||||||
| A) Conventional Home Purchase Loans | B) Refinancings | C) Non-occupant Loans on < 5 Family Dwellings (A & B) | ||||
|---|---|---|---|---|---|---|
| Number | Average Value | Number | Average Value | Number | Average Value | |
| LOANS ORIGINATED | 615 | $237,735 | 366 | $258,899 | 22 | $163,818 |
| APPLICATIONS APPROVED, NOT ACCEPTED | 236 | $208,148 | 197 | $238,569 | 36 | $110,750 |
| APPLICATIONS DENIED | 101 | $225,782 | 85 | $236,165 | 6 | $159,333 |
| APPLICATIONS WITHDRAWN | 35 | $220,914 | 43 | $224,419 | 3 | $103,000 |
| FILES CLOSED FOR INCOMPLETENESS | 32 | $242,438 | 18 | $235,778 | 7 | $169,000 |
| Most common first names in DeKalb County, GA among deceased individuals | ||
| Name | Count | Lived (average) |
|---|---|---|
| James | 2,629 | 70.1 years |
| Mary | 2,594 | 78.0 years |
| William | 2,414 | 72.4 years |
| John | 2,270 | 72.4 years |
| Robert | 1,711 | 68.4 years |
| Charles | 1,259 | 70.0 years |
| Willie | 1,196 | 70.9 years |
| George | 1,012 | 72.7 years |
| Annie | 939 | 78.9 years |
| Thomas | 888 | 71.4 years |
| Most common last names in DeKalb County, GA among deceased individuals | ||
| Last name | Count | Lived (average) |
|---|---|---|
| Smith | 1,574 | 72.7 years |
| Johnson | 936 | 72.2 years |
| Williams | 884 | 70.5 years |
| Jones | 866 | 71.3 years |
| Brown | 829 | 72.2 years |
| Davis | 716 | 73.0 years |
| Jackson | 576 | 70.7 years |
| Harris | 500 | 71.7 years |
| White | 452 | 73.0 years |
| Thomas | 449 | 70.7 years |
| Businesses in DeKalb County, GA | ||||
| Name | Count | Name | Count | |
|---|---|---|---|---|
| ALDO | 1 | LensCrafters | 3 | |
| AT&T | 6 | Little Caesars Pizza | 8 | |
| Abercrombie & Fitch | 1 | Long John Silver's | 1 | |
| Ace Hardware | 5 | Lowe's | 1 | |
| Advance Auto Parts | 12 | Macy's | 4 | |
| American Eagle Outfitters | 1 | Marriott | 6 | |
| Ann Taylor | 1 | Marshalls | 1 | |
| Apple Store | 1 | MasterBrand Cabinets | 2 | |
| Applebee's | 4 | Mazda | 1 | |
| Arby's | 6 | McDonald's | 23 | |
| Audi | 1 | Men's Wearhouse | 1 | |
| AutoZone | 11 | Motel 6 | 3 | |
| Avenue | 2 | Motherhood Maternity | 5 | |
| BMW | 1 | New Balance | 8 | |
| Bakers | 2 | New York & Co | 1 | |
| Bally Total Fitness | 1 | Nike | 30 | |
| Banana Republic | 1 | Nissan | 2 | |
| Barnes & Noble | 1 | Nordstrom | 1 | |
| Baskin-Robbins | 3 | Office Depot | 4 | |
| Bath & Body Works | 2 | OfficeMax | 2 | |
| Bebe | 1 | Old Navy | 1 | |
| Bed Bath & Beyond | 1 | Olive Garden | 1 | |
| Blockbuster | 7 | Outback | 2 | |
| Brooks Brothers | 1 | Outback Steakhouse | 2 | |
| Brookstone | 1 | Panda Express | 1 | |
| Budget Car Rental | 2 | Panera Bread | 3 | |
| Buffalo Wild Wings | 1 | Papa John's Pizza | 5 | |
| Burger King | 13 | Payless | 9 | |
| CVS | 18 | Penske | 6 | |
| Cache | 1 | PetSmart | 2 | |
| CarMax | 1 | Pier 1 Imports | 1 | |
| Caribou Coffee | 1 | Pizza Hut | 14 | |
| Catherines | 2 | Plato's Closet | 1 | |
| Charlotte Russe | 1 | Popeyes | 9 | |
| Chevrolet | 2 | Publix Super Markets | 10 | |
| Chick-Fil-A | 14 | Quality | 1 | |
| Chico's | 1 | Quiznos | 7 | |
| Chipotle | 2 | RadioShack | 4 | |
| Church's Chicken | 7 | Red Lobster | 2 | |
| Circle K | 2 | Red Roof Inn | 1 | |
| Clarks | 1 | Rite Aid | 6 | |
| Cold Stone Creamery | 1 | Rooms To Go | 2 | |
| Comfort Suites | 1 | Ruby Tuesday | 1 | |
| Curves | 4 | Ryan's Grill | 1 | |
| DHL | 6 | Ryder Rental & Truck Leasing | 2 | |
| Dairy Queen | 10 | SAS Shoes | 2 | |
| Discount Tire | 1 | SONIC Drive-In | 4 | |
| Domino's Pizza | 4 | Sam's Club | 2 | |
| Dunkin Donuts | 8 | Sears | 2 | |
| Econo Lodge | 2 | Sephora | 1 | |
| Express | 1 | Skechers USA | 1 | |
| Extended Stay America | 1 | Soma Intimates | 1 | |
| FedEx | 112 | Sprint Nextel | 3 | |
| Firestone Complete Auto Care | 7 | Staples | 1 | |
| Foot Locker | 4 | Starbucks | 14 | |
| Ford | 2 | Steak 'n Shake | 1 | |
| Forever 21 | 1 | Studio 6 | 1 | |
| GNC | 12 | Subaru | 2 | |
| GameStop | 4 | Suburban | 1 | |
| Gap | 1 | Subway | 21 | |
| Goodwill | 3 | Super 8 | 3 | |
| Gymboree | 1 | T-Mobile | 15 | |
| H&R Block | 20 | T.J.Maxx | 2 | |
| Haagen-Dazs | 1 | Taco Bell | 11 | |
| Havertys Furniture | 1 | Target | 3 | |
| Hilton | 4 | The Athlete's Foot | 6 | |
| Hobby Lobby | 1 | The Cheesecake Factory | 1 | |
| Holiday Inn | 7 | The Limited | 1 | |
| Home Depot | 3 | The Room Place | 1 | |
| Honda | 1 | Toyota | 1 | |
| Hyundai | 1 | Toys"R"Us | 5 | |
| IHOP | 3 | True Value | 1 | |
| J. Jill | 1 | U-Haul | 41 | |
| J.Crew | 1 | UPS | 101 | |
| Jimmy John's | 16 | Urban Outfitters | 1 | |
| JoS. A. Bank | 2 | Verizon Wireless | 3 | |
| Jones New York | 8 | Victoria's Secret | 1 | |
| KFC | 9 | Volkswagen | 1 | |
| Kincaid | 1 | Waffle House | 23 | |
| Kmart | 1 | Walgreens | 14 | |
| Knights Inn | 1 | Walmart | 4 | |
| Kroger | 17 | Wendy's | 14 | |
| LA Fitness | 3 | Whole Foods Market | 1 | |
| La-Z-Boy | 1 | YMCA | 3 | |
| Lane Furniture | 6 | Z Gallerie | 1 | |
DeKalb County on our top lists:
- #2 on the list of "Top 101 counties with the highest average weight of females"
- #5 on the list of "Top 101 counties with the lowest Sulfur Oxides Annual air pollution readings in 2012 (µg/m3)"
- #15 on the list of "Top 101 counties with the highest percentage of residents relocating to other counties in 2011 (pop. 50,000+)"
- #16 on the list of "Top 101 counties with the highest Particulate Matter (PM2.5) Annual air pollution readings in 2012 (µg/m3)"
- #17 on the list of "Top 101 counties with the highest percentage of residents relocating from other counties between 2010 and 2011 (pop. 50,000+)"
- #18 on the list of "Top 101 counties with the lowest percentage of residents that smoked 100+ cigarettes in their lives"
- #18 on the list of "Top 101 counties with highest percentage of residents voting for Obama (Democrat) in the 2012 Presidential Election (pop. 50,000+)"
- #20 on the list of "Top 101 counties with the highest Nitrogen Dioxide air pollution readings in 2012 (ppm)"
- #22 on the list of "Top 101 counties with the lowest Ozone (1-hour) air pollution readings in 2012 (ppm)"
- #32 on the list of "Top 101 counties with the highest carbon monoxide air pollution readings in 2012 (ppm)"
- #35 on the list of "Top 101 counties with the most Black Protestant adherents (pop. 50,000+)"
- #35 on the list of "Top 101 counties with the most Black Protestant adherents"
- #37 on the list of "Top 101 counties with highest percentage of residents voting for Obama (Democrat) in the 2012 Presidential Election"
- #42 on the list of "Top 101 counties with the largest decrease in the number of infant deaths per 1000 residents 2000-2006 to 2007-2013 (pop. 50,000+)"
- #44 on the list of "Top 101 counties with the most Black Protestant congregations"
- #44 on the list of "Top 101 counties with the most Black Protestant congregations (pop. 50,000+)"
- #45 on the list of "Top 101 counties with the highest percentage of residents relocating to other counties in 2011"
- #46 on the list of "Top 101 counties with the largest increase in the number of births per 1000 residents 2000-2006 to 2007-2013 (pop 50,000+)"
- #46 on the list of "Top 101 counties with the most Mainline Protestant adherents"
- #46 on the list of "Top 101 counties with the most Mainline Protestant adherents (pop. 50,000+)"