Gwinnett County, Georgia (GA)
County owner-occupied free and clear houses and condos in 2010: 24,843
County owner-occupied houses and condos in 2000: 146,565
Renter-occupied apartments: 79,352 (it was 55,752 in 2000)
| % of renters here: | 28% |
| State: | 34% |
Land area: 433 sq. mi.
Water area: 4.0 sq. mi.
Population density: 2254 people per square mile (very high).
Industries providing employment: Educational, health and social services (18.6%), Professional, scientific, management, administrative, and waste management services (14.5%), Retail trade (13.0%).
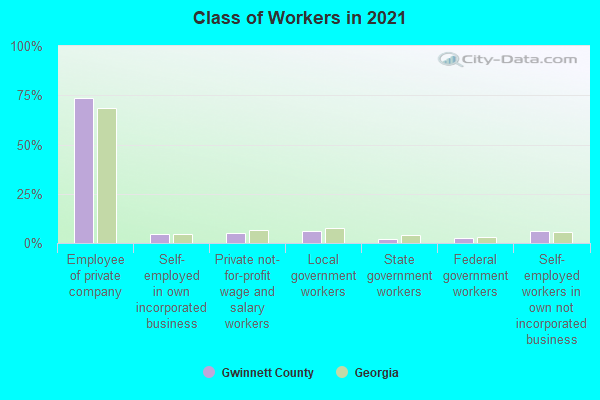
Type of workers:
- Private wage or salary: 82%
- Government: 11%
- Self-employed, not incorporated: 7%
- Unpaid family work: 0%
- OSM Map
- General Map
- Google Map
- MSN Map

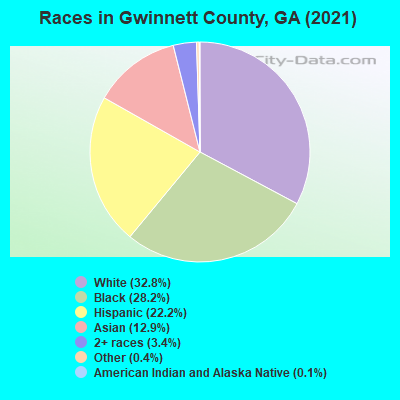
- 305,90831.4%White Non-Hispanic Alone
- 278,65428.6%Black Non-Hispanic Alone
- 217,50122.3%Hispanic or Latino
- 129,51313.3%Asian alone
- 37,8763.9%Two or more races
- 4,8800.5%Some other race alone
- 8030.08%American Indian and Alaska Native alone
- 2180.02%Native Hawaiian and Other
Pacific Islander alone
| Median resident age: | 36.1 years |
| Georgia median age: | 37.6 years |
| Males: 478,646 | |
| Females: 496,707 |

 | Gwinnett County (49 replies) |
| Gwinnett County to Purchase Gwinnett Mall (69 replies) |
| Sugarloaf Parkway extension Phase 2 to cost $867 million; Gwinnett County hopes fed grants will cover most of it (11 replies) |
| NHL open to another expansion franchise in Atlanta (257 replies) |
| NY to ATL - relocating with young kids (259 replies) |
| 2022 AJC Super 11 team (4 of 11 from Gwinnett County) (0 replies) |
| Gwinnett County: | 2.0 people |
| Georgia: | 3 people |
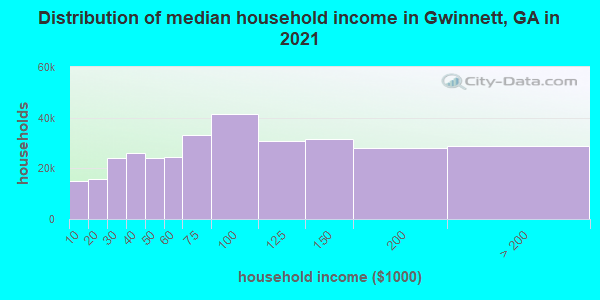
Estimated median household income in 2022: $83,901 ($60,537 in 1999)
| This county: | $83,901 |
| Georgia: | $72,837 |
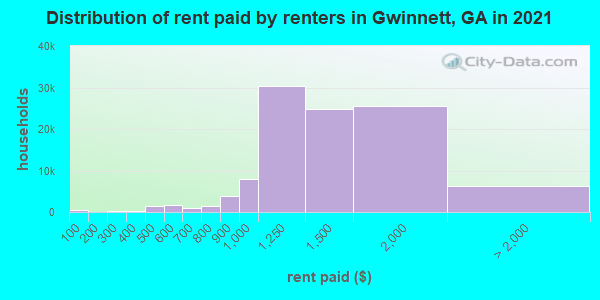
Median contract rent in 2022 for apartments: $1,452 (lower quartile is $1,186, upper quartile is $1,792)
| This county: | $1452 |
| State: | $1065 |
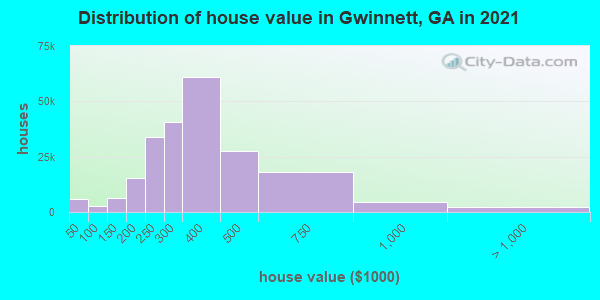
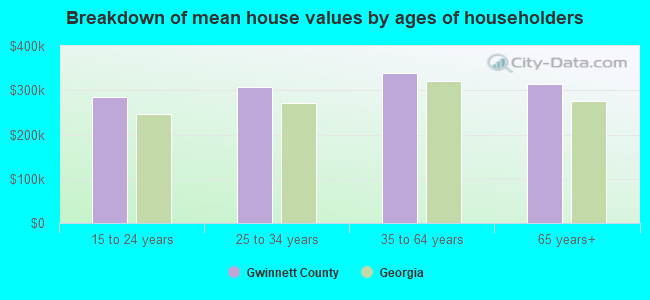
Estimated median house or condo value in 2022: $381,700 (it was $140,600 in 2000)
| Gwinnett: | $381,700 |
| Georgia: | $297,400 |
Mean price in 2022:
Median monthly housing costs for homes and condos with a mortgage: $1,796Detached houses: $370,833
Here: $370,833 State: $376,364 Townhouses or other attached units: $251,435
Here: $251,435 State: $341,709 In 2-unit structures: $164,169
Here: $164,169 State: $269,631 In 3-to-4-unit structures: $278,047
Here: $278,047 State: $250,092 In 5-or-more-unit structures: $250,150
Here: $250,150 State: $370,730 Mobile homes: $112,241
Here: $112,241 State: $102,413 Occupied boats, RVs, vans, etc.: $37,439
Here: $37,439 State: $86,124
Median monthly housing costs for units without a mortgage: $616
Institutionalized population: 5,006
Crime in 2019 (reported by the sheriff's office or county police, not the county total):
- Murders: 14
- Rapes: 95
- Robberies: 342
- Assaults: 655
- Burglaries: 1390
- Thefts: 6942
- Auto thefts: 896
Crime in 2018 (reported by the sheriff's office or county police, not the county total):
- Murders: 30
- Rapes: 177
- Robberies: 583
- Assaults: 820
- Burglaries: 2455
- Thefts: 10649
- Auto thefts: 1472
Health of residents in Gwinnett County based on CDC Behavioral Risk Factor Surveillance System Survey Questionnaires from 2013 to 2021:
General health status score of residents in this county from 1 (poor) to 5 (excellent) is 3.5. This is about average.72.9% of residents exercised in the past month. This is about average.
36.6% of residents smoked 100+ cigarettes in their lives. This is less than average.
52.3% of adult residents drank alcohol in the past 30 days. This is less than average.
66.6% of residents visited a dentist within the past year. This is less than average.
Average weight of males is 197 pounds. This is about average.
Average weight of females is 164 pounds. This is about average.
Health of residents in Gwinnett County based on CDC Behavioral Risk Factor Surveillance System Survey Questionnaires from 2003 to 2012:
General health status score of residents in this county from 1 (poor) to 5 (excellent) is 3.7. This is significantly better than average.78.7% of residents exercised in the past month. This is about average.
40.0% of residents smoked 100+ cigarettes in their lives. This is less than average.
98.1% of adult residents drank alcohol in the past 30 days. This is more than average.
78.3% of residents visited a dentist within the past year. This is more than average.
Average weight of males is 198 pounds. This is about average.
Average weight of females is 157 pounds. This is about average.
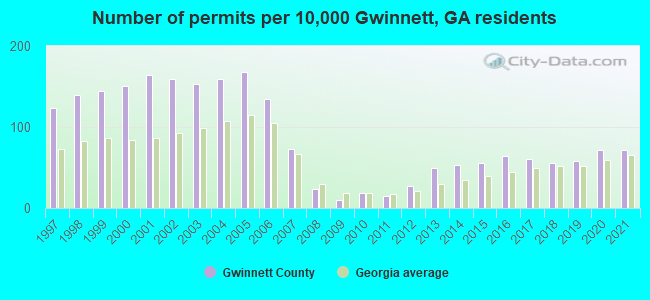
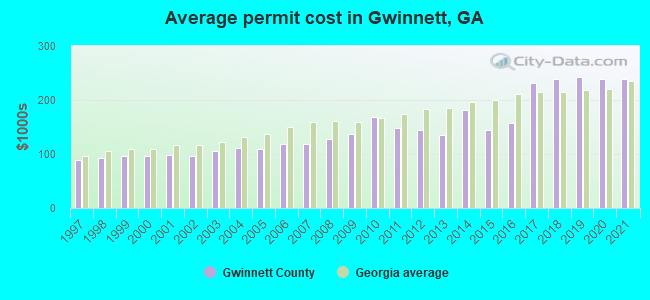
Single-family new house construction building permits:
- 2022: 3860 buildings, average cost: $298,700
- 2021: 4266 buildings, average cost: $239,000
- 2020: 4204 buildings, average cost: $238,500
- 2019: 3412 buildings, average cost: $241,600
- 2018: 3254 buildings, average cost: $239,200
- 2017: 3599 buildings, average cost: $232,300
- 2016: 3779 buildings, average cost: $156,900
- 2015: 3285 buildings, average cost: $144,300
- 2014: 3135 buildings, average cost: $182,100
- 2013: 2924 buildings, average cost: $135,100
- 2012: 1564 buildings, average cost: $145,100
- 2011: 873 buildings, average cost: $148,600
- 2010: 1080 buildings, average cost: $167,600
- 2009: 617 buildings, average cost: $136,800
- 2008: 1363 buildings, average cost: $128,000
- 2007: 4278 buildings, average cost: $118,600
- 2006: 7886 buildings, average cost: $119,400
- 2005: 9894 buildings, average cost: $109,700
- 2004: 9384 buildings, average cost: $112,300
- 2003: 9029 buildings, average cost: $105,700
- 2002: 9371 buildings, average cost: $96,800
- 2001: 9646 buildings, average cost: $98,900
- 2000: 8852 buildings, average cost: $96,300
- 1999: 8469 buildings, average cost: $96,700
- 1998: 8243 buildings, average cost: $93,400
- 1997: 7215 buildings, average cost: $88,700
Median real estate property taxes paid for housing units with mortgages in 2022: $3,513 (0.9%)
Median real estate property taxes paid for housing units with no mortgage in 2022: $3,011 (0.8%)
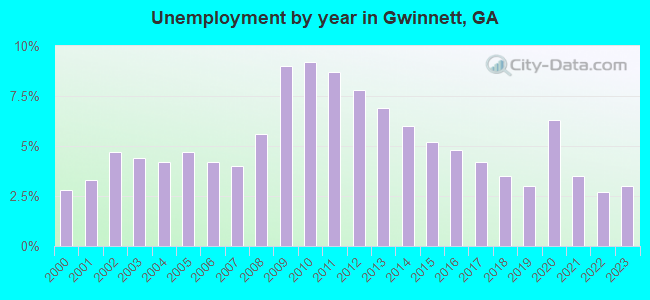
| Gwinnett County: | 9.0% |
| Georgia: | 12.7% |
Median age of residents in 2022: 36.1 years old
(Males: 35.2 years old, Females: 37.0 years old)
(Median age for: White residents: 44.3 years old, Black residents: 34.0 years old, American Indian residents: 28.2 years old, Asian residents: 39.7 years old, Hispanic or Latino residents: 27.9 years old, Other race residents: 27.6 years old)
Area name: Atlanta-Sandy Springs-Marietta, GA HUD Metro FMR Area
Fair market rent in 2006 for a 1-bedroom apartment in Gwinnett County is $686 a month.
Fair market rent for a 2-bedroom apartment is $763 a month.
Fair market rent for a 3-bedroom apartment is $929 a month.
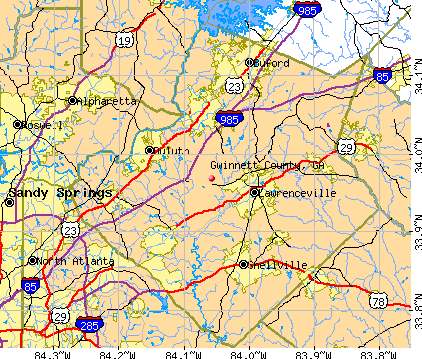
Cities in this county include: Dacula-Rocky Creek, Lawrenceville, Duluth, Snellville, Sugar Hill, Lilburn, Buford, Suwanee, Norcross, Dacula.
2023 air pollution in Gwinnett County:
Ozone (1-hour): 0.032 ppm (standard limit: 0.12 ppm). Near U.S. average.
Particulate Matter (PM2.5) Annual: 11.2 µg/m3(standard limit: 15.0 µg/m3). Near U.S. average.
Neighboring counties: Cherokee County, Alabama  , Clay County, Mississippi , Lafayette County, Mississippi , St. Clair County, Alabama , Sevier County, Arkansas , Hall County
  , Haralson County .
| Here: | 2.6% |
| Georgia: | 2.9% |
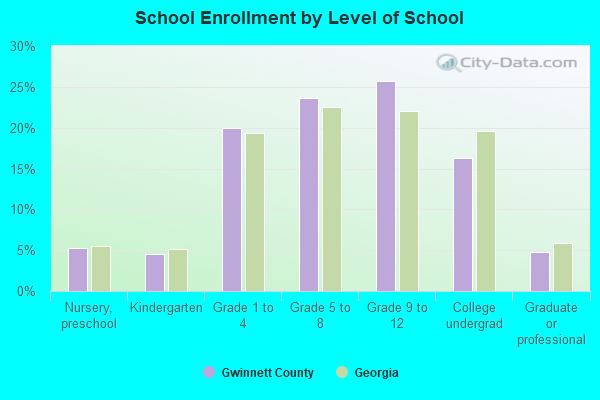
Current college students: 27,694
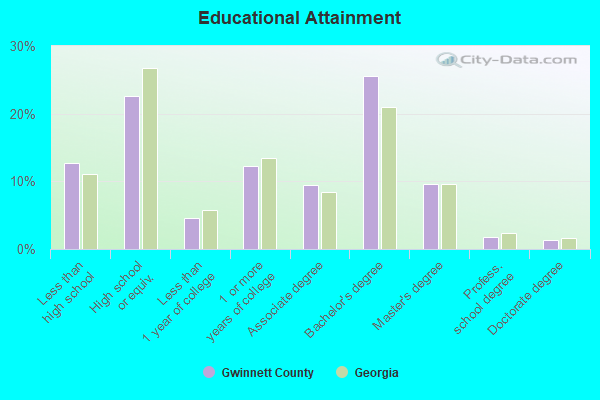
People 25 years of age or older with a high school degree or higher: 89.2%
People 25 years of age or older with a bachelor's degree or higher: 38.8%
Number of foreign born residents: 265,903 (52.4% naturalized citizens)
| Gwinnett County: | 27.3% |
| Whole state: | 10.7% |
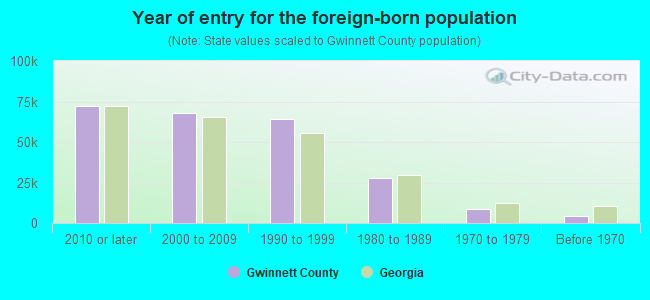
- Year of entry for the foreign-born population
- 87,9702010 or later
- 67,9022000 to 2009
- 64,5751990 to 1999
- 27,7201980 to 1989
- 8,7231970 to 1979
- 4,474Before 1970
Mean travel time to work (commute): minutes
Percentage of county residents living and working in this county: 99.1%
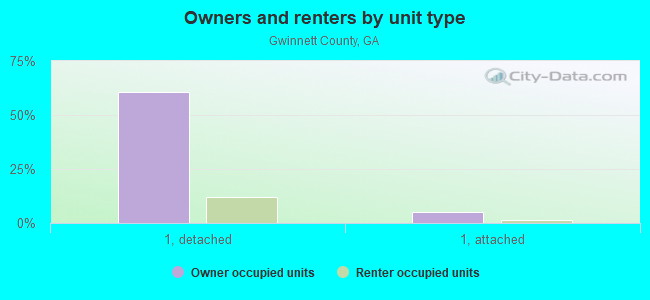
Housing units in structures:
- One, detached: 243,888
- One, attached: 23,298
- Two: 3,134
- 3 or 4: 6,494
- 5 to 9: 13,383
- 10 to 19: 20,505
- 20 to 49: 10,930
- 50 or more: 13,977
- Mobile homes: 4,774
- Boats, RVs, vans, etc.: 99
Housing units in Gwinnett County with a mortgage: 152,272 (12,819 second mortgage, 436 home equity loan, 10,529 both second mortgage and home equity loan)
Houses without a mortgage: 2,816
| Here: | 98.7% with mortgage |
| State: | 98.2% with mortgage |
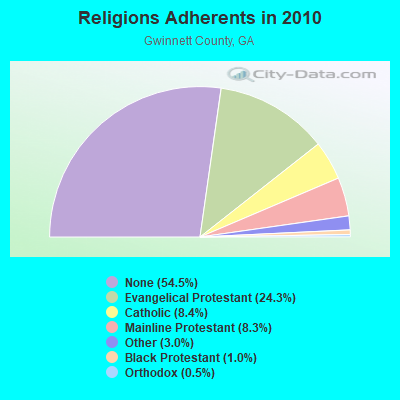
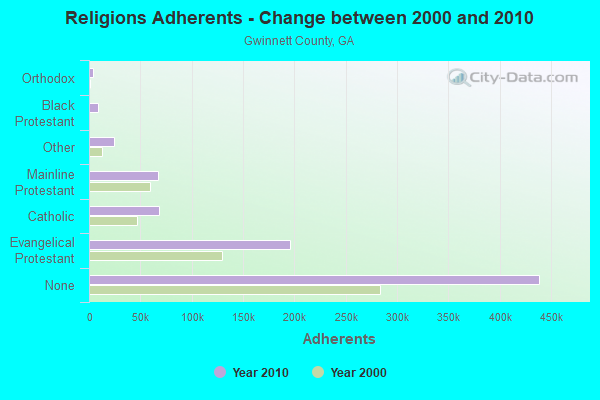
Religion statistics for Gwinnett County
| Religion | Adherents | Congregations |
|---|---|---|
| Evangelical Protestant | 195,348 | 392 |
| Catholic | 67,781 | 12 |
| Mainline Protestant | 67,212 | 69 |
| Other | 23,940 | 57 |
| Black Protestant | 8,423 | 10 |
| Orthodox | 4,004 | 8 |
| None | 438,613 | - |
Source: Clifford Grammich, Kirk Hadaway, Richard Houseal, Dale E.Jones, Alexei Krindatch, Richie Stanley and Richard H.Taylor. 2012. 2010 U.S.Religion Census: Religious Congregations & Membership Study. Association of Statisticians of American Religious Bodies. Jones, Dale E., et al. 2002. Congregations and Membership in the United States 2000. Nashville, TN: Glenmary Research Center.
Food Environment Statistics:
| Gwinnett County: | 1.62 / 10,000 pop. |
| State: | 1.91 / 10,000 pop. |
| Here: | 0.18 / 10,000 pop. |
| Georgia: | 0.15 / 10,000 pop. |
| This county: | 0.66 / 10,000 pop. |
| Georgia: | 0.86 / 10,000 pop. |
| Gwinnett County: | 3.94 / 10,000 pop. |
| Georgia: | 5.12 / 10,000 pop. |
| This county: | 9.28 / 10,000 pop. |
| State: | 7.41 / 10,000 pop. |
| Gwinnett County: | 8.4% |
| Georgia: | 10.4% |
| Gwinnett County: | 25.6% |
| State: | 27.8% |
| Here: | 16.4% |
| State: | 14.6% |
Agriculture in Gwinnett County:
Average size of farms: 56 acresAverage value of agricultural products sold per farm: $68,909
Average value of crops sold per acre for harvested cropland: $11474.39
The value of nursery, greenhouse, floriculture, and sod as a percentage of the total market value of agricultural products sold: 86.33%
The value of livestock, poultry, and their products as a percentage of the total market value of agricultural products sold: 12.63%
Average total farm production expenses per farm: $39,226
Harvested cropland as a percentage of land in farms: 9.32%
Irrigated harvested cropland as a percentage of land in farms: 5.31%
Average market value of all machinery and equipment per farm: $21,593
The percentage of farms operated by a family or individual: 89.10%
Average age of principal farm operators: 58 years
Average number of cattle and calves per 100 acres of all land in farms: 19.35
Corn for grain: 11 harvested acres
Vegetables: 21 harvested acres
Land in orchards: 40 acres
Earthquake activity:
Gwinnett County-area historical earthquake activity is significantly above Georgia state average. It is 48% greater than the overall U.S. average.On 8/2/1974 at 08:52:09, a magnitude 4.9 (4.3 MB, 4.9 LG, Class: Light, Intensity: IV - V) earthquake occurred 90.4 miles away from Gwinnett County center
On 4/29/2003 at 08:59:39, a magnitude 4.9 (4.4 MB, 4.6 MW, 4.9 LG) earthquake occurred 96.9 miles away from the county center
On 4/29/2003 at 08:59:39, a magnitude 4.6 (4.6 MW, Depth: 12.3 mi) earthquake occurred 97.0 miles away from the county center
On 11/30/1973 at 07:48:41, a magnitude 4.7 (4.7 MB, 4.6 ML) earthquake occurred 126.8 miles away from the county center
On 8/9/2020 at 12:07:37, a magnitude 5.1 (5.1 MW, Depth: 4.7 mi, Class: Moderate, Intensity: VI - VII) earthquake occurred 241.2 miles away from Gwinnett County center
On 1/18/1999 at 07:00:53, a magnitude 4.8 (4.8 MB, 4.0 LG, Depth: 0.6 mi) earthquake occurred 188.0 miles away from the county center
Magnitude types: regional Lg-wave magnitude (LG), body-wave magnitude (MB), local magnitude (ML), moment magnitude (MW)
Most recent natural disasters:
- Georgia Covid-19 Pandemic, Incident Period: January 20, 2020, FEMA Id: 4501, Natural disaster type: Other
- Georgia Severe Winter Storm, Incident Period: February 10, 2014 to February 14, 2014, Emergency Declared EM-3368: February 11, 2014, FEMA Id: 3368, Natural disaster type: Winter Storm
- Georgia Severe Storms and Flooding, Incident Period: September 18, 2009 to October 08, 2009, Major Disaster (Presidential) Declared DR-1858: September 24, 2009, FEMA Id: 1858, Natural disaster type: Storm, Flood
- Georgia Hurricane Katrina Evacuation, Incident Period: August 27, 2005 to October 01, 2005, Emergency Declared EM-3218: September 05, 2005, FEMA Id: 3218, Natural disaster type: Hurricane
- Georgia Winter Storm, Incident Period: January 22, 2000 to February 01, 2000, Major Disaster (Presidential) Declared DR-1311: January 28, 2000, FEMA Id: 1311, Natural disaster type: Winter Storm
- Georgia Severe Storms, Tornadoes and Flooding, Incident Period: February 14, 1998 to May 11, 1998, Major Disaster (Presidential) Declared DR-1209: March 11, 1998, FEMA Id: 1209, Natural disaster type: Storm, Tornado, Flood
- Georgia Hurricane Opal, Incident Period: October 04, 1995 to October 05, 1995, Major Disaster (Presidential) Declared DR-1071: October 10, 1995, FEMA Id: 1071, Natural disaster type: Hurricane
- Georgia Severe Snowfall, Winter Storm, Incident Period: March 13, 1993 to March 17, 1993, Emergency Declared EM-3097: March 15, 1993, FEMA Id: 3097, Natural disaster type: Winter Storm, Snowfall
- Georgia Drought, Incident Period: July 20, 1977, Emergency Declared EM-3044: July 20, 1977, FEMA Id: 3044, Natural disaster type: Drought
The number of natural disasters in Gwinnett County (9) is smaller than the US average (15).
Major Disasters (Presidential) Declared: 4
Emergencies Declared: 4
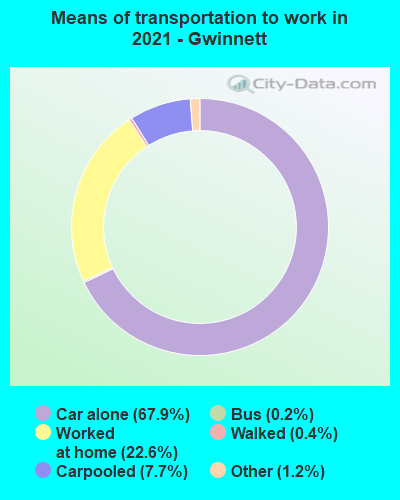
Means of transportation to work:
- Drove a car alone: 302,113 (67.6%)
- Carpooled: 51,767 (11.6%)
- Bus: 1,271 (0.3%)
- Subway or elevated rail: 349 (0.1%)
- Taxicab, motorcycle, or other means: 6,579 (1.5%)
- Bicycle: 301 (0.1%)
- Walked: 4,151 (0.9%)
- Worked at home: 80,444 (18.0%)
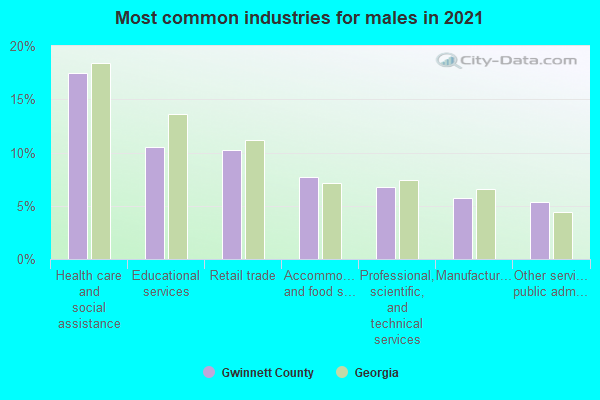
- Health care and social assistance (18%)
- Retail trade (11%)
- Educational services (10%)
- Accommodation and food services (7%)
- Professional, scientific, and technical services (7%)
- Manufacturing (6%)
- Other services, except public administration (6%)
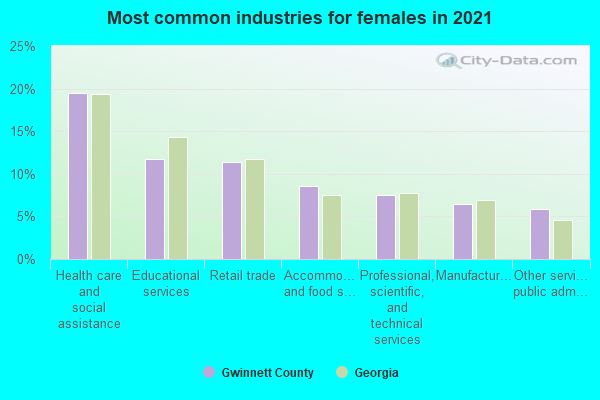
- Health care and social assistance (20%)
- Retail trade (12%)
- Educational services (11%)
- Accommodation and food services (8%)
- Professional, scientific, and technical services (7%)
- Manufacturing (7%)
- Other services, except public administration (7%)
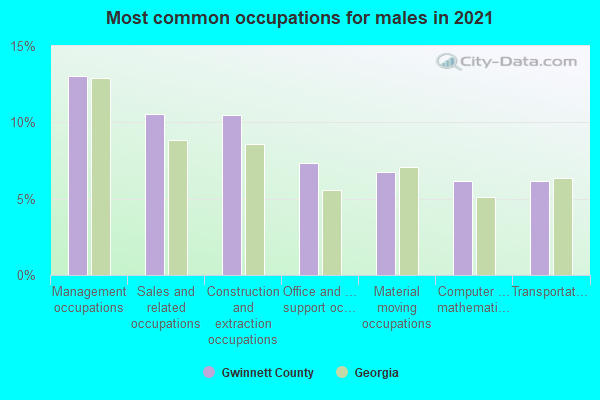
- Management occupations (13%)
- Construction and extraction occupations (11%)
- Sales and related occupations (11%)
- Computer and mathematical occupations (7%)
- Transportation occupations (6%)
- Production occupations (6%)
- Business and financial operations occupations (6%)
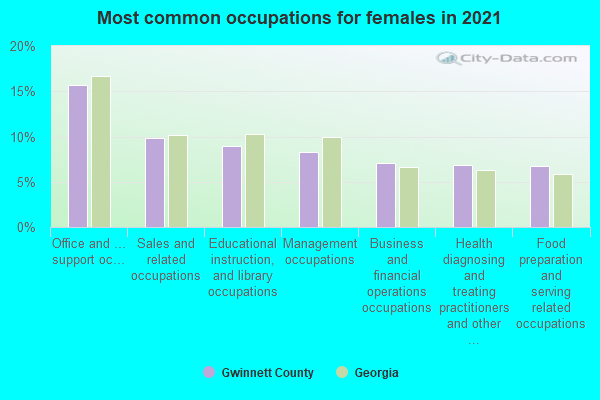
- Office and administrative support occupations (15%)
- Sales and related occupations (10%)
- Management occupations (9%)
- Educational instruction, and library occupations (9%)
- Business and financial operations occupations (8%)
- Health diagnosing and treating practitioners and other technical occupations (7%)
- Food preparation and serving related occupations (6%)
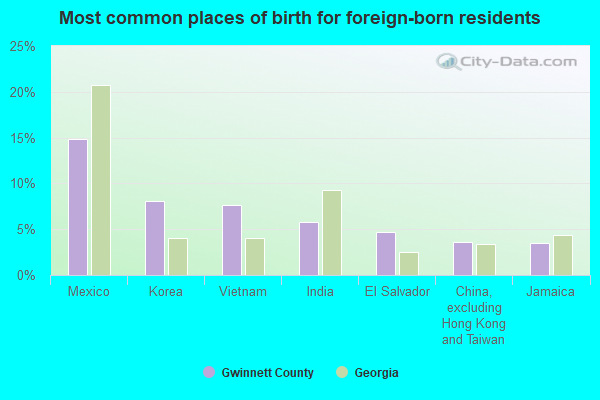
- Mexico (15%)
- Korea (8%)
- Vietnam (8%)
- India (6%)
- China, excluding Hong Kong and Taiwan (4%)
- El Salvador (4%)
- Jamaica (4%)
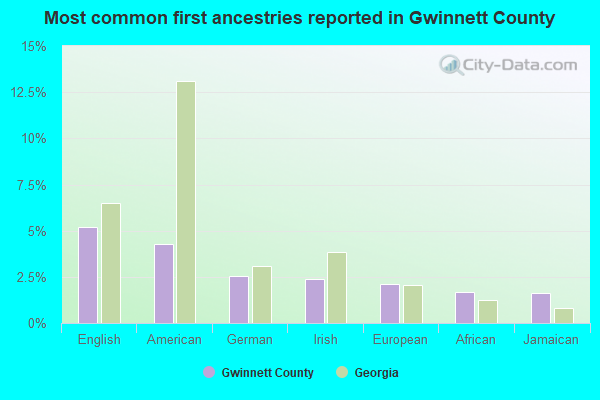
- English (5%)
- American (4%)
- Irish (2%)
- German (2%)
- Jamaican (2%)
- Nigerian (2%)
- European (2%)
People in group quarters in Gwinnett County, Georgia in 2010:
- 2,578 people in local jails and other municipal confinement facilities
- 1,068 people in nursing facilities/skilled-nursing facilities
- 824 people in state prisons
- 452 people in correctional residential facilities
- 394 people in workers' group living quarters and job corps centers
- 101 people in group homes intended for adults
- 76 people in emergency and transitional shelters (with sleeping facilities) for people experiencing homelessness
- 60 people in residential treatment centers for adults
- 51 people in correctional facilities intended for juveniles
- 45 people in other noninstitutional facilities
- 33 people in group homes for juveniles (non-correctional)
People in group quarters in Gwinnett County, Georgia in 2000:
- 1,571 people in local jails and other confinement facilities (including police lockups)
- 1,041 people in state prisons
- 1,001 people in nursing homes
- 800 people in other nonhousehold living situations
- 638 people in other noninstitutional group quarters
- 636 people in other workers' dormitories
- 245 people in halfway houses
- 154 people in other group homes
- 137 people in homes for the mentally retarded
- 51 people in homes for the physically handicapped
- 48 people in short-term care, detention or diagnostic centers for delinquent children
- 22 people in homes or halfway houses for drug/alcohol abuse
- 18 people in homes for the mentally ill
- 16 people in religious group quarters
- 6 people in unknown juvenile institutions
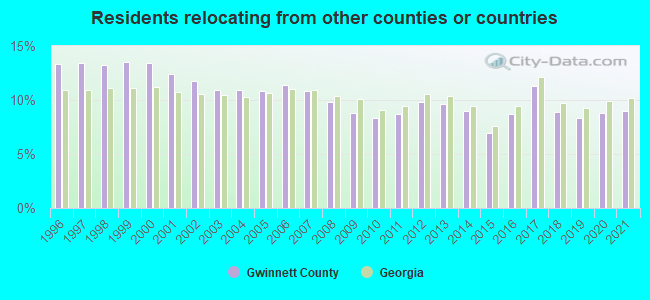
8.95% of this county's 2021 resident taxpayers lived in other counties in 2020 ($56,340 average adjusted gross income)
| Here: | 8.95% |
| Georgia average: | 10.21% |
0.02% of residents moved from foreign countries ($109 average AGI)
Gwinnett County: 0.02% Georgia average: 0.04%
5.19% relocated from other counties in Georgia ($32,188 average AGI)
3.73% relocated from other states ($24,043 average AGI)
Gwinnett County: 3.73% Georgia average: 3.80%
Top counties from which taxpayers relocated into this county between 2020 and 2021:
| from DeKalb County, GA | |
| from Fulton County, GA | |
| from Cobb County, GA | |
| from Hall County, GA | |
| from Forsyth County, GA | |
| from Walton County, GA | |
| from Barrow County, GA |
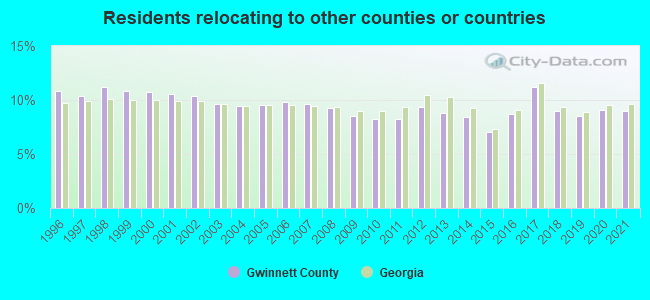
8.96% of this county's 2020 resident taxpayers moved to other counties in 2021 ($67,241 average adjusted gross income)
| Here: | 8.96% |
| Georgia average: | 9.60% |
0.02% of residents moved to foreign countries ($74 average AGI)
Gwinnett County: 0.02% Georgia average: 0.03%
6.09% relocated to other counties in Georgia ($43,889 average AGI)
2.85% relocated to other states ($23,278 average AGI)
Gwinnett County: 2.85% Georgia average: 3.15%
Top counties to which taxpayers relocated from this county between 2020 and 2021:
| to DeKalb County, GA | |
| to Fulton County, GA | |
| to Hall County, GA | |
| to Barrow County, GA | |
| to Walton County, GA | |
| to Cobb County, GA | |
| to Forsyth County, GA |
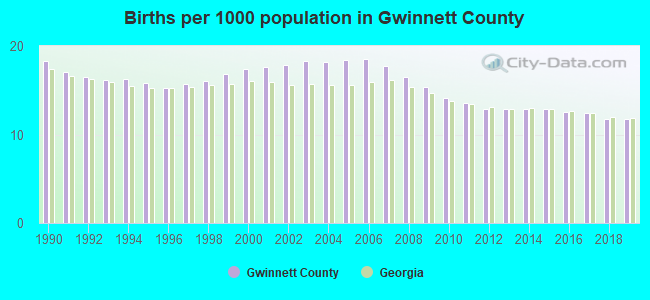
Births per 1000 population from 1990 to 1999: 16.4
Births per 1000 population from 2000 to 2009: 17.6
Births per 1000 population from 2010 to 2022: 10.7
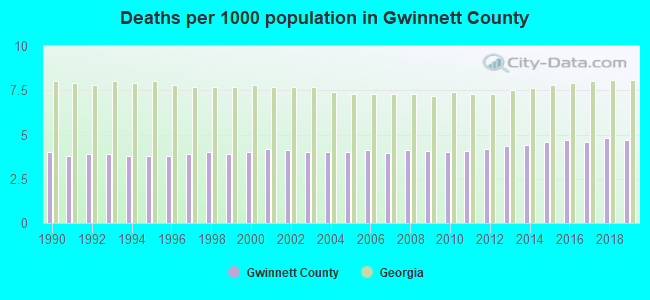
Deaths per 1000 population from 1990 to 1999: 3.9
Deaths per 1000 population from 2000 to 2009: 4.1
Deaths per 1000 population from 2010 to 2020: 4.6
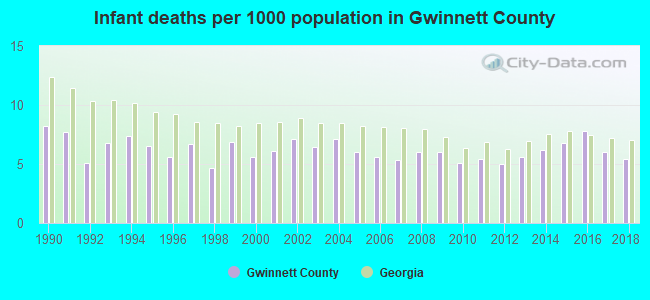
Infant deaths per 1000 live births from 1990 to 1999: 6.6
Infant deaths per 1000 live births from 2000 to 2009: 6.1
Infant deaths per 1000 live births from 2010 to 2021: 5.8
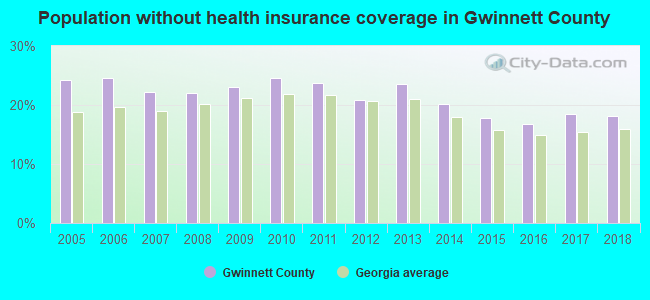
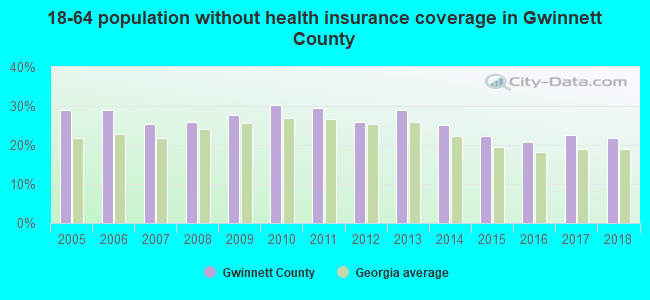
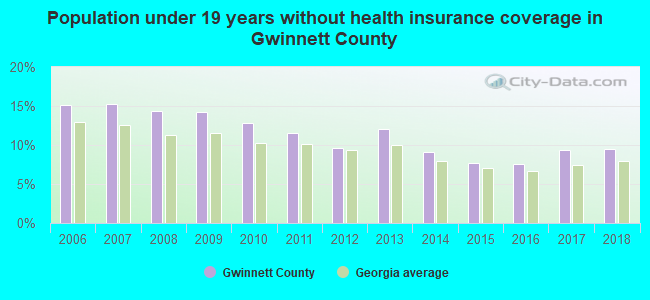
Persons under 19 years old without health insurance coverage in 2018: 9.5%
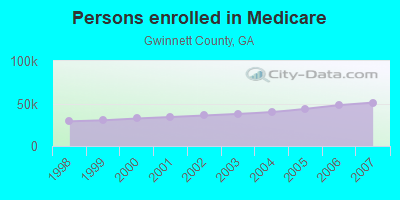
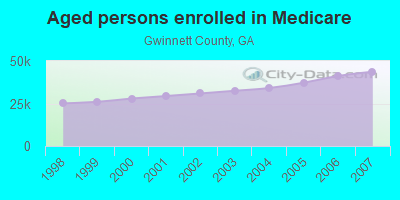
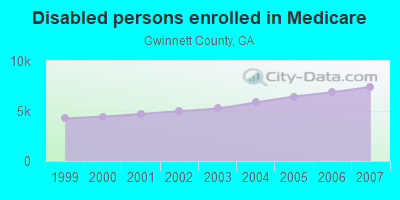
Persons enrolled in hospital insurance and/or supplemental medical insurance (Medicare) in July 1, 2007: 51,104 (43,691 aged, 7,413 disabled)
Children under 18 without health insurance coverage in 2007: 35,002 (15%)
Most common underlying causes of death in Gwinnett County, Georgia in 1999 - 2019:
- Bronchus or lung, unspecified - Malignant neoplasms (3,961)
- Atherosclerotic heart disease (3,266)
- Unspecified dementia (2,672)
- Chronic obstructive pulmonary disease, unspecified (2,536)
- Alzheimer disease, unspecified (2,384)
- Congestive heart failure (1,998)
- Acute myocardial infarction, unspecified (1,919)
- Stroke, not specified as haemorrhage or infarction (1,814)
- Breast, unspecified - Malignant neoplasms (1,444)
- Colon, unspecified - Malignant neoplasms (1,187)
Population without health insurance coverage in 2000: 15%
Children under 18 without health insurance coverage in 2000: 15%
Short term general hospital admissions per 100,000 population in 2004: 4,761
Short term general hospital beds per 100,000 population in 2004: 80
Emergency room visits per 100,000 population in 2004: 16,010
General practice office based MDs per 100,000 population in 2005: 1,820
Medical specialist MDs per 100,000 population in 2005: 393
Dentists per 100,000 population in 1998: 3
Total births per 100,000 population, July 2005 - July 2006 : 37
Total deaths per 100,000 population, July 2005 - July 2006: 90
Limited-service eating places per 100,000 population in 2005 : 12
Beer, wine & liquor stores per 100,000 population in 2005: 1
Homicides per 1,000,000 population from 2000 to 2006: 49.6. This is less than state average.
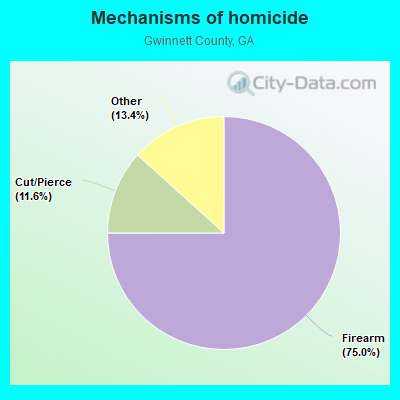
- Firearm - 37.2
- Cut/Pierce - 5.8
- Other - 6.6
Suicides per 1,000,000 population from 2000 to 2006: 93.0. This is less than state average.
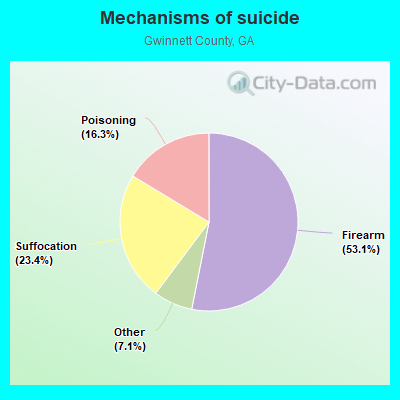
- Firearm - 49.4
- Suffocation - 21.8
- Poisoning - 15.2
- Other - 6.6
Household type by relationship:
Households: 975,353- Male householders: 162,735 (25,730 living alone), Female householders: 164,284 (40,535 living alone)
172,754 spouses (171,582 opposite-sex spouses), 19,126 unmarried partners, (18,225 opposite-sex unmarried partners), 329,669 children (310,438 natural, 7,905 adopted, 11,326 stepchildren), 23,492 grandchildren, 16,079 brothers or sisters, 28,500 parents, 961 foster children, 22,154 other relatives, 28,305 non-relatives
- In group quarters: 7,294
Size of family households: 82,436 2-persons, 58,942 3-persons, 54,469 4-persons, 27,657 5-persons, 12,204 6-persons, 8,546 7-or-more-persons.
Size of nonfamily households: 66,265 1-person, 12,716 2-persons, 2,571 3-persons, 845 4-persons, 368 5-persons.
153,531 married couples with children.
66,796 single-parent households (20,701 men, 46,095 women).
63.1% of residents of Gwinnett speak English at home.
18.9% of residents speak Spanish at home (52% speak English very well, 20% speak English well, 18% speak English not well, 9% don't speak English at all).
6.2% of residents speak other Indo-European language at home (73% speak English very well, 18% speak English well, 8% speak English not well, 1% don't speak English at all).
9.2% of residents speak Asian or Pacific Island language at home (45% speak English very well, 27% speak English well, 22% speak English not well, 6% don't speak English at all).
2.6% of residents speak other language at home (78% speak English very well, 12% speak English well, 7% speak English not well, 3% don't speak English at all).
In fiscal year 2004:
Federal Government expenditure: $1,560,186,000 ($2,226 per capita)
Department of Defense expenditure: $242,436,000
Federal direct payments to individuals for retirement and disability: $668,337,000
Federal other direct payments to individuals: $195,503,000
Federal direct payments not to individuals: $1,047,000
Federal grants: $222,341,000
Federal procurement contracts: $276,029,000 ($178,974,000 Department of Defense)
Federal salaries and wages: $196,929,000 ($1,786,000 Department of Defense)
Federal Government direct loans: $2,474,000
Federal guaranteed/insured loans: $1,024,230,000
Federal Government insurance: $163,360,000
Population change from April 1, 2000 to July 1, 2005:
Births: 62,826| Here: | 87 per 1000 residents |
| State: | 79 per 1000 residents |
Deaths: 13,800
| Here: | 19 per 1000 residents |
| State: | 38 per 1000 residents |
Net international migration: +29,980
| Here: | +41 per 1000 residents |
| State: | +21 per 1000 residents |
Net internal migration: +59,847
| Here: | +82 per 1000 residents |
| State: | +26 per 1000 residents |
Total withdrawal of fresh water for public supply: 90.36 millions of gallons per day (0% from ground, 100% from surface)
| Here: | 7.5 |
| State: | 6.8 |
| Here: | 4.6 |
| State: | 4.6 |
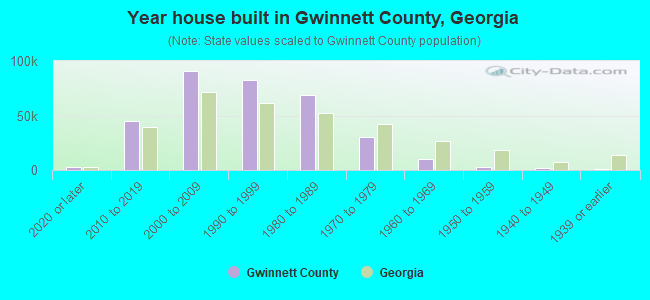
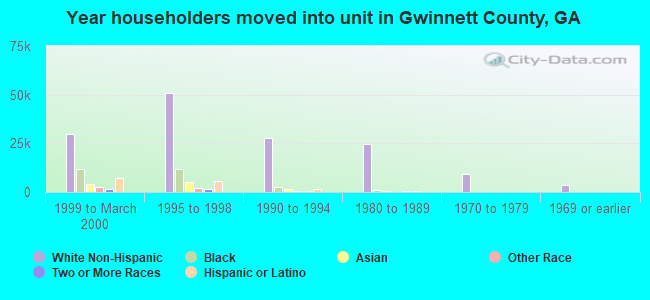
- Year house built in Gwinnett County, Georgia
- 10,2352020 or later
- 47,8272010 to 2019
- 83,4912000 to 2009
- 77,8141990 to 1999
- 74,5201980 to 1989
- 31,1951970 to 1979
- 8,5881960 to 1969
- 2,7161950 to 1959
- 2,2181940 to 1949
- 1,8781939 or earlier
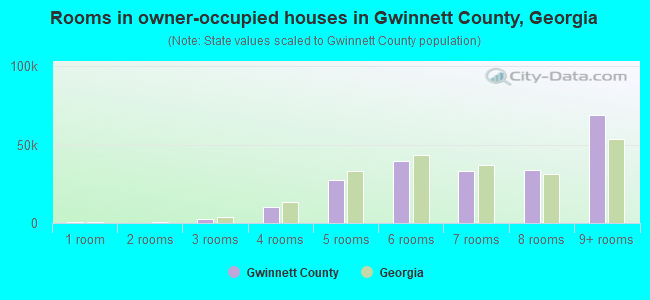
- Rooms in owner-occupied houses in Gwinnett County, Georgia
- 3721 room
- 1192 rooms
- 1,1583 rooms
- 11,1344 rooms
- 25,5625 rooms
- 35,4786 rooms
- 33,3847 rooms
- 32,1718 rooms
- 77,6229+ rooms
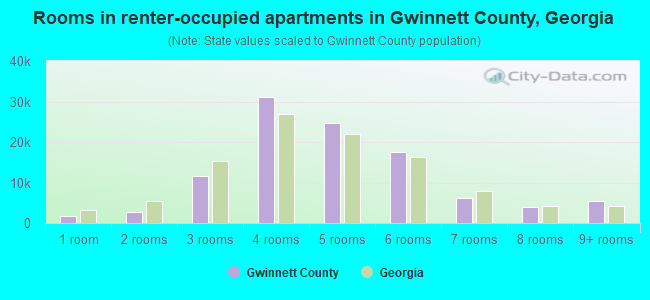
- Rooms in renter-occupied apartments in Gwinnett County, Georgia
- 2,1081 room
- 7,9362 rooms
- 16,2003 rooms
- 27,1394 rooms
- 20,1815 rooms
- 16,8106 rooms
- 7,0557 rooms
- 7,8018 rooms
- 4,7899+ rooms
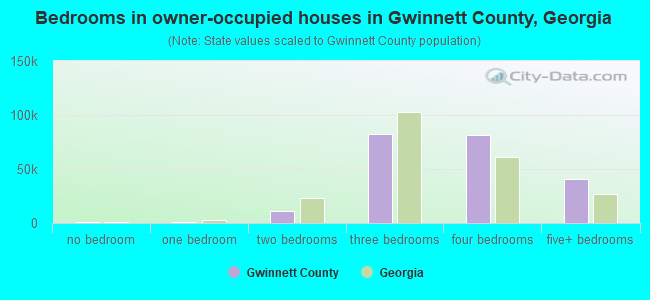
- Bedrooms in owner-occupied houses in Gwinnett County, Georgia
- 631no bedroom
- 3091 bedroom
- 9,4372 bedrooms
- 77,6473 bedrooms
- 83,1594 bedrooms
- 45,8175+ bedrooms
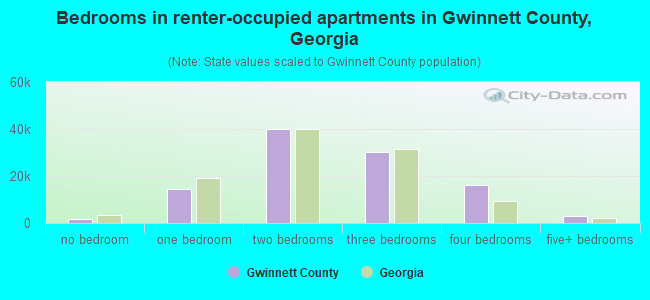
- Bedrooms in renter-occupied apartments in Gwinnett County, Georgia
- 2,197no bedroom
- 22,5751 bedroom
- 36,2072 bedrooms
- 32,5273 bedrooms
- 12,8924 bedrooms
- 3,6215+ bedrooms
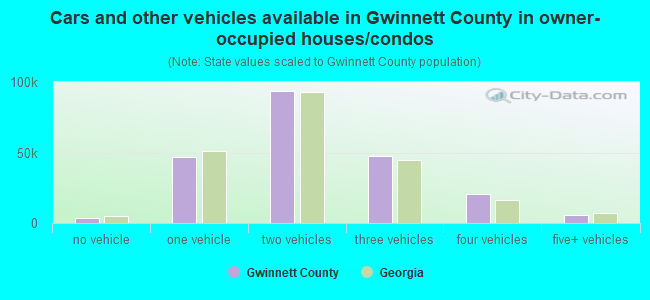
- Cars and other vehicles available in Gwinnett County in owner-occupied houses/condos
- 3,577no vehicle
- 43,1361 vehicle
- 91,1632 vehicles
- 48,7823 vehicles
- 21,4974 vehicles
- 8,8455+ vehicles
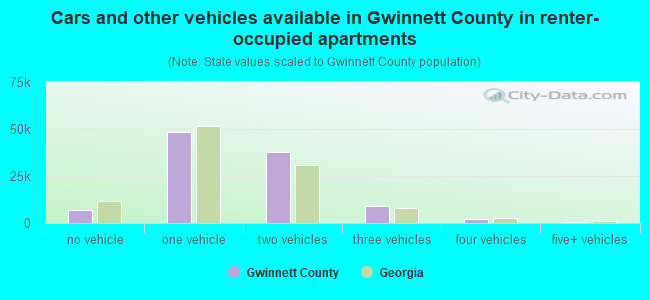
- Cars and other vehicles available in Gwinnett County in renter-occupied apartments
- 7,832no vehicle
- 52,1351 vehicle
- 37,3092 vehicles
- 9,2053 vehicles
- 2,7904 vehicles
- 7485+ vehicles
89.1% of Gwinnett County residents lived in the same house 1 years ago.
Out of people who lived in different houses, 36% lived in this county.
Out of people who lived in different counties, 45% lived in Georgia.
| Gwinnett County: | 89.1% |
| State average: | 86.6% |
Place of birth for U.S.-born residents:
- This state: 369,924
- Other state: 315,681
- Northeast: 82,990
- Midwest: 62,296
- South: 137,772
- West: 32,623
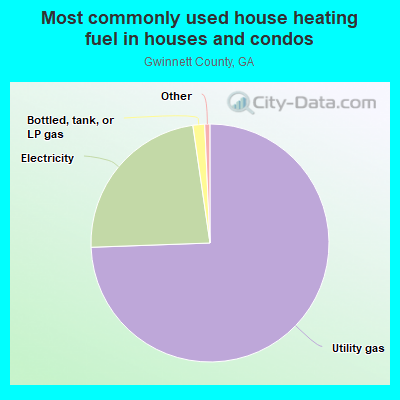
- 71.2%Utility gas
- 25.6%Electricity
- 2.4%Bottled, tank, or LP gas
- 0.4%Fuel oil, kerosene, etc.
- 0.2%No fuel used
- 0.1%Other fuel
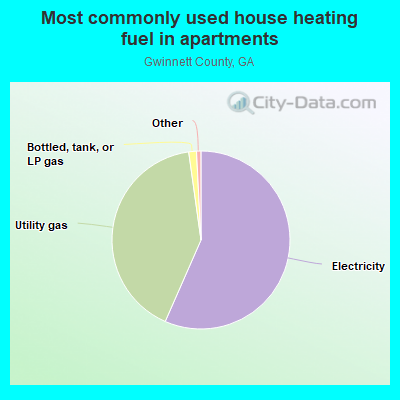
- 53.7%Electricity
- 42.4%Utility gas
- 2.3%Bottled, tank, or LP gas
- 1.3%No fuel used
- 0.2%Fuel oil, kerosene, etc.
- 0.1%Other fuel
Private vs. public school enrollment:
| Here: | 7.2% |
| Georgia: | 12.1% |
| Here: | 7.4% |
| Georgia: | 10.8% |
| Here: | 13.3% |
| Georgia: | 17.1% |
Gwinnett County government finances - Expenditure in 2020:
- Charges - Sewerage: $310,972,000
Sewerage: $181,247,000
Other: $78,029,000
Other: $64,454,000
Solid Waste Management: $43,724,000
Solid Waste Management: $40,452,000
Parks and Recreation: $5,385,000
Parks and Recreation: $5,058,000
Air Transportation: $999,000
Air Transportation: $986,000
- Construction - Sewerage: $122,223,000
Regular Highways: $78,591,000
Water Utilities: $65,284,000
Sewerage: $50,099,000
Central Staff Services: $46,801,000
Regular Highways: $43,930,000
Water Utilities: $33,399,000
General Public Buildings: $30,580,000
General - Other: $19,535,000
General - Other: $13,641,000
General Public Buildings: $13,056,000
Police Protection: $9,266,000
Local Fire Protection: $5,624,000
Central Staff Services: $5,243,000
Financial Administration: $3,598,000
Local Fire Protection: $3,242,000
Financial Administration: $2,293,000
Judicial and Legal Services: $1,090,000
Libraries: $1,024,000
Police Protection: $426,000
Libraries: $163,000
Correctional Institutions: $25,000
- Current Operations - Sewerage: $175,773,000
Water Utilities: $174,259,000
Water Utilities: $145,842,000
Police Protection: $127,660,000
Police Protection: $111,796,000
General - Other: $105,475,000
Local Fire Protection: $97,957,000
General - Other: $88,960,000
Local Fire Protection: $87,998,000
Sewerage: $71,829,000
Correctional Institutions: $70,127,000
Judicial and Legal Services: $69,537,000
Judicial and Legal Services: $63,023,000
Correctional Institutions: $62,669,000
Regular Highways: $61,253,000
Regular Highways: $51,887,000
Solid Waste Management: $41,687,000
Solid Waste Management: $38,102,000
Central Staff Services: $36,894,000
Central Staff Services: $35,437,000
Parks and Recreation: $31,284,000
Financial Administration: $22,363,000
Financial Administration: $19,800,000
Parks and Recreation: $19,695,000
Libraries: $19,325,000
Libraries: $17,476,000
General Public Buildings: $13,863,000
Protective Inspection and Regulation - Other: $10,041,000
Protective Inspection and Regulation - Other: $9,001,000
Housing and Community Development: $6,063,000
Health - Other: $6,047,000
Health - Other: $5,277,000
Public Welfare - Other: $2,395,000
Public Welfare - Other: $1,704,000
Air Transportation: $1,664,000
Air Transportation: $1,307,000
Natural Resources - Other: $306,000
Natural Resources - Other: $263,000
General Public Buildings: $114,000
- Federal Intergovernmental - Housing and Community Development: $7,291,000
Other: $6,715,000
Housing and Community Development: $6,166,000
Other: $2,981,000
Public Welfare: $383,000
General Local Government Support: $11,000
General Local Government Support: $8,000
- General - Interest on Debt: $36,862,000
Interest on Debt: $10,618,000
- Intergovernmental to Local - Other - General - Other: $41,199,000
Other - General - Other: $37,818,000
- Local Intergovernmental - Other: $4,840,000
Other: $2,226,000
- Long Term Debt - Beginning Outstanding - Unspecified Public Purpose: $1,603,957,000
Outstanding Unspecified Public Purpose: $1,451,426,000
Beginning Outstanding - Unspecified Public Purpose: $1,413,132,000
Outstanding Unspecified Public Purpose: $1,268,671,000
Outstanding Nonguaranteed - Industrial Revenue: $792,699,000
Beginning Outstanding - Public Debt for Private Purpose: $792,699,000
Outstanding Nonguaranteed - Industrial Revenue: $772,478,000
Beginning Outstanding - Public Debt for Private Purpose: $772,478,000
Retired Unspecified Public Purpose: $297,598,000
Retired Unspecified Public Purpose: $182,315,000
Issue, Unspecified Public Purpose: $153,137,000
Issue, Unspecified Public Purpose: $29,785,000
- Miscellaneous - General Revenue - Other: $52,179,000
Special Assessments: $31,410,000
Special Assessments: $28,436,000
Interest Earnings: $27,642,000
Fines and Forfeits: $13,055,000
Interest Earnings: $12,648,000
Fines and Forfeits: $10,934,000
General Revenue - Other: $10,075,000
Donations From Private Sources: $9,098,000
Donations From Private Sources: $7,180,000
Rents: $3,462,000
Rents: $2,578,000
Sale of Property: $1,891,000
Sale of Property: $836,000
- Other Capital Outlay - Police Protection: $15,519,000
Sewerage: $4,357,000
Police Protection: $4,289,000
Water Utilities: $2,905,000
Regular Highways: $2,789,000
Financial Administration: $2,563,000
Financial Administration: $2,507,000
General - Other: $1,408,000
Sewerage: $1,076,000
Regular Highways: $963,000
General - Other: $910,000
Water Utilities: $881,000
General Public Building: $572,000
Local Fire Protection: $455,000
General Public Building: $403,000
Correctional Institutions: $394,000
Correctional Institutions: $351,000
Central Staff Services: $320,000
Judicial and Legal Services: $303,000
Judicial and Legal Services: $180,000
Central Staff Services: $120,000
Local Fire Protection: $55,000
Libraries: $33,000
- Other Funds - Cash and Securities: $1,963,283,000
Cash and Securities: $1,854,601,000
- Revenue - Water Utilities: $311,169,000
Water Utilities: $154,326,000
Transit Utilities: $3,625,000
Transit Utilities: $2,948,000
- Sinking Funds - Cash and Securities: $1,519,996,000
Cash and Securities: $820,422,000
- State Intergovernmental - Highways: $23,713,000
Other: $17,631,000
Highways: $15,027,000
Other: $5,679,000
General Local Government Support: $3,189,000
General Local Government Support: $2,818,000
Public Welfare: $2,045,000
Public Welfare: $1,842,000
- Tax - Property: $475,679,000
Property: $417,692,000
General Sales and Gross Receipts: $172,255,000
General Sales and Gross Receipts: $151,800,000
Insurance Premiums Sales: $42,070,000
Insurance Premiums Sales: $36,321,000
Occupation and Business License - Other: $16,674,000
Occupation and Business License - Other: $15,429,000
Other Selective Sales: $12,969,000
Other Selective Sales: $11,398,000
Public Utilities Sales: $7,147,000
Public Utilities Sales: $6,621,000
Alcoholic Beverage Sales: $5,891,000
Alcoholic Beverage Sales: $5,783,000
Other License: $5,772,000
Other License: $5,526,000
Alcoholic Beverage License: $2,850,000
Alcoholic Beverage License: $2,775,000
Other: $2,172,000
Other: $2,168,000
- Total Salaries and Wages: $35,756,000
: $29,826,000
- Water Utilities - Interest on Debt: $59,424,000
Interest on Debt: $19,794,000
Gwinnett County government finances - Revenue in 2020:
- Charges - Sewerage: $310,972,000
Sewerage: $181,247,000
Other: $78,029,000
Other: $64,454,000
Solid Waste Management: $43,724,000
Solid Waste Management: $40,452,000
Parks and Recreation: $5,385,000
Parks and Recreation: $5,058,000
Air Transportation: $999,000
Air Transportation: $986,000
- Construction - Sewerage: $122,223,000
Regular Highways: $78,591,000
Water Utilities: $65,284,000
Sewerage: $50,099,000
Central Staff Services: $46,801,000
Regular Highways: $43,930,000
Water Utilities: $33,399,000
General Public Buildings: $30,580,000
General - Other: $19,535,000
General - Other: $13,641,000
General Public Buildings: $13,056,000
Police Protection: $9,266,000
Local Fire Protection: $5,624,000
Central Staff Services: $5,243,000
Financial Administration: $3,598,000
Local Fire Protection: $3,242,000
Financial Administration: $2,293,000
Judicial and Legal Services: $1,090,000
Libraries: $1,024,000
Police Protection: $426,000
Libraries: $163,000
Correctional Institutions: $25,000
- Current Operations - Sewerage: $175,773,000
Water Utilities: $174,259,000
Water Utilities: $145,842,000
Police Protection: $127,660,000
Police Protection: $111,796,000
General - Other: $105,475,000
Local Fire Protection: $97,957,000
General - Other: $88,960,000
Local Fire Protection: $87,998,000
Sewerage: $71,829,000
Correctional Institutions: $70,127,000
Judicial and Legal Services: $69,537,000
Judicial and Legal Services: $63,023,000
Correctional Institutions: $62,669,000
Regular Highways: $61,253,000
Regular Highways: $51,887,000
Solid Waste Management: $41,687,000
Solid Waste Management: $38,102,000
Central Staff Services: $36,894,000
Central Staff Services: $35,437,000
Parks and Recreation: $31,284,000
Financial Administration: $22,363,000
Financial Administration: $19,800,000
Parks and Recreation: $19,695,000
Libraries: $19,325,000
Libraries: $17,476,000
General Public Buildings: $13,863,000
Protective Inspection and Regulation - Other: $10,041,000
Protective Inspection and Regulation - Other: $9,001,000
Housing and Community Development: $6,063,000
Health - Other: $6,047,000
Health - Other: $5,277,000
Public Welfare - Other: $2,395,000
Public Welfare - Other: $1,704,000
Air Transportation: $1,664,000
Air Transportation: $1,307,000
Natural Resources - Other: $306,000
Natural Resources - Other: $263,000
General Public Buildings: $114,000
- Federal Intergovernmental - Housing and Community Development: $7,291,000
Other: $6,715,000
Housing and Community Development: $6,166,000
Other: $2,981,000
Public Welfare: $383,000
General Local Government Support: $11,000
General Local Government Support: $8,000
- General - Interest on Debt: $36,862,000
Interest on Debt: $10,618,000
- Intergovernmental to Local - Other - General - Other: $41,199,000
Other - General - Other: $37,818,000
- Local Intergovernmental - Other: $4,840,000
Other: $2,226,000
- Long Term Debt - Beginning Outstanding - Unspecified Public Purpose: $1,603,957,000
Outstanding Unspecified Public Purpose: $1,451,426,000
Beginning Outstanding - Unspecified Public Purpose: $1,413,132,000
Outstanding Unspecified Public Purpose: $1,268,671,000
Outstanding Nonguaranteed - Industrial Revenue: $792,699,000
Beginning Outstanding - Public Debt for Private Purpose: $792,699,000
Outstanding Nonguaranteed - Industrial Revenue: $772,478,000
Beginning Outstanding - Public Debt for Private Purpose: $772,478,000
Retired Unspecified Public Purpose: $297,598,000
Retired Unspecified Public Purpose: $182,315,000
Issue, Unspecified Public Purpose: $153,137,000
Issue, Unspecified Public Purpose: $29,785,000
- Miscellaneous - General Revenue - Other: $52,179,000
Special Assessments: $31,410,000
Special Assessments: $28,436,000
Interest Earnings: $27,642,000
Fines and Forfeits: $13,055,000
Interest Earnings: $12,648,000
Fines and Forfeits: $10,934,000
General Revenue - Other: $10,075,000
Donations From Private Sources: $9,098,000
Donations From Private Sources: $7,180,000
Rents: $3,462,000
Rents: $2,578,000
Sale of Property: $1,891,000
Sale of Property: $836,000
- Other Capital Outlay - Police Protection: $15,519,000
Sewerage: $4,357,000
Police Protection: $4,289,000
Water Utilities: $2,905,000
Regular Highways: $2,789,000
Financial Administration: $2,563,000
Financial Administration: $2,507,000
General - Other: $1,408,000
Sewerage: $1,076,000
Regular Highways: $963,000
General - Other: $910,000
Water Utilities: $881,000
General Public Building: $572,000
Local Fire Protection: $455,000
General Public Building: $403,000
Correctional Institutions: $394,000
Correctional Institutions: $351,000
Central Staff Services: $320,000
Judicial and Legal Services: $303,000
Judicial and Legal Services: $180,000
Central Staff Services: $120,000
Local Fire Protection: $55,000
Libraries: $33,000
- Other Funds - Cash and Securities: $1,963,283,000
Cash and Securities: $1,854,601,000
- Revenue - Water Utilities: $311,169,000
Water Utilities: $154,326,000
Transit Utilities: $3,625,000
Transit Utilities: $2,948,000
- Sinking Funds - Cash and Securities: $1,519,996,000
Cash and Securities: $820,422,000
- State Intergovernmental - Highways: $23,713,000
Other: $17,631,000
Highways: $15,027,000
Other: $5,679,000
General Local Government Support: $3,189,000
General Local Government Support: $2,818,000
Public Welfare: $2,045,000
Public Welfare: $1,842,000
- Tax - Property: $475,679,000
Property: $417,692,000
General Sales and Gross Receipts: $172,255,000
General Sales and Gross Receipts: $151,800,000
Insurance Premiums Sales: $42,070,000
Insurance Premiums Sales: $36,321,000
Occupation and Business License - Other: $16,674,000
Occupation and Business License - Other: $15,429,000
Other Selective Sales: $12,969,000
Other Selective Sales: $11,398,000
Public Utilities Sales: $7,147,000
Public Utilities Sales: $6,621,000
Alcoholic Beverage Sales: $5,891,000
Alcoholic Beverage Sales: $5,783,000
Other License: $5,772,000
Other License: $5,526,000
Alcoholic Beverage License: $2,850,000
Alcoholic Beverage License: $2,775,000
Other: $2,172,000
Other: $2,168,000
- Total Salaries and Wages: $35,756,000
: $29,826,000
- Water Utilities - Interest on Debt: $59,424,000
Interest on Debt: $19,794,000
Gwinnett County government finances - Debt in 2020:
- Charges - Sewerage: $310,972,000
Sewerage: $181,247,000
Other: $78,029,000
Other: $64,454,000
Solid Waste Management: $43,724,000
Solid Waste Management: $40,452,000
Parks and Recreation: $5,385,000
Parks and Recreation: $5,058,000
Air Transportation: $999,000
Air Transportation: $986,000
- Construction - Sewerage: $122,223,000
Regular Highways: $78,591,000
Water Utilities: $65,284,000
Sewerage: $50,099,000
Central Staff Services: $46,801,000
Regular Highways: $43,930,000
Water Utilities: $33,399,000
General Public Buildings: $30,580,000
General - Other: $19,535,000
General - Other: $13,641,000
General Public Buildings: $13,056,000
Police Protection: $9,266,000
Local Fire Protection: $5,624,000
Central Staff Services: $5,243,000
Financial Administration: $3,598,000
Local Fire Protection: $3,242,000
Financial Administration: $2,293,000
Judicial and Legal Services: $1,090,000
Libraries: $1,024,000
Police Protection: $426,000
Libraries: $163,000
Correctional Institutions: $25,000
- Current Operations - Sewerage: $175,773,000
Water Utilities: $174,259,000
Water Utilities: $145,842,000
Police Protection: $127,660,000
Police Protection: $111,796,000
General - Other: $105,475,000
Local Fire Protection: $97,957,000
General - Other: $88,960,000
Local Fire Protection: $87,998,000
Sewerage: $71,829,000
Correctional Institutions: $70,127,000
Judicial and Legal Services: $69,537,000
Judicial and Legal Services: $63,023,000
Correctional Institutions: $62,669,000
Regular Highways: $61,253,000
Regular Highways: $51,887,000
Solid Waste Management: $41,687,000
Solid Waste Management: $38,102,000
Central Staff Services: $36,894,000
Central Staff Services: $35,437,000
Parks and Recreation: $31,284,000
Financial Administration: $22,363,000
Financial Administration: $19,800,000
Parks and Recreation: $19,695,000
Libraries: $19,325,000
Libraries: $17,476,000
General Public Buildings: $13,863,000
Protective Inspection and Regulation - Other: $10,041,000
Protective Inspection and Regulation - Other: $9,001,000
Housing and Community Development: $6,063,000
Health - Other: $6,047,000
Health - Other: $5,277,000
Public Welfare - Other: $2,395,000
Public Welfare - Other: $1,704,000
Air Transportation: $1,664,000
Air Transportation: $1,307,000
Natural Resources - Other: $306,000
Natural Resources - Other: $263,000
General Public Buildings: $114,000
- Federal Intergovernmental - Housing and Community Development: $7,291,000
Other: $6,715,000
Housing and Community Development: $6,166,000
Other: $2,981,000
Public Welfare: $383,000
General Local Government Support: $11,000
General Local Government Support: $8,000
- General - Interest on Debt: $36,862,000
Interest on Debt: $10,618,000
- Intergovernmental to Local - Other - General - Other: $41,199,000
Other - General - Other: $37,818,000
- Local Intergovernmental - Other: $4,840,000
Other: $2,226,000
- Long Term Debt - Beginning Outstanding - Unspecified Public Purpose: $1,603,957,000
Outstanding Unspecified Public Purpose: $1,451,426,000
Beginning Outstanding - Unspecified Public Purpose: $1,413,132,000
Outstanding Unspecified Public Purpose: $1,268,671,000
Outstanding Nonguaranteed - Industrial Revenue: $792,699,000
Beginning Outstanding - Public Debt for Private Purpose: $792,699,000
Outstanding Nonguaranteed - Industrial Revenue: $772,478,000
Beginning Outstanding - Public Debt for Private Purpose: $772,478,000
Retired Unspecified Public Purpose: $297,598,000
Retired Unspecified Public Purpose: $182,315,000
Issue, Unspecified Public Purpose: $153,137,000
Issue, Unspecified Public Purpose: $29,785,000
- Miscellaneous - General Revenue - Other: $52,179,000
Special Assessments: $31,410,000
Special Assessments: $28,436,000
Interest Earnings: $27,642,000
Fines and Forfeits: $13,055,000
Interest Earnings: $12,648,000
Fines and Forfeits: $10,934,000
General Revenue - Other: $10,075,000
Donations From Private Sources: $9,098,000
Donations From Private Sources: $7,180,000
Rents: $3,462,000
Rents: $2,578,000
Sale of Property: $1,891,000
Sale of Property: $836,000
- Other Capital Outlay - Police Protection: $15,519,000
Sewerage: $4,357,000
Police Protection: $4,289,000
Water Utilities: $2,905,000
Regular Highways: $2,789,000
Financial Administration: $2,563,000
Financial Administration: $2,507,000
General - Other: $1,408,000
Sewerage: $1,076,000
Regular Highways: $963,000
General - Other: $910,000
Water Utilities: $881,000
General Public Building: $572,000
Local Fire Protection: $455,000
General Public Building: $403,000
Correctional Institutions: $394,000
Correctional Institutions: $351,000
Central Staff Services: $320,000
Judicial and Legal Services: $303,000
Judicial and Legal Services: $180,000
Central Staff Services: $120,000
Local Fire Protection: $55,000
Libraries: $33,000
- Other Funds - Cash and Securities: $1,963,283,000
Cash and Securities: $1,854,601,000
- Revenue - Water Utilities: $311,169,000
Water Utilities: $154,326,000
Transit Utilities: $3,625,000
Transit Utilities: $2,948,000
- Sinking Funds - Cash and Securities: $1,519,996,000
Cash and Securities: $820,422,000
- State Intergovernmental - Highways: $23,713,000
Other: $17,631,000
Highways: $15,027,000
Other: $5,679,000
General Local Government Support: $3,189,000
General Local Government Support: $2,818,000
Public Welfare: $2,045,000
Public Welfare: $1,842,000
- Tax - Property: $475,679,000
Property: $417,692,000
General Sales and Gross Receipts: $172,255,000
General Sales and Gross Receipts: $151,800,000
Insurance Premiums Sales: $42,070,000
Insurance Premiums Sales: $36,321,000
Occupation and Business License - Other: $16,674,000
Occupation and Business License - Other: $15,429,000
Other Selective Sales: $12,969,000
Other Selective Sales: $11,398,000
Public Utilities Sales: $7,147,000
Public Utilities Sales: $6,621,000
Alcoholic Beverage Sales: $5,891,000
Alcoholic Beverage Sales: $5,783,000
Other License: $5,772,000
Other License: $5,526,000
Alcoholic Beverage License: $2,850,000
Alcoholic Beverage License: $2,775,000
Other: $2,172,000
Other: $2,168,000
- Total Salaries and Wages: $35,756,000
: $29,826,000
- Water Utilities - Interest on Debt: $59,424,000
Interest on Debt: $19,794,000
Gwinnett County government finances - Cash and Securities in 2020:
- Charges - Sewerage: $310,972,000
Sewerage: $181,247,000
Other: $78,029,000
Other: $64,454,000
Solid Waste Management: $43,724,000
Solid Waste Management: $40,452,000
Parks and Recreation: $5,385,000
Parks and Recreation: $5,058,000
Air Transportation: $999,000
Air Transportation: $986,000
- Construction - Sewerage: $122,223,000
Regular Highways: $78,591,000
Water Utilities: $65,284,000
Sewerage: $50,099,000
Central Staff Services: $46,801,000
Regular Highways: $43,930,000
Water Utilities: $33,399,000
General Public Buildings: $30,580,000
General - Other: $19,535,000
General - Other: $13,641,000
General Public Buildings: $13,056,000
Police Protection: $9,266,000
Local Fire Protection: $5,624,000
Central Staff Services: $5,243,000
Financial Administration: $3,598,000
Local Fire Protection: $3,242,000
Financial Administration: $2,293,000
Judicial and Legal Services: $1,090,000
Libraries: $1,024,000
Police Protection: $426,000
Libraries: $163,000
Correctional Institutions: $25,000
- Current Operations - Sewerage: $175,773,000
Water Utilities: $174,259,000
Water Utilities: $145,842,000
Police Protection: $127,660,000
Police Protection: $111,796,000
General - Other: $105,475,000
Local Fire Protection: $97,957,000
General - Other: $88,960,000
Local Fire Protection: $87,998,000
Sewerage: $71,829,000
Correctional Institutions: $70,127,000
Judicial and Legal Services: $69,537,000
Judicial and Legal Services: $63,023,000
Correctional Institutions: $62,669,000
Regular Highways: $61,253,000
Regular Highways: $51,887,000
Solid Waste Management: $41,687,000
Solid Waste Management: $38,102,000
Central Staff Services: $36,894,000
Central Staff Services: $35,437,000
Parks and Recreation: $31,284,000
Financial Administration: $22,363,000
Financial Administration: $19,800,000
Parks and Recreation: $19,695,000
Libraries: $19,325,000
Libraries: $17,476,000
General Public Buildings: $13,863,000
Protective Inspection and Regulation - Other: $10,041,000
Protective Inspection and Regulation - Other: $9,001,000
Housing and Community Development: $6,063,000
Health - Other: $6,047,000
Health - Other: $5,277,000
Public Welfare - Other: $2,395,000
Public Welfare - Other: $1,704,000
Air Transportation: $1,664,000
Air Transportation: $1,307,000
Natural Resources - Other: $306,000
Natural Resources - Other: $263,000
General Public Buildings: $114,000
- Federal Intergovernmental - Housing and Community Development: $7,291,000
Other: $6,715,000
Housing and Community Development: $6,166,000
Other: $2,981,000
Public Welfare: $383,000
General Local Government Support: $11,000
General Local Government Support: $8,000
- General - Interest on Debt: $36,862,000
Interest on Debt: $10,618,000
- Intergovernmental to Local - Other - General - Other: $41,199,000
Other - General - Other: $37,818,000
- Local Intergovernmental - Other: $4,840,000
Other: $2,226,000
- Long Term Debt - Beginning Outstanding - Unspecified Public Purpose: $1,603,957,000
Outstanding Unspecified Public Purpose: $1,451,426,000
Beginning Outstanding - Unspecified Public Purpose: $1,413,132,000
Outstanding Unspecified Public Purpose: $1,268,671,000
Outstanding Nonguaranteed - Industrial Revenue: $792,699,000
Beginning Outstanding - Public Debt for Private Purpose: $792,699,000
Outstanding Nonguaranteed - Industrial Revenue: $772,478,000
Beginning Outstanding - Public Debt for Private Purpose: $772,478,000
Retired Unspecified Public Purpose: $297,598,000
Retired Unspecified Public Purpose: $182,315,000
Issue, Unspecified Public Purpose: $153,137,000
Issue, Unspecified Public Purpose: $29,785,000
- Miscellaneous - General Revenue - Other: $52,179,000
Special Assessments: $31,410,000
Special Assessments: $28,436,000
Interest Earnings: $27,642,000
Fines and Forfeits: $13,055,000
Interest Earnings: $12,648,000
Fines and Forfeits: $10,934,000
General Revenue - Other: $10,075,000
Donations From Private Sources: $9,098,000
Donations From Private Sources: $7,180,000
Rents: $3,462,000
Rents: $2,578,000
Sale of Property: $1,891,000
Sale of Property: $836,000
- Other Capital Outlay - Police Protection: $15,519,000
Sewerage: $4,357,000
Police Protection: $4,289,000
Water Utilities: $2,905,000
Regular Highways: $2,789,000
Financial Administration: $2,563,000
Financial Administration: $2,507,000
General - Other: $1,408,000
Sewerage: $1,076,000
Regular Highways: $963,000
General - Other: $910,000
Water Utilities: $881,000
General Public Building: $572,000
Local Fire Protection: $455,000
General Public Building: $403,000
Correctional Institutions: $394,000
Correctional Institutions: $351,000
Central Staff Services: $320,000
Judicial and Legal Services: $303,000
Judicial and Legal Services: $180,000
Central Staff Services: $120,000
Local Fire Protection: $55,000
Libraries: $33,000
- Other Funds - Cash and Securities: $1,963,283,000
Cash and Securities: $1,854,601,000
- Revenue - Water Utilities: $311,169,000
Water Utilities: $154,326,000
Transit Utilities: $3,625,000
Transit Utilities: $2,948,000
- Sinking Funds - Cash and Securities: $1,519,996,000
Cash and Securities: $820,422,000
- State Intergovernmental - Highways: $23,713,000
Other: $17,631,000
Highways: $15,027,000
Other: $5,679,000
General Local Government Support: $3,189,000
General Local Government Support: $2,818,000
Public Welfare: $2,045,000
Public Welfare: $1,842,000
- Tax - Property: $475,679,000
Property: $417,692,000
General Sales and Gross Receipts: $172,255,000
General Sales and Gross Receipts: $151,800,000
Insurance Premiums Sales: $42,070,000
Insurance Premiums Sales: $36,321,000
Occupation and Business License - Other: $16,674,000
Occupation and Business License - Other: $15,429,000
Other Selective Sales: $12,969,000
Other Selective Sales: $11,398,000
Public Utilities Sales: $7,147,000
Public Utilities Sales: $6,621,000
Alcoholic Beverage Sales: $5,891,000
Alcoholic Beverage Sales: $5,783,000
Other License: $5,772,000
Other License: $5,526,000
Alcoholic Beverage License: $2,850,000
Alcoholic Beverage License: $2,775,000
Other: $2,172,000
Other: $2,168,000
- Total Salaries and Wages: $35,756,000
: $29,826,000
- Water Utilities - Interest on Debt: $59,424,000
Interest on Debt: $19,794,000
Supplemental Security Income (SSI) in 2006:
- Total number of recipients: 6,811
- Number of aged recipients: 2,117
- Number of blind and disabled recipients: 4,694
- Number of recipients under 18: 1,310
- Number of recipients between 18 and 64: 2,742
- Number of recipients older than 64: 2,759
- Number of recipients also receiving OASDI: 1,680
- Amount of payments (thousands of dollars): 3,046
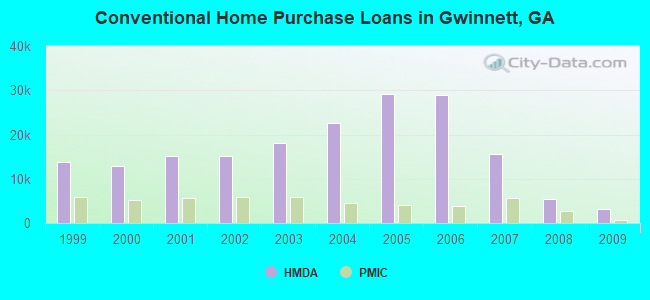
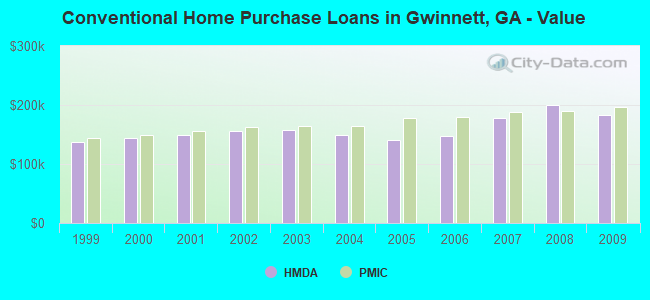
| Home Mortgage Disclosure Act Aggregated Statistics For Year 2009 (Based on 71 full tracts) | ||||||||||||||
| A) FHA, FSA/RHS & VA Home Purchase Loans | B) Conventional Home Purchase Loans | C) Refinancings | D) Home Improvement Loans | E) Loans on Dwellings For 5+ Families | F) Non-occupant Loans on < 5 Family Dwellings (A B C & D) | G) Loans On Manufactured Home Dwelling (A B C & D) | ||||||||
|---|---|---|---|---|---|---|---|---|---|---|---|---|---|---|
| Number | Average Value | Number | Average Value | Number | Average Value | Number | Average Value | Number | Average Value | Number | Average Value | Number | Average Value | |
| LOANS ORIGINATED | 4,947 | $153,473 | 3,133 | $183,305 | 14,091 | $187,863 | 381 | $83,152 | 10 | $16,051,000 | 1,012 | $135,277 | 23 | $42,957 |
| APPLICATIONS APPROVED, NOT ACCEPTED | 221 | $158,706 | 242 | $179,079 | 1,335 | $189,563 | 121 | $42,992 | 0 | $0 | 75 | $128,707 | 8 | $57,125 |
| APPLICATIONS DENIED | 934 | $144,268 | 737 | $182,589 | 6,509 | $187,416 | 534 | $51,112 | 0 | $0 | 515 | $125,414 | 23 | $72,435 |
| APPLICATIONS WITHDRAWN | 795 | $149,984 | 557 | $196,162 | 4,859 | $191,152 | 129 | $90,248 | 1 | $6,700,000 | 253 | $125,423 | 8 | $64,375 |
| FILES CLOSED FOR INCOMPLETENESS | 155 | $151,110 | 156 | $198,038 | 1,087 | $194,029 | 33 | $97,212 | 0 | $0 | 62 | $121,435 | 4 | $58,000 |
| Private Mortgage Insurance Companies Aggregated Statistics For Year 2009 (Based on 71 full tracts) | ||||||
| A) Conventional Home Purchase Loans | B) Refinancings | C) Non-occupant Loans on < 5 Family Dwellings (A & B) | ||||
|---|---|---|---|---|---|---|
| Number | Average Value | Number | Average Value | Number | Average Value | |
| LOANS ORIGINATED | 599 | $196,048 | 595 | $202,550 | 19 | $139,368 |
| APPLICATIONS APPROVED, NOT ACCEPTED | 305 | $200,941 | 289 | $202,830 | 22 | $137,864 |
| APPLICATIONS DENIED | 100 | $182,940 | 145 | $198,317 | 13 | $181,462 |
| APPLICATIONS WITHDRAWN | 56 | $182,732 | 56 | $206,536 | 4 | $145,500 |
| FILES CLOSED FOR INCOMPLETENESS | 45 | $165,978 | 33 | $185,061 | 14 | $152,857 |
| Most common first names in Gwinnett County, GA among deceased individuals | ||
| Name | Count | Lived (average) |
|---|---|---|
| James | 866 | 72.3 years |
| Mary | 780 | 78.8 years |
| William | 740 | 74.1 years |
| John | 728 | 74.5 years |
| Robert | 606 | 72.1 years |
| Charles | 386 | 71.8 years |
| Dorothy | 355 | 79.3 years |
| George | 315 | 76.1 years |
| Thomas | 311 | 71.8 years |
| Margaret | 288 | 79.1 years |
| Most common last names in Gwinnett County, GA among deceased individuals | ||
| Last name | Count | Lived (average) |
|---|---|---|
| Smith | 438 | 75.1 years |
| Johnson | 318 | 75.7 years |
| Jones | 241 | 74.1 years |
| Williams | 213 | 74.3 years |
| Brown | 204 | 73.4 years |
| Davis | 195 | 75.6 years |
| Jackson | 148 | 71.0 years |
| Martin | 143 | 75.2 years |
| Miller | 135 | 75.0 years |
| Moore | 130 | 74.2 years |
| Businesses in Gwinnett County, GA | ||||
| Name | Count | Name | Count | |
|---|---|---|---|---|
| ALDI | 3 | Kmart | 2 | |
| AMF Bowling | 1 | Kohl's | 5 | |
| AT&T | 16 | Kroger | 21 | |
| Abercrombie & Fitch | 1 | LA Fitness | 5 | |
| Abercrombie Kids | 1 | La Quinta | 3 | |
| Academy Sports + Outdoors | 1 | La-Z-Boy | 1 | |
| Ace Hardware | 5 | Lane Bryant | 1 | |
| Advance Auto Parts | 18 | Lane Furniture | 3 | |
| Aeropostale | 2 | LensCrafters | 4 | |
| American Eagle Outfitters | 2 | Levi Strauss & Co. | 1 | |
| Ann Taylor | 3 | Little Caesars Pizza | 12 | |
| Applebee's | 6 | Long John Silver's | 2 | |
| Arby's | 9 | Lowe's | 5 | |
| Ashley Furniture | 1 | Macy's | 2 | |
| Audi | 1 | Marriott | 8 | |
| AutoZone | 14 | Marshalls | 3 | |
| Avenue | 2 | MasterBrand Cabinets | 8 | |
| BMW | 1 | Mazda | 1 | |
| Bakers | 1 | McDonald's | 29 | |
| Bally Total Fitness | 1 | Men's Wearhouse | 3 | |
| Banana Republic | 2 | Motel 6 | 3 | |
| Barnes & Noble | 2 | Motherhood Maternity | 3 | |
| Baskin-Robbins | 5 | New Balance | 6 | |
| Bath & Body Works | 5 | New York & Co | 1 | |
| Bed Bath & Beyond | 3 | Nike | 35 | |
| Blockbuster | 16 | Nissan | 2 | |
| Brunswick Bowling & Billiards | 2 | Office Depot | 6 | |
| Budget Car Rental | 2 | OfficeMax | 2 | |
| Burger King | 26 | Old Navy | 3 | |
| CVS | 25 | Olive Garden | 1 | |
| CarMax | 1 | On The Border | 1 | |
| Caribou Coffee | 1 | Outback | 1 | |
| Casual Male XL | 1 | Outback Steakhouse | 1 | |
| Catherines | 1 | Pac Sun | 2 | |
| Charlotte Russe | 1 | Panda Express | 6 | |
| Chevrolet | 3 | Panera Bread | 4 | |
| Chick-Fil-A | 13 | Papa John's Pizza | 8 | |
| Chico's | 2 | Payless | 7 | |
| Chipotle | 3 | Penske | 9 | |
| Chuck E. Cheese's | 1 | PetSmart | 4 | |
| Church's Chicken | 3 | Pier 1 Imports | 2 | |
| Cinnabon | 1 | Pizza Hut | 16 | |
| Circle K | 1 | Plato's Closet | 1 | |
| Cold Stone Creamery | 2 | Popeyes | 5 | |
| Coldwater Creek | 2 | Pottery Barn | 1 | |
| Comfort Inn | 3 | Publix Super Markets | 26 | |
| Comfort Suites | 3 | Qdoba Mexican Grill | 1 | |
| Costco | 1 | Quality | 1 | |
| Cracker Barrel | 3 | Quiznos | 15 | |
| Curves | 6 | RadioShack | 8 | |
| DHL | 14 | Red Lobster | 2 | |
| Dairy Queen | 7 | Red Robin | 1 | |
| Days Inn | 3 | Red Roof Inn | 1 | |
| Decora Cabinetry | 2 | Rite Aid | 13 | |
| Dennys | 1 | Rooms To Go | 3 | |
| Discount Tire | 4 | Ruby Tuesday | 2 | |
| Domino's Pizza | 7 | Rue21 | 1 | |
| DressBarn | 2 | Ryan's Grill | 1 | |
| Dressbarn | 2 | SAS Shoes | 1 | |
| Dunkin Donuts | 13 | SONIC Drive-In | 10 | |
| Eddie Bauer | 1 | Sam's Club | 2 | |
| Express | 2 | Sears | 9 | |
| Extended Stay America | 4 | Shoe Carnival | 2 | |
| Extended Stay Deluxe | 1 | Skechers USA | 1 | |
| Famous Footwear | 4 | Spencer Gifts | 2 | |
| FedEx | 113 | Sprint Nextel | 9 | |
| Finish Line | 1 | Staples | 4 | |
| Firestone Complete Auto Care | 7 | Starbucks | 27 | |
| Foot Locker | 2 | Steak 'n Shake | 4 | |
| Ford | 3 | Studio 6 | 1 | |
| Forever 21 | 2 | Studio Plus Deluxe Studios | 1 | |
| Fredericks Of Hollywood | 2 | Subaru | 1 | |
| GNC | 14 | Suburban | 1 | |
| GameStop | 12 | Subway | 38 | |
| Gap | 1 | Super 8 | 1 | |
| Goodwill | 2 | T-Mobile | 24 | |
| Gymboree | 4 | T.G.I. Driday's | 1 | |
| H&R Block | 19 | T.J.Maxx | 4 | |
| Hardee's | 2 | Taco Bell | 16 | |
| Havertys Furniture | 2 | Talbots | 3 | |
| Hilton | 8 | Target | 6 | |
| Hobby Lobby | 4 | The Room Place | 1 | |
| Holiday Inn | 8 | Toyota | 2 | |
| Home Depot | 11 | Toys"R"Us | 4 | |
| Homestead Studio Suites | 1 | Trader Joe's | 1 | |
| Honda | 2 | True Value | 1 | |
| Hot Topic | 1 | U-Haul | 35 | |
| Hyatt | 3 | UPS | 118 | |
| Hyundai | 2 | Value City Furniture | 1 | |
| IHOP | 10 | Vans | 4 | |
| InTown Suites | 6 | Verizon Wireless | 5 | |
| J. Jill | 1 | Victoria's Secret | 3 | |
| J.Crew | 1 | Volkswagen | 1 | |
| JCPenney | 2 | Waffle House | 31 | |
| JoS. A. Bank | 3 | Walgreens | 18 | |
| Johnny Rockets | 1 | Walmart | 7 | |
| Jones New York | 12 | Wendy's | 22 | |
| Journeys | 2 | Wet Seal | 1 | |
| Justice | 4 | Whole Foods Market | 1 | |
| KFC | 13 | Wingate | 1 | |
| Kincaid | 3 | YMCA | 2 | |
Gwinnett County on our top lists:
- #8 on the list of "Top 101 counties with the lowest number of deaths per 1000 residents 2007-2013 (pop. 50,000+)"
- #24 on the list of "Top 101 counties with the largest number of children under 18 without health insurance coverage in 2000 (pop. 50,000+)"
- #25 on the list of "Top 101 counties with the lowest percentage of residents that smoked 100+ cigarettes in their lives"
- #26 on the list of "Top 101 counties with the highest percentage of residents that visited a dentist within the past year"
- #26 on the list of "Top 101 counties with the largest decrease in the number of births per 1000 residents 2000-2006 to 2007-2013 (pop 50,000+)"
- #26 on the list of "Top 101 counties with the most Evangelical Protestant adherents"
- #26 on the list of "Top 101 counties with the most Evangelical Protestant adherents (pop. 50,000+)"
- #27 on the list of "Top 101 counties with the best general health status score of residents (1-5), 3 years of data"
- #46 on the list of "Top 101 counties with the most Evangelical Protestant congregations"
- #46 on the list of "Top 101 counties with the most Evangelical Protestant congregations (pop. 50,000+)"
- #47 on the list of "Top 101 counties with the most Mainline Protestant adherents"
- #47 on the list of "Top 101 counties with the most Mainline Protestant adherents (pop. 50,000+)"
- #49 on the list of "Top 101 counties with the lowest number of deaths per 1000 residents 2007-2013"
- #62 on the list of "Top 101 counties with the highest surface withdrawal of fresh water for public supply (pop. 50,000+)"
- #64 on the list of "Top 101 counties with the highest surface withdrawal of fresh water for public supply"
- #68 on the list of "Top 101 counties with the most Orthodox adherents"
- #68 on the list of "Top 101 counties with the most Orthodox adherents (pop. 50,000+)"
- #70 on the list of "Top 101 counties with the lowest average weight of females"
- #84 on the list of "Top 101 counties with the most Orthodox congregations (pop. 50,000+)"
- #88 on the list of "Top 101 counties with the largest number of children under 18 without health insurance coverage in 2000"