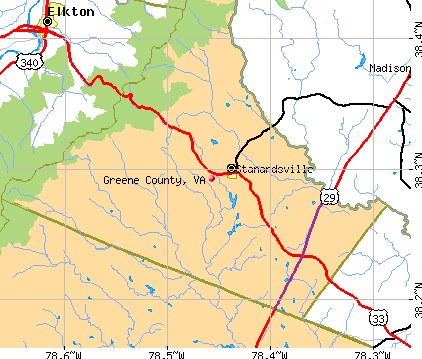
Greene County, Virginia (VA)
County owner-occupied free and clear houses and condos in 2010: 1,493
County owner-occupied houses and condos in 2000: 4,543
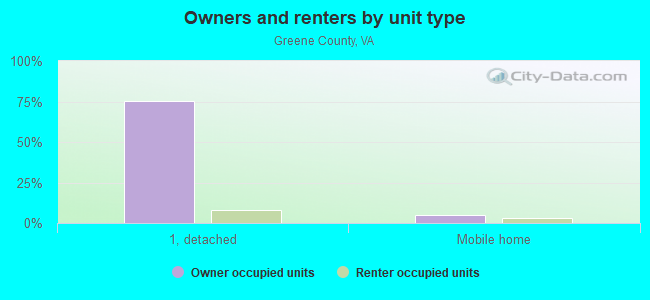
Renter-occupied apartments: 1,330 (it was 1,031 in 2000)
| % of renters here: | 18% |
| State: | 33% |
Land area: 157 sq. mi.
Water area: 0.4 sq. mi.
Population density: 133 people per square mile (average).
Industries providing employment: Educational, health and social services (24.1%), Retail trade (13.3%), Professional, scientific, management, administrative, and waste management services (10.7%).
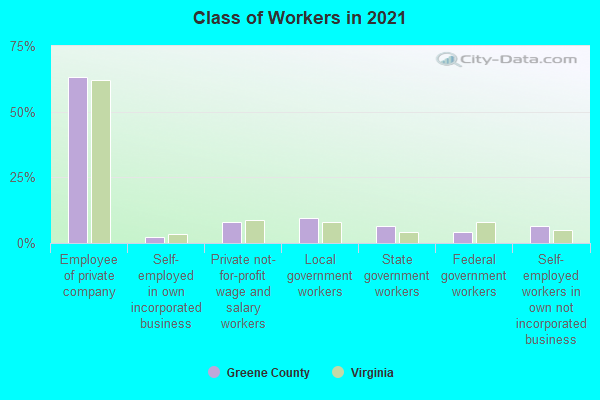
Type of workers:
- Private wage or salary: 73%
- Government: 21%
- Self-employed, not incorporated: 6%
- Unpaid family work: 0%
- OSM Map
- General Map
- Google Map
- MSN Map

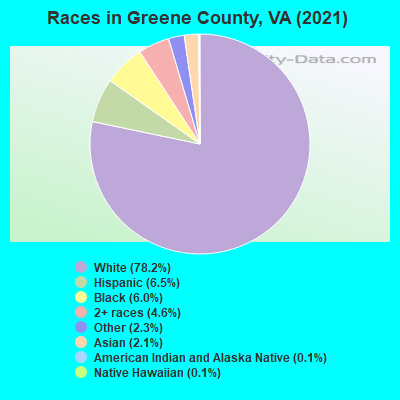
- 16,28778.7%White Non-Hispanic Alone
- 1,4286.9%Hispanic or Latino
- 1,3206.4%Black Non-Hispanic Alone
- 8314.0%Two or more races
- 4942.4%Asian alone
- 2881.4%Some other race alone
- 190.09%Native Hawaiian and Other
Pacific Islander alone - 180.09%American Indian and Alaska Native alone
| Median resident age: | 42.0 years |
| Virginia median age: | 39.0 years |
| Males: 9,930 | |
| Females: 10,842 |

 | Who can tell me about Ruckersville/Greene County? (5 replies) |
| To what extent is the affluence along Constitution Highway a product of DC Metro/NOVA money? (4 replies) |
| Residential warehouses? (7 replies) |
| Where to live? What about those great school scores? (18 replies) |
| Okay, just tell me where to live. (12 replies) |
| Any feedback on Greene County schools (1 reply) |
| Greene County: | 2.0 people |
| Virginia: | 3 people |
Estimated median household income in 2022: $80,055 ($45,931 in 1999)
| This county: | $80,055 |
| Virginia: | $85,873 |
Median contract rent in 2022 for apartments: $1,141 (lower quartile is $842, upper quartile is $1,410)
| This county: | $1141 |
| State: | $1270 |
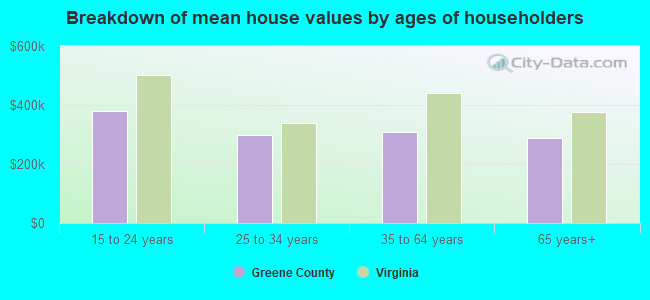
Estimated median house or condo value in 2022: $309,736 (it was $108,200 in 2000)
| Greene: | $309,736 |
| Virginia: | $365,700 |
Mean price in 2022:
Median monthly housing costs for homes and condos with a mortgage: $1,657Detached houses: $346,796
Here: $346,796 State: $472,865 Townhouses or other attached units: $246,700
Here: $246,700 State: $457,437 Mobile homes: $144,511
Here: $144,511 State: $100,736
Median monthly housing costs for units without a mortgage: $492
Institutionalized population: 128
Crime in 2021 (reported by the sheriff's office or county police, not the county total):
- Murders: 0
- Rapes: 4
- Robberies: 2
- Assaults: 20
- Burglaries: 12
- Thefts: 147
- Auto thefts: 13
Crime in 2020 (reported by the sheriff's office or county police, not the county total):
- Murders: 1
- Rapes: 1
- Robberies: 3
- Assaults: 15
- Burglaries: 11
- Thefts: 170
- Auto thefts: 9
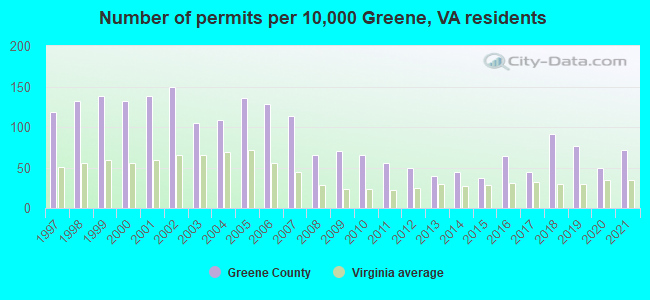
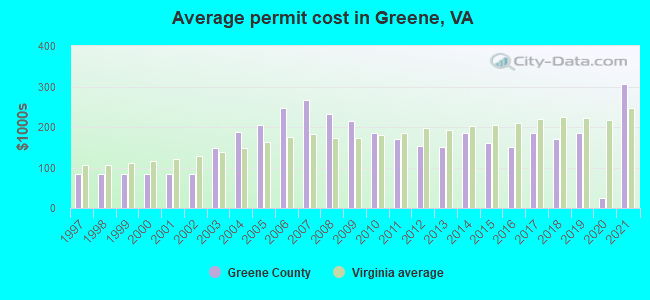
Single-family new house construction building permits:
- 2022: 113 buildings, average cost: $331,800
- 2021: 108 buildings, average cost: $306,200
- 2020: 75 buildings, average cost: $24,400
- 2019: 117 buildings, average cost: $185,900
- 2018: 139 buildings, average cost: $170,300
- 2017: 67 buildings, average cost: $185,800
- 2016: 98 buildings, average cost: $151,100
- 2015: 56 buildings, average cost: $160,400
- 2014: 68 buildings, average cost: $186,100
- 2013: 59 buildings, average cost: $150,200
- 2012: 76 buildings, average cost: $153,400
- 2011: 84 buildings, average cost: $171,000
- 2010: 99 buildings, average cost: $183,900
- 2009: 107 buildings, average cost: $214,300
- 2008: 101 buildings, average cost: $232,000
- 2007: 174 buildings, average cost: $267,400
- 2006: 196 buildings, average cost: $247,600
- 2005: 207 buildings, average cost: $205,200
- 2004: 166 buildings, average cost: $187,500
- 2003: 160 buildings, average cost: $148,600
- 2002: 227 buildings, average cost: $84,400
- 2001: 211 buildings, average cost: $84,400
- 2000: 201 buildings, average cost: $84,400
- 1999: 210 buildings, average cost: $84,400
- 1998: 201 buildings, average cost: $84,400
- 1997: 181 buildings, average cost: $84,400
Median real estate property taxes paid for housing units with mortgages in 2022: $1,862 (0.6%)
Median real estate property taxes paid for housing units with no mortgage in 2022: $1,885 (0.6%)
| Greene County: | 11.8% |
| Virginia: | 10.6% |
Median age of residents in 2022: 42.0 years old
(Males: 42.2 years old, Females: 41.5 years old)
(Median age for: White residents: 43.4 years old, Black residents: 44.2 years old, Asian residents: 48.2 years old, Hispanic or Latino residents: 25.2 years old, Other race residents: 25.9 years old)
Area name: Charlottesville, VA MSA
Fair market rent in 2006 for a 1-bedroom apartment in Greene County is $643 a month.
Fair market rent for a 2-bedroom apartment is $761 a month.
Fair market rent for a 3-bedroom apartment is $986 a month.
Cities in this county include: Twin Lakes, Ruckersville, Stanardsville.
Neighboring counties: Jackson County, West Virginia  , Lewis County, West Virginia
  , Gasconade County, Missouri , James City County
  .
.
| Here: | 2.2% |
| Virginia: | 2.7% |
Current college students: 492
People 25 years of age or older with a high school degree or higher: 89.3%
People 25 years of age or older with a bachelor's degree or higher: 27.9%
Number of foreign born residents: 965 (61.1% naturalized citizens)
| Greene County: | 4.6% |
| Whole state: | 12.7% |
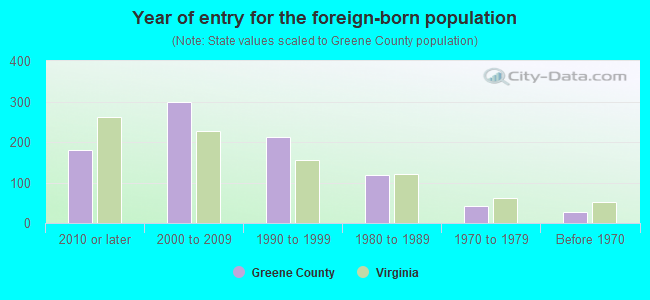
- Year of entry for the foreign-born population
- 2382010 or later
- 3552000 to 2009
- 2241990 to 1999
- 1181980 to 1989
- 421970 to 1979
- 27Before 1970
Mean travel time to work (commute): minutes
Percentage of county residents living and working in this county: 100.4%
Housing units in structures:
- One, detached: 7,136
- One, attached: 254
- Two: 21
- 3 or 4: 40
- 5 to 9: 221
- 10 to 19: 204
- 20 to 49: 33
- 50 or more: 51
- Mobile homes: 700
Housing units in Greene County with a mortgage: 4,008 (389 second mortgage, 0 home equity loan, 343 both second mortgage and home equity loan)
Houses without a mortgage: 117
| Here: | 3.3% with mortgage |
| State: | 97.2% with mortgage |
Religion statistics for Greene County
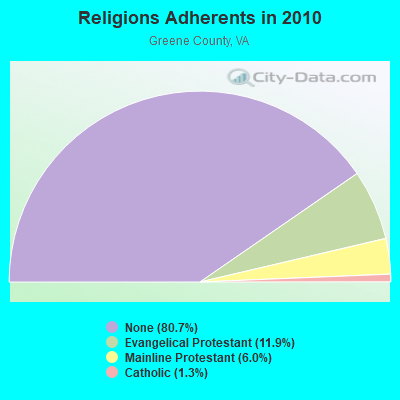
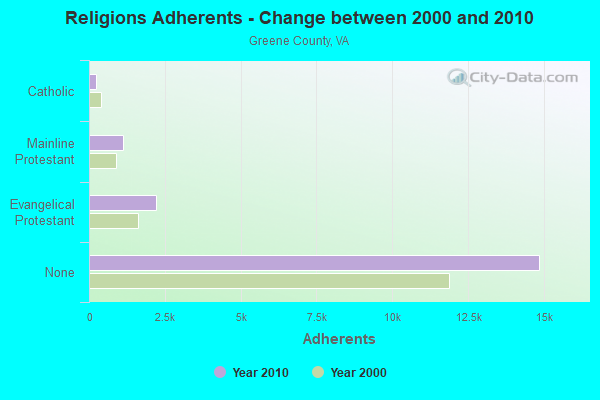
| Religion | Adherents | Congregations |
|---|---|---|
| Evangelical Protestant | 2,197 | 16 |
| Mainline Protestant | 1,111 | 8 |
| Catholic | 239 | 1 |
| Other | 5 | 1 |
| None | 14,851 | - |
Source: Clifford Grammich, Kirk Hadaway, Richard Houseal, Dale E.Jones, Alexei Krindatch, Richie Stanley and Richard H.Taylor. 2012. 2010 U.S.Religion Census: Religious Congregations & Membership Study. Association of Statisticians of American Religious Bodies. Jones, Dale E., et al. 2002. Congregations and Membership in the United States 2000. Nashville, TN: Glenmary Research Center.
Food Environment Statistics:
| Greene County: | 1.68 / 10,000 pop. |
| State: | 2.03 / 10,000 pop. |
| This county: | 0.56 / 10,000 pop. |
| Virginia: | 1.43 / 10,000 pop. |
| Greene County: | 3.93 / 10,000 pop. |
| Virginia: | 4.03 / 10,000 pop. |
| This county: | 5.05 / 10,000 pop. |
| State: | 7.65 / 10,000 pop. |
| Greene County: | 8.4% |
| Virginia: | 9.3% |
| Greene County: | 27.4% |
| State: | 26.7% |
| Here: | 5.9% |
| State: | 18.6% |
Agriculture in Greene County:
Average size of farms: 152 acresAverage value of agricultural products sold per farm: $27,172
Average value of crops sold per acre for harvested cropland: $102.10
The value of nursery, greenhouse, floriculture, and sod as a percentage of the total market value of agricultural products sold: 3.89%
The value of livestock, poultry, and their products as a percentage of the total market value of agricultural products sold: 85.75%
Average total farm production expenses per farm: $20,684
Harvested cropland as a percentage of land in farms: 24.90%
Average market value of all machinery and equipment per farm: $39,735
The percentage of farms operated by a family or individual: 86.92%
Average age of principal farm operators: 61 years
Average number of cattle and calves per 100 acres of all land in farms: 26.59
Milk cows as a percentage of all cattle and calves: 5.20%
Corn for grain: 282 harvested acres
Vegetables: 14 harvested acres
Land in orchards: 83 acres
Earthquake activity:
Greene County-area historical earthquake activity is significantly above Virginia state average. It is 47% smaller than the overall U.S. average.On 8/23/2011 at 17:51:04, a magnitude 5.8 (5.8 MW, Depth: 3.7 mi, Class: Moderate, Intensity: VI - VII) earthquake occurred 38.8 miles away from Greene County center
On 8/25/2011 at 05:07:52, a magnitude 4.5 (4.5 ML, Depth: 4.2 mi, Class: Light, Intensity: IV - V) earthquake occurred 35.8 miles away from the county center
On 12/9/2003 at 20:59:18, a magnitude 4.5 (4.5 ML, Depth: 6.2 mi) earthquake occurred 40.8 miles away from the county center
On 12/9/2003 at 20:59:14, a magnitude 4.5 (4.5 MB, 4.5 LG) earthquake occurred 57.4 miles away from the county center
On 8/9/2020 at 12:07:37, a magnitude 5.1 (5.1 MW, Depth: 4.7 mi) earthquake occurred 191.7 miles away from Greene County center
On 8/24/2011 at 00:04:36, a magnitude 4.2 (4.2 ML) earthquake occurred 37.8 miles away from the county center
Magnitude types: regional Lg-wave magnitude (LG), body-wave magnitude (MB), local magnitude (ML), moment magnitude (MW)
Most recent natural disasters:
- Virginia Covid-19 Pandemic, Incident Period: January 20, 2020, Major Disaster (Presidential) Declared DR-4512-VA: April 2, 2020, FEMA Id: 4512, Natural disaster type: Other
- Virginia Severe Winter Storm And Snowstorm, Incident Period: January 22, 2016 to January 23, 2016, Major Disaster (Presidential) Declared DR-4262: March 07, 2016, FEMA Id: 4262, Natural disaster type: Snowstorm, Winter Storm
- Virginia Hurricane Sandy, Incident Period: October 26, 2012 to November 01, 2012, Emergency Declared EM-3359: October 29, 2012, FEMA Id: 3359, Natural disaster type: Hurricane
- Virginia Severe Storms and Straight-line Winds, Incident Period: June 29, 2012 to July 01, 2012, Major Disaster (Presidential) Declared DR-4072: July 27, 2012, FEMA Id: 4072, Natural disaster type: Storm, Wind
- Virginia Severe Winter Storms and Snowstorms, Incident Period: February 05, 2010 to February 11, 2010, Major Disaster (Presidential) Declared DR-1905: April 27, 2010, FEMA Id: 1905, Natural disaster type: Snowstorm, Winter Storm
- Virginia Severe Winter Storm and Snowstorm, Incident Period: December 18, 2009 to December 20, 2009, Major Disaster (Presidential) Declared DR-1874: February 16, 2010, FEMA Id: 1874, Natural disaster type: Snowstorm, Winter Storm
- Virginia Hurricane Katrina Evacuation, Incident Period: August 29, 2005 to October 01, 2005, Emergency Declared EM-3240: September 12, 2005, FEMA Id: 3240, Natural disaster type: Hurricane
- Virginia Hurricane Isabel, Incident Period: September 18, 2003 to October 01, 2003, Major Disaster (Presidential) Declared DR-1491: September 18, 2003, FEMA Id: 1491, Natural disaster type: Hurricane
- Virginia Winter Storm, Incident Period: January 25, 2000 to January 30, 2000, Major Disaster (Presidential) Declared DR-1318: February 28, 2000, FEMA Id: 1318, Natural disaster type: Winter Storm
- Virginia Hurricane Fran, Incident Period: September 05, 1996 to September 23, 1996, Major Disaster (Presidential) Declared DR-1135: September 06, 1996, FEMA Id: 1135, Natural disaster type: Hurricane
- 10 other natural disasters have been reported since 1953.
The number of natural disasters in Greene County (20) is greater than the US average (15).
Major Disasters (Presidential) Declared: 16
Emergencies Declared: 4
Causes of natural disasters: Storms: 6, Winter Storms: 6, Floods: 5, Hurricanes: 4, Snowstorms: 3, Blizzard: 1, Drought: 1, Ice Storm: 1, Tropical Storm: 1, Wind: 1, Other: 1 (Note: some incidents may be assigned to more than one category).
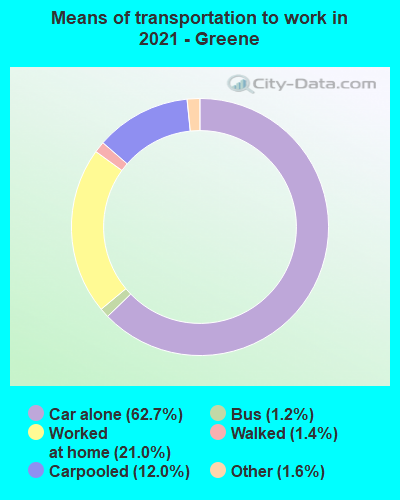
Means of transportation to work:
- Drove a car alone: 2,953 (56.5%)
- Carpooled: 607 (11.6%)
- Bus: 67 (1.3%)
- Taxicab, motorcycle, or other means: 67 (1.3%)
- Bicycle: 13 (0.2%)
- Walked: 143 (2.7%)
- Worked at home: 1,547 (29.6%)
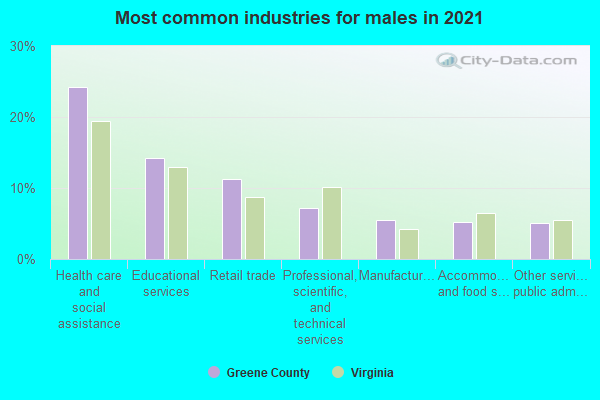
- Health care and social assistance (23%)
- Educational services (13%)
- Retail trade (12%)
- Professional, scientific, and technical services (7%)
- Accommodation and food services (5%)
- Other services, except public administration (5%)
- Manufacturing (4%)
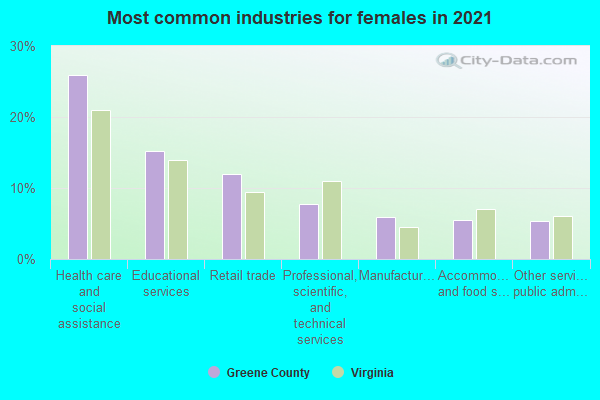
- Health care and social assistance (25%)
- Educational services (15%)
- Retail trade (13%)
- Professional, scientific, and technical services (8%)
- Accommodation and food services (6%)
- Other services, except public administration (5%)
- Manufacturing (5%)
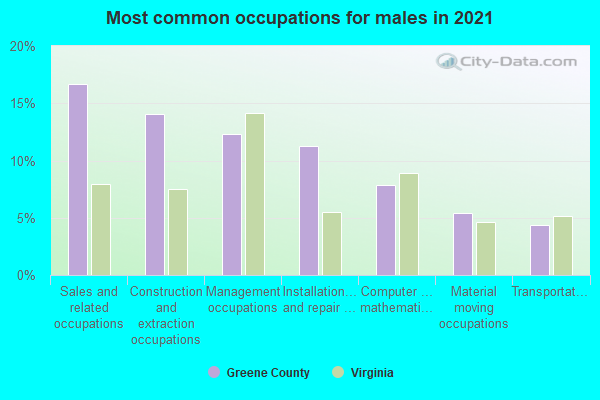
- Sales and related occupations (17%)
- Construction and extraction occupations (14%)
- Installation, maintenance, and repair occupations (11%)
- Management occupations (10%)
- Computer and mathematical occupations (8%)
- Production occupations (7%)
- Transportation occupations (5%)
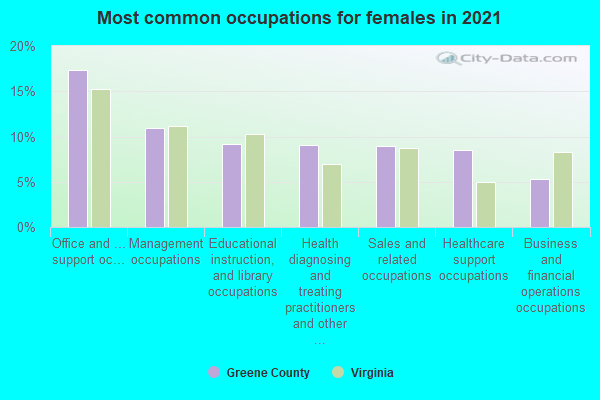
- Office and administrative support occupations (16%)
- Management occupations (11%)
- Sales and related occupations (10%)
- Educational instruction, and library occupations (10%)
- Health diagnosing and treating practitioners and other technical occupations (10%)
- Healthcare support occupations (9%)
- Business and financial operations occupations (5%)
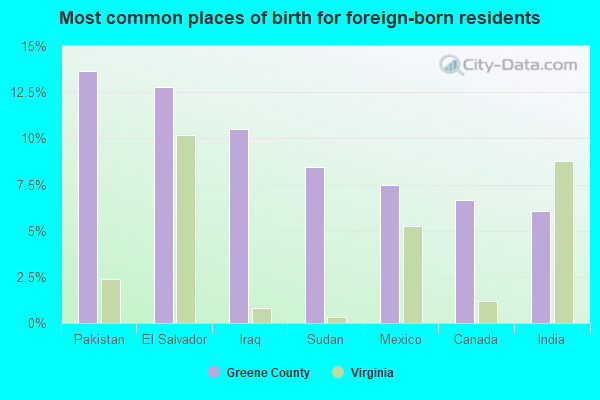
- El Salvador (20%)
- India (8%)
- Pakistan (8%)
- Iraq (8%)
- Sudan (8%)
- Other Eastern Europe (6%)
- Canada (5%)
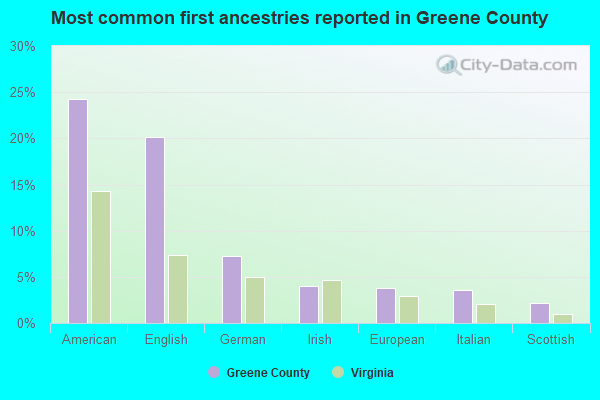
- American (22%)
- English (19%)
- German (6%)
- Irish (6%)
- European (4%)
- Italian (4%)
- Scottish (2%)
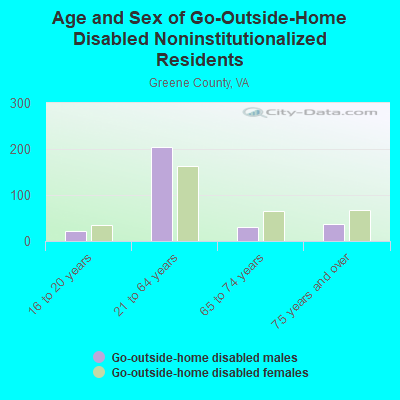
9 people in workers' group living quarters and job corps centers
People in group quarters in Greene County, Virginia in 2000:
- 102 people in nursing homes
- 27 people in other workers' dormitories
- 18 people in other noninstitutional group quarters
8.89% of this county's 2021 resident taxpayers lived in other counties in 2020 ($61,667 average adjusted gross income)
| Here: | 8.89% |
| Virginia average: | 10.16% |
10 or fewer of this county's residents moved from foreign countries.
6.81% relocated from other counties in Virginia ($45,782 average AGI)
2.07% relocated from other states ($15,886 average AGI)
Greene County: 2.07% Virginia average: 3.91%
Top counties from which taxpayers relocated into this county between 2020 and 2021:
| from Albemarle County, VA | |
| from Orange County, VA | |
| from Charlottesville city, VA | |
| from Madison County, VA |
7.85% of this county's 2020 resident taxpayers moved to other counties in 2021 ($60,834 average adjusted gross income)
| Here: | 7.85% |
| Virginia average: | 10.20% |
10 or fewer of this county's residents moved to foreign countries.
5.68% relocated to other counties in Virginia ($43,285 average AGI)
2.17% relocated to other states ($17,550 average AGI)
Greene County: 2.17% Virginia average: 3.98%
Top counties to which taxpayers relocated from this county between 2020 and 2021:
| to Albemarle County, VA | |
| to Orange County, VA | |
| to Charlottesville city, VA | |
| to Fluvanna County, VA | |
| to Louisa County, VA |
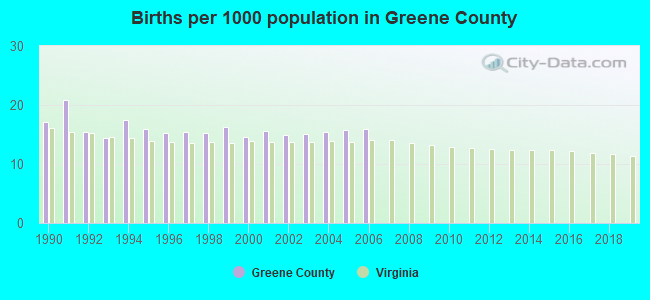
Births per 1000 population from 1990 to 1999: 16.4
Births per 1000 population from 2000 to 2006: 15.3
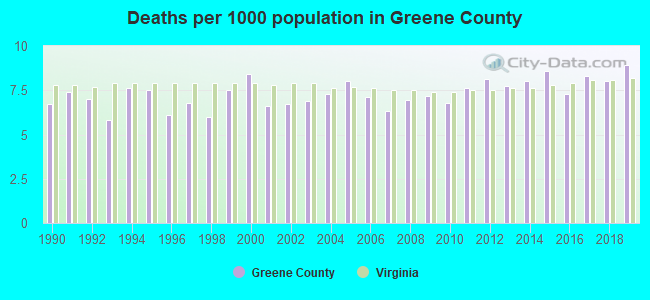
Deaths per 1000 population from 1990 to 1999: 6.8
Deaths per 1000 population from 2000 to 2009: 7.1
Deaths per 1000 population from 2010 to 2020: 8.0
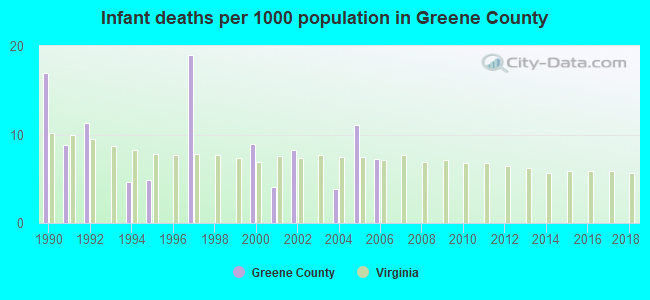
Infant deaths per 1000 live births from 1990 to 1999: 6.6
Infant deaths per 1000 live births from 2000 to 2006: 6.2
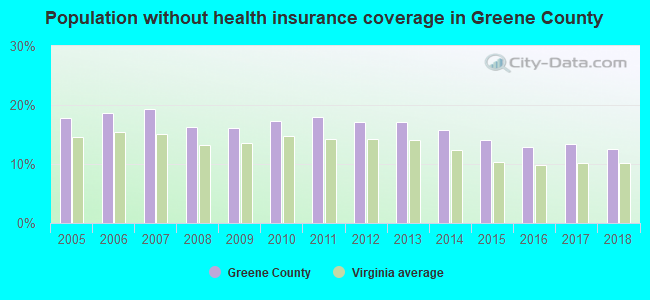
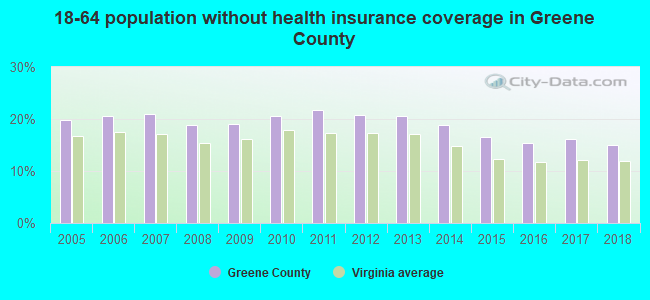
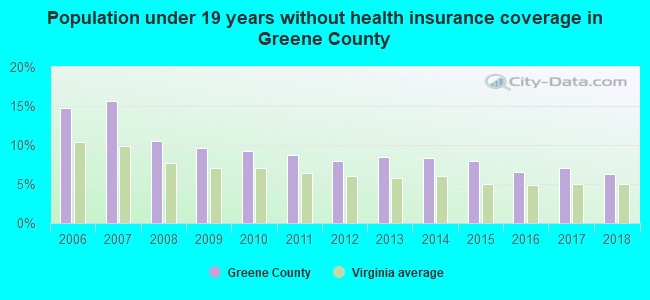
Persons under 19 years old without health insurance coverage in 2018: 6.3%
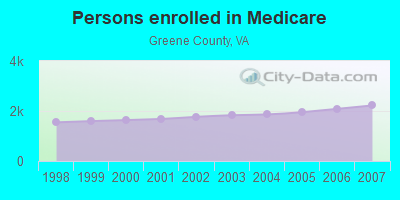
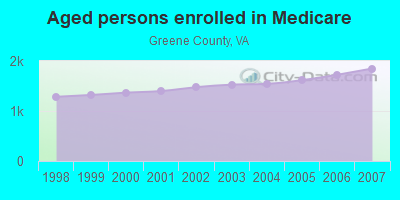
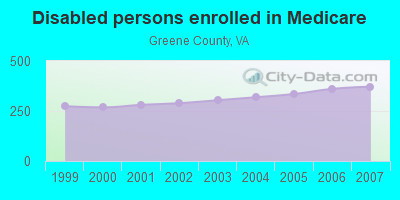
Persons enrolled in hospital insurance and/or supplemental medical insurance (Medicare) in July 1, 2007: 2,222 (1,850 aged, 372 disabled)
Children under 18 without health insurance coverage in 2007: 723 (15%)
Most common underlying causes of death in Greene County, Virginia in 1999 - 2019:
- Alzheimer disease, unspecified (112)
- Bronchus or lung, unspecified - Malignant neoplasms (83)
- Acute myocardial infarction, unspecified (78)
- Unspecified dementia (70)
- Congestive heart failure (21)
- Chronic obstructive pulmonary disease, unspecified (10)
Population without health insurance coverage in 2000: 10%
Children under 18 without health insurance coverage in 2000: 7%
Medical specialist MDs per 100,000 population in 2005: 844
Dentists per 100,000 population in 1998: 6
Total deaths per 100,000 population, July 2005 - July 2006: 46
Limited-service eating places per 100,000 population in 2005 : 11
Household type by relationship:
Households: 20,772- Male householders: 4,349 (645 living alone), Female householders: 3,518 (898 living alone)
4,620 spouses (4,620 opposite-sex spouses), 592 unmarried partners, (582 opposite-sex unmarried partners), 5,908 children (5,372 natural, 112 adopted, 421 stepchildren), 472 grandchildren, 144 brothers or sisters, 357 parents, 24 foster children, 278 other relatives, 386 non-relatives
- In group quarters: 136
Size of family households: 2,757 2-persons, 1,147 3-persons, 1,002 4-persons, 531 5-persons, 210 6-persons, 236 7-or-more-persons.
Size of nonfamily households: 1,543 1-person, 377 2-persons, 68 3-persons.
3,023 married couples with children.
1,169 single-parent households (432 men, 737 women).
93.1% of residents of Greene speak English at home.
2.9% of residents speak Spanish at home (64% speak English very well, 11% speak English well, 9% speak English not well, 16% don't speak English at all).
2.7% of residents speak other Indo-European language at home (63% speak English very well, 26% speak English well, 11% speak English not well).
0.9% of residents speak Asian or Pacific Island language at home (22% speak English very well, 65% speak English well, 13% speak English not well).
0.3% of residents speak other language at home (100% speak English very well).
In fiscal year 2004:
Federal Government expenditure: $53,378,000 ($3,135 per capita)
Department of Defense expenditure: $2,941,000
Federal direct payments to individuals for retirement and disability: $30,665,000
Federal other direct payments to individuals: $10,644,000
Federal direct payments not to individuals: $159,000
Federal grants: $7,599,000
Federal procurement contracts: $2,148,000 ($0,000 Department of Defense)
Federal salaries and wages: $2,161,000 ($76,000 Department of Defense)
Federal Government direct loans: $897,000
Federal guaranteed/insured loans: $14,201,000
Federal Government insurance: $3,637,000
Population change from April 1, 2000 to July 1, 2005:
Births: 1,299| Here: | 75 per 1000 residents |
| State: | 70 per 1000 residents |
Deaths: 598
| Here: | 34 per 1000 residents |
| State: | 40 per 1000 residents |
Net international migration: +37
| Here: | +2 per 1000 residents |
| State: | +18 per 1000 residents |
Net internal migration: +1,467
| Here: | +84 per 1000 residents |
| State: | +14 per 1000 residents |
Total withdrawal of fresh water for public supply: 0.00 millions of gallons per day (all from surface)
| Here: | 6.8 |
| State: | 7.0 |
| Here: | 5.6 |
| State: | 4.3 |
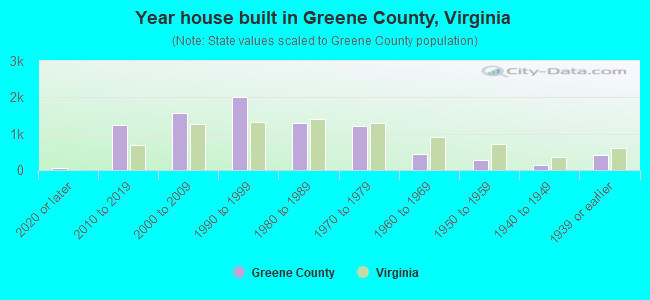
- Year house built in Greene County, Virginia
- 632020 or later
- 1,2112010 to 2019
- 1,8472000 to 2009
- 1,8791990 to 1999
- 1,3071980 to 1989
- 1,0441970 to 1979
- 4421960 to 1969
- 2861950 to 1959
- 1661940 to 1949
- 4221939 or earlier
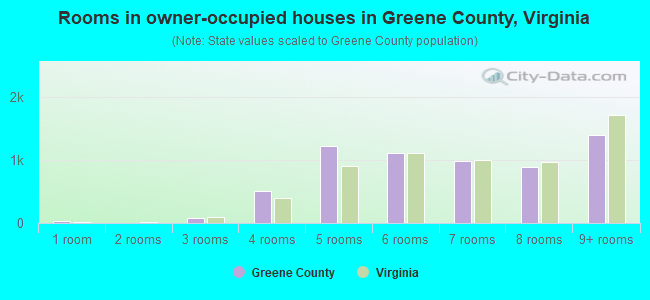
- Rooms in owner-occupied houses in Greene County, Virginia
- 51 room
- 02 rooms
- 493 rooms
- 5364 rooms
- 1,0995 rooms
- 1,0566 rooms
- 1,0567 rooms
- 9548 rooms
- 1,4439+ rooms
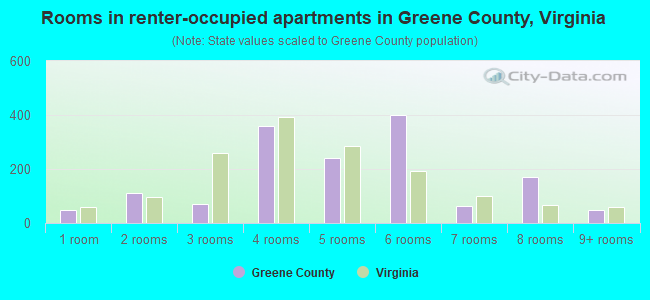
- Rooms in renter-occupied apartments in Greene County, Virginia
- 191 room
- 942 rooms
- 1003 rooms
- 2524 rooms
- 2955 rooms
- 4366 rooms
- 1647 rooms
- 2048 rooms
- 1079+ rooms
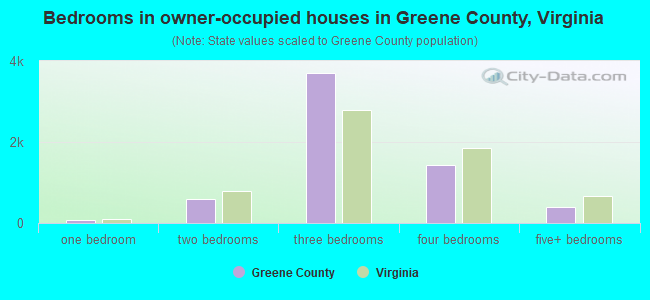
- Bedrooms in owner-occupied houses in Greene County, Virginia
- 5no bedroom
- 901 bedroom
- 5722 bedrooms
- 3,7213 bedrooms
- 1,3714 bedrooms
- 4485+ bedrooms
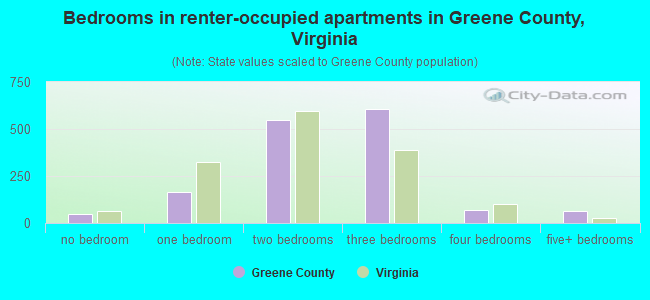
- Bedrooms in renter-occupied apartments in Greene County, Virginia
- 19no bedroom
- 1451 bedroom
- 4632 bedrooms
- 8763 bedrooms
- 804 bedrooms
- 945+ bedrooms
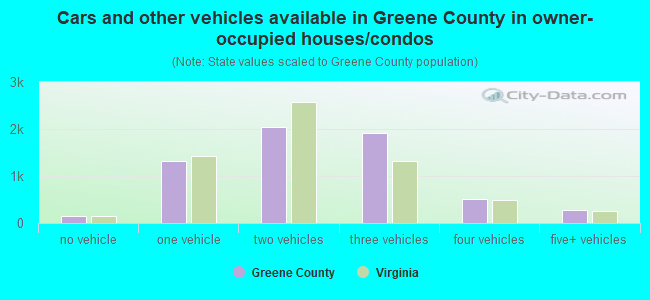
- Cars and other vehicles available in Greene County in owner-occupied houses/condos
- 136no vehicle
- 1,2091 vehicle
- 1,9832 vehicles
- 1,9643 vehicles
- 5244 vehicles
- 3605+ vehicles
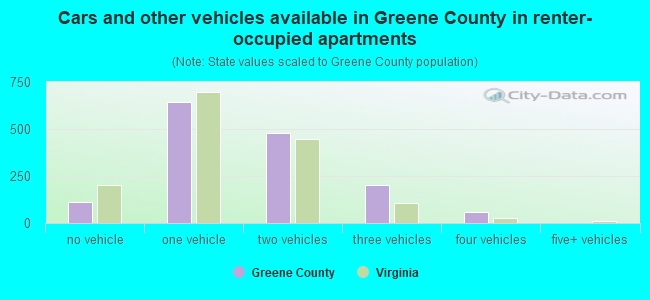
- Cars and other vehicles available in Greene County in renter-occupied apartments
- 33no vehicle
- 6211 vehicle
- 6112 vehicles
- 3343 vehicles
- 634 vehicles
- 05+ vehicles
89.7% of Greene County residents lived in the same house 1 years ago.
Out of people who lived in different houses, 22% lived in this county.
Out of people who lived in different counties, 80% lived in Virginia.
| Greene County: | 89.7% |
| State average: | 86.6% |
Place of birth for U.S.-born residents:
- This state: 11,301
- Other state: 7,897
- Northeast: 2,405
- Midwest: 1,428
- South: 2,926
- West: 1,142
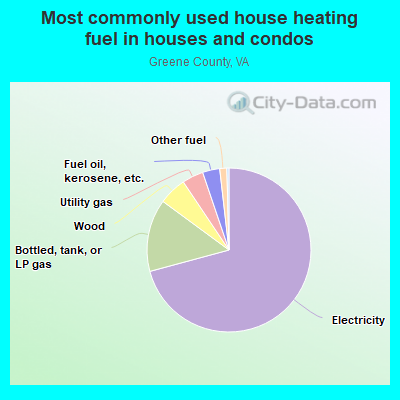
- 68.9%Electricity
- 13.4%Bottled, tank, or LP gas
- 6.6%Wood
- 5.9%Utility gas
- 3.8%Fuel oil, kerosene, etc.
- 0.9%Other fuel
- 0.4%Solar energy
- 0.2%No fuel used
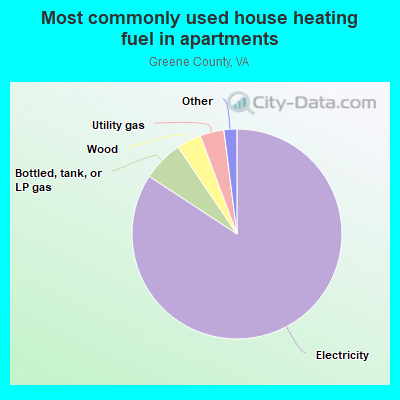
- 72.3%Electricity
- 12.1%Wood
- 11.3%Bottled, tank, or LP gas
- 2.5%Utility gas
- 1.0%No fuel used
- 0.7%Fuel oil, kerosene, etc.
Private vs. public school enrollment:
| Here: | 6.6% |
| Virginia: | 13.2% |
| Here: | 15.8% |
| Virginia: | 10.2% |
| Here: | 24.6% |
| Virginia: | 18.7% |
Greene County government finances - Expenditure in 2017:
- Bond Funds - Cash and Securities: $481,000
- Charges - Other: $2,447,000
Solid Waste Management: $1,713,000
Solid Waste Management: $869,000
Sewerage: $768,000
Elementary and Secondary Education School Lunch: $578,000
Elementary and Secondary Education School Tuition and Transportation: $276,000
Parks and Recreation: $68,000
Elementary and Secondary Education - Other: $63,000
Parks and Recreation: $35,000
Elementary and Secondary Education - Other: $26,000
Elementary and Secondary Education School Tuition and Transportation: $3,000
- Construction - Elementary and Secondary Education: $5,070,000
Elementary and Secondary Education: $3,799,000
- Current Operations - Elementary and Secondary Education: $34,662,000
Elementary and Secondary Education: $34,659,000
Police Protection: $3,543,000
Public Welfare - Other: $3,426,000
Police Protection: $3,355,000
Housing and Community Development: $2,118,000
Solid Waste Management: $1,848,000
Public Welfare - Other: $1,500,000
Local Fire Protection: $1,420,000
Solid Waste Management: $1,287,000
Health - Other: $1,216,000
Regular Highways: $1,177,000
Central Staff Services: $1,081,000
Judicial and Legal Services: $995,000
General - Other: $962,000
Local Fire Protection: $949,000
Financial Administration: $724,000
Central Staff Services: $707,000
General Public Buildings: $572,000
General - Other: $529,000
General Public Buildings: $511,000
Health - Other: $496,000
Financial Administration: $470,000
Judicial and Legal Services: $437,000
Libraries: $420,000
Protective Inspection and Regulation - Other: $374,000
Libraries: $370,000
Protective Inspection and Regulation - Other: $313,000
Parks and Recreation: $280,000
Parks and Recreation: $182,000
Natural Resources - Other: $15,000
- Federal Intergovernmental - Public Welfare: $802,000
Public Welfare: $597,000
Transit Utilities: $485,000
Highways: $410,000
Education: $289,000
Education: $216,000
Other: $83,000
General Local Government Support: $48,000
General Local Government Support: $37,000
- General - Interest on Debt: $2,804,000
Interest on Debt: $2,506,000
- Intergovernmental to Local - Other - Elementary and Secondary Education: $1,245,000
Other - Elementary and Secondary Education: $1,112,000
Other - Correctional Institutions: $806,000
- Local Intergovernmental - Education: $2,267,000
Education: $1,803,000
- Long Term Debt - Beginning Outstanding - Unspecified Public Purpose: $70,088,000
Outstanding Unspecified Public Purpose: $69,919,000
Beginning Outstanding - Unspecified Public Purpose: $46,556,000
Outstanding Unspecified Public Purpose: $35,197,000
Retired Unspecified Public Purpose: $18,477,000
Issue, Unspecified Public Purpose: $18,308,000
Retired Unspecified Public Purpose: $11,359,000
- Miscellaneous - Interest Earnings: $1,080,000
General Revenue - Other: $674,000
General Revenue - Other: $171,000
Interest Earnings: $116,000
Fines and Forfeits: $88,000
Fines and Forfeits: $84,000
Rents: $52,000
Rents: $36,000
Sale of Property: $3,000
Sale of Property: $3,000
Donations From Private Sources: $2,000
Donations From Private Sources: $1,000
- Other Capital Outlay - Elementary and Secondary Education: $998,000
Elementary and Secondary Education: $889,000
General - Other: $242,000
Water Utilities: $119,000
Correctional Institutions: $47,000
Sewerage: $46,000
Parks and Recreation: $16,000
- Other Funds - Cash and Securities: $17,751,000
Cash and Securities: $17,742,000
- Revenue - Water Utilities: $625,000
- Short Term Debt Outstanding - Beginning: $70,088,000
End of Fiscal Year: $69,919,000
- Sinking Funds - Cash and Securities: $1,916,000
- State Intergovernmental - Education: $21,676,000
Education: $20,523,000
General Local Government Support: $2,977,000
Other: $1,673,000
Public Welfare: $1,356,000
Public Welfare: $342,000
Transit Utilities: $215,000
Highways: $81,000
- Tax - Property: $22,582,000
Property: $19,868,000
General Sales and Gross Receipts: $2,483,000
General Sales and Gross Receipts: $1,894,000
Other License: $665,000
Occupation and Business License - Other: $511,000
Public Utilities Sales: $488,000
Motor Vehicle License: $456,000
Public Utilities Sales: $436,000
Other License: $248,000
Documentary and Stock Transfer: $248,000
Other Selective Sales: $5,000
- Total Salaries and Wages: $20,990,000
: $20,149,000
Greene County government finances - Revenue in 2017:
- Bond Funds - Cash and Securities: $481,000
- Charges - Other: $2,447,000
Solid Waste Management: $1,713,000
Solid Waste Management: $869,000
Sewerage: $768,000
Elementary and Secondary Education School Lunch: $578,000
Elementary and Secondary Education School Tuition and Transportation: $276,000
Parks and Recreation: $68,000
Elementary and Secondary Education - Other: $63,000
Parks and Recreation: $35,000
Elementary and Secondary Education - Other: $26,000
Elementary and Secondary Education School Tuition and Transportation: $3,000
- Construction - Elementary and Secondary Education: $5,070,000
Elementary and Secondary Education: $3,799,000
- Current Operations - Elementary and Secondary Education: $34,662,000
Elementary and Secondary Education: $34,659,000
Police Protection: $3,543,000
Public Welfare - Other: $3,426,000
Police Protection: $3,355,000
Housing and Community Development: $2,118,000
Solid Waste Management: $1,848,000
Public Welfare - Other: $1,500,000
Local Fire Protection: $1,420,000
Solid Waste Management: $1,287,000
Health - Other: $1,216,000
Regular Highways: $1,177,000
Central Staff Services: $1,081,000
Judicial and Legal Services: $995,000
General - Other: $962,000
Local Fire Protection: $949,000
Financial Administration: $724,000
Central Staff Services: $707,000
General Public Buildings: $572,000
General - Other: $529,000
General Public Buildings: $511,000
Health - Other: $496,000
Financial Administration: $470,000
Judicial and Legal Services: $437,000
Libraries: $420,000
Protective Inspection and Regulation - Other: $374,000
Libraries: $370,000
Protective Inspection and Regulation - Other: $313,000
Parks and Recreation: $280,000
Parks and Recreation: $182,000
Natural Resources - Other: $15,000
- Federal Intergovernmental - Public Welfare: $802,000
Public Welfare: $597,000
Transit Utilities: $485,000
Highways: $410,000
Education: $289,000
Education: $216,000
Other: $83,000
General Local Government Support: $48,000
General Local Government Support: $37,000
- General - Interest on Debt: $2,804,000
Interest on Debt: $2,506,000
- Intergovernmental to Local - Other - Elementary and Secondary Education: $1,245,000
Other - Elementary and Secondary Education: $1,112,000
Other - Correctional Institutions: $806,000
- Local Intergovernmental - Education: $2,267,000
Education: $1,803,000
- Long Term Debt - Beginning Outstanding - Unspecified Public Purpose: $70,088,000
Outstanding Unspecified Public Purpose: $69,919,000
Beginning Outstanding - Unspecified Public Purpose: $46,556,000
Outstanding Unspecified Public Purpose: $35,197,000
Retired Unspecified Public Purpose: $18,477,000
Issue, Unspecified Public Purpose: $18,308,000
Retired Unspecified Public Purpose: $11,359,000
- Miscellaneous - Interest Earnings: $1,080,000
General Revenue - Other: $674,000
General Revenue - Other: $171,000
Interest Earnings: $116,000
Fines and Forfeits: $88,000
Fines and Forfeits: $84,000
Rents: $52,000
Rents: $36,000
Sale of Property: $3,000
Sale of Property: $3,000
Donations From Private Sources: $2,000
Donations From Private Sources: $1,000
- Other Capital Outlay - Elementary and Secondary Education: $998,000
Elementary and Secondary Education: $889,000
General - Other: $242,000
Water Utilities: $119,000
Correctional Institutions: $47,000
Sewerage: $46,000
Parks and Recreation: $16,000
- Other Funds - Cash and Securities: $17,751,000
Cash and Securities: $17,742,000
- Revenue - Water Utilities: $625,000
- Short Term Debt Outstanding - Beginning: $70,088,000
End of Fiscal Year: $69,919,000
- Sinking Funds - Cash and Securities: $1,916,000
- State Intergovernmental - Education: $21,676,000
Education: $20,523,000
General Local Government Support: $2,977,000
Other: $1,673,000
Public Welfare: $1,356,000
Public Welfare: $342,000
Transit Utilities: $215,000
Highways: $81,000
- Tax - Property: $22,582,000
Property: $19,868,000
General Sales and Gross Receipts: $2,483,000
General Sales and Gross Receipts: $1,894,000
Other License: $665,000
Occupation and Business License - Other: $511,000
Public Utilities Sales: $488,000
Motor Vehicle License: $456,000
Public Utilities Sales: $436,000
Other License: $248,000
Documentary and Stock Transfer: $248,000
Other Selective Sales: $5,000
- Total Salaries and Wages: $20,990,000
: $20,149,000
Greene County government finances - Debt in 2017:
- Bond Funds - Cash and Securities: $481,000
- Charges - Other: $2,447,000
Solid Waste Management: $1,713,000
Solid Waste Management: $869,000
Sewerage: $768,000
Elementary and Secondary Education School Lunch: $578,000
Elementary and Secondary Education School Tuition and Transportation: $276,000
Parks and Recreation: $68,000
Elementary and Secondary Education - Other: $63,000
Parks and Recreation: $35,000
Elementary and Secondary Education - Other: $26,000
Elementary and Secondary Education School Tuition and Transportation: $3,000
- Construction - Elementary and Secondary Education: $5,070,000
Elementary and Secondary Education: $3,799,000
- Current Operations - Elementary and Secondary Education: $34,662,000
Elementary and Secondary Education: $34,659,000
Police Protection: $3,543,000
Public Welfare - Other: $3,426,000
Police Protection: $3,355,000
Housing and Community Development: $2,118,000
Solid Waste Management: $1,848,000
Public Welfare - Other: $1,500,000
Local Fire Protection: $1,420,000
Solid Waste Management: $1,287,000
Health - Other: $1,216,000
Regular Highways: $1,177,000
Central Staff Services: $1,081,000
Judicial and Legal Services: $995,000
General - Other: $962,000
Local Fire Protection: $949,000
Financial Administration: $724,000
Central Staff Services: $707,000
General Public Buildings: $572,000
General - Other: $529,000
General Public Buildings: $511,000
Health - Other: $496,000
Financial Administration: $470,000
Judicial and Legal Services: $437,000
Libraries: $420,000
Protective Inspection and Regulation - Other: $374,000
Libraries: $370,000
Protective Inspection and Regulation - Other: $313,000
Parks and Recreation: $280,000
Parks and Recreation: $182,000
Natural Resources - Other: $15,000
- Federal Intergovernmental - Public Welfare: $802,000
Public Welfare: $597,000
Transit Utilities: $485,000
Highways: $410,000
Education: $289,000
Education: $216,000
Other: $83,000
General Local Government Support: $48,000
General Local Government Support: $37,000
- General - Interest on Debt: $2,804,000
Interest on Debt: $2,506,000
- Intergovernmental to Local - Other - Elementary and Secondary Education: $1,245,000
Other - Elementary and Secondary Education: $1,112,000
Other - Correctional Institutions: $806,000
- Local Intergovernmental - Education: $2,267,000
Education: $1,803,000
- Long Term Debt - Beginning Outstanding - Unspecified Public Purpose: $70,088,000
Outstanding Unspecified Public Purpose: $69,919,000
Beginning Outstanding - Unspecified Public Purpose: $46,556,000
Outstanding Unspecified Public Purpose: $35,197,000
Retired Unspecified Public Purpose: $18,477,000
Issue, Unspecified Public Purpose: $18,308,000
Retired Unspecified Public Purpose: $11,359,000
- Miscellaneous - Interest Earnings: $1,080,000
General Revenue - Other: $674,000
General Revenue - Other: $171,000
Interest Earnings: $116,000
Fines and Forfeits: $88,000
Fines and Forfeits: $84,000
Rents: $52,000
Rents: $36,000
Sale of Property: $3,000
Sale of Property: $3,000
Donations From Private Sources: $2,000
Donations From Private Sources: $1,000
- Other Capital Outlay - Elementary and Secondary Education: $998,000
Elementary and Secondary Education: $889,000
General - Other: $242,000
Water Utilities: $119,000
Correctional Institutions: $47,000
Sewerage: $46,000
Parks and Recreation: $16,000
- Other Funds - Cash and Securities: $17,751,000
Cash and Securities: $17,742,000
- Revenue - Water Utilities: $625,000
- Short Term Debt Outstanding - Beginning: $70,088,000
End of Fiscal Year: $69,919,000
- Sinking Funds - Cash and Securities: $1,916,000
- State Intergovernmental - Education: $21,676,000
Education: $20,523,000
General Local Government Support: $2,977,000
Other: $1,673,000
Public Welfare: $1,356,000
Public Welfare: $342,000
Transit Utilities: $215,000
Highways: $81,000
- Tax - Property: $22,582,000
Property: $19,868,000
General Sales and Gross Receipts: $2,483,000
General Sales and Gross Receipts: $1,894,000
Other License: $665,000
Occupation and Business License - Other: $511,000
Public Utilities Sales: $488,000
Motor Vehicle License: $456,000
Public Utilities Sales: $436,000
Other License: $248,000
Documentary and Stock Transfer: $248,000
Other Selective Sales: $5,000
- Total Salaries and Wages: $20,990,000
: $20,149,000
Greene County government finances - Cash and Securities in 2017:
- Bond Funds - Cash and Securities: $481,000
- Charges - Other: $2,447,000
Solid Waste Management: $1,713,000
Solid Waste Management: $869,000
Sewerage: $768,000
Elementary and Secondary Education School Lunch: $578,000
Elementary and Secondary Education School Tuition and Transportation: $276,000
Parks and Recreation: $68,000
Elementary and Secondary Education - Other: $63,000
Parks and Recreation: $35,000
Elementary and Secondary Education - Other: $26,000
Elementary and Secondary Education School Tuition and Transportation: $3,000
- Construction - Elementary and Secondary Education: $5,070,000
Elementary and Secondary Education: $3,799,000
- Current Operations - Elementary and Secondary Education: $34,662,000
Elementary and Secondary Education: $34,659,000
Police Protection: $3,543,000
Public Welfare - Other: $3,426,000
Police Protection: $3,355,000
Housing and Community Development: $2,118,000
Solid Waste Management: $1,848,000
Public Welfare - Other: $1,500,000
Local Fire Protection: $1,420,000
Solid Waste Management: $1,287,000
Health - Other: $1,216,000
Regular Highways: $1,177,000
Central Staff Services: $1,081,000
Judicial and Legal Services: $995,000
General - Other: $962,000
Local Fire Protection: $949,000
Financial Administration: $724,000
Central Staff Services: $707,000
General Public Buildings: $572,000
General - Other: $529,000
General Public Buildings: $511,000
Health - Other: $496,000
Financial Administration: $470,000
Judicial and Legal Services: $437,000
Libraries: $420,000
Protective Inspection and Regulation - Other: $374,000
Libraries: $370,000
Protective Inspection and Regulation - Other: $313,000
Parks and Recreation: $280,000
Parks and Recreation: $182,000
Natural Resources - Other: $15,000
- Federal Intergovernmental - Public Welfare: $802,000
Public Welfare: $597,000
Transit Utilities: $485,000
Highways: $410,000
Education: $289,000
Education: $216,000
Other: $83,000
General Local Government Support: $48,000
General Local Government Support: $37,000
- General - Interest on Debt: $2,804,000
Interest on Debt: $2,506,000
- Intergovernmental to Local - Other - Elementary and Secondary Education: $1,245,000
Other - Elementary and Secondary Education: $1,112,000
Other - Correctional Institutions: $806,000
- Local Intergovernmental - Education: $2,267,000
Education: $1,803,000
- Long Term Debt - Beginning Outstanding - Unspecified Public Purpose: $70,088,000
Outstanding Unspecified Public Purpose: $69,919,000
Beginning Outstanding - Unspecified Public Purpose: $46,556,000
Outstanding Unspecified Public Purpose: $35,197,000
Retired Unspecified Public Purpose: $18,477,000
Issue, Unspecified Public Purpose: $18,308,000
Retired Unspecified Public Purpose: $11,359,000
- Miscellaneous - Interest Earnings: $1,080,000
General Revenue - Other: $674,000
General Revenue - Other: $171,000
Interest Earnings: $116,000
Fines and Forfeits: $88,000
Fines and Forfeits: $84,000
Rents: $52,000
Rents: $36,000
Sale of Property: $3,000
Sale of Property: $3,000
Donations From Private Sources: $2,000
Donations From Private Sources: $1,000
- Other Capital Outlay - Elementary and Secondary Education: $998,000
Elementary and Secondary Education: $889,000
General - Other: $242,000
Water Utilities: $119,000
Correctional Institutions: $47,000
Sewerage: $46,000
Parks and Recreation: $16,000
- Other Funds - Cash and Securities: $17,751,000
Cash and Securities: $17,742,000
- Revenue - Water Utilities: $625,000
- Short Term Debt Outstanding - Beginning: $70,088,000
End of Fiscal Year: $69,919,000
- Sinking Funds - Cash and Securities: $1,916,000
- State Intergovernmental - Education: $21,676,000
Education: $20,523,000
General Local Government Support: $2,977,000
Other: $1,673,000
Public Welfare: $1,356,000
Public Welfare: $342,000
Transit Utilities: $215,000
Highways: $81,000
- Tax - Property: $22,582,000
Property: $19,868,000
General Sales and Gross Receipts: $2,483,000
General Sales and Gross Receipts: $1,894,000
Other License: $665,000
Occupation and Business License - Other: $511,000
Public Utilities Sales: $488,000
Motor Vehicle License: $456,000
Public Utilities Sales: $436,000
Other License: $248,000
Documentary and Stock Transfer: $248,000
Other Selective Sales: $5,000
- Total Salaries and Wages: $20,990,000
: $20,149,000
Supplemental Security Income (SSI) in 2006:
- Total number of recipients: 235
- Number of aged recipients: 32
- Number of blind and disabled recipients: 203
- Number of recipients under 18: 45
- Number of recipients between 18 and 64: 119
- Number of recipients older than 64: 71
- Number of recipients also receiving OASDI: 99
- Amount of payments (thousands of dollars): 99
| Most common first names in Greene County, VA among deceased individuals | ||
| Name | Count | Lived (average) |
|---|---|---|
| James | 35 | 73.5 years |
| Mary | 35 | 77.1 years |
| William | 29 | 76.5 years |
| John | 28 | 70.2 years |
| Robert | 28 | 70.1 years |
| George | 25 | 76.0 years |
| Charles | 16 | 67.1 years |
| Dorothy | 12 | 74.8 years |
| Helen | 11 | 79.5 years |
| Thomas | 11 | 69.9 years |
| Most common last names in Greene County, VA among deceased individuals | ||
| Last name | Count | Lived (average) |
|---|---|---|
| Shifflett | 88 | 71.7 years |
| Morris | 74 | 75.6 years |
| Taylor | 54 | 75.9 years |
| Breeden | 30 | 68.2 years |
| Roach | 28 | 73.3 years |
| Conley | 27 | 69.8 years |
| Lamb | 27 | 76.4 years |
| Snow | 25 | 72.0 years |
| Deane | 22 | 78.1 years |
| Lawson | 21 | 73.1 years |
| Businesses in Greene County, VA | ||||
| Name | Count | Name | Count | |
|---|---|---|---|---|
| Advance Auto Parts | 1 | Lowe's | 1 | |
| Best Western | 1 | McDonald's | 1 | |
| Burger King | 1 | Papa John's Pizza | 1 | |
| CVS | 1 | Subway | 1 | |
| Curves | 1 | Taco Bell | 1 | |
| Dairy Queen | 1 | U-Haul | 2 | |
| Domino's Pizza | 2 | UPS | 1 | |
| FedEx | 2 | Walmart | 1 | |
| KFC | 1 | Wendy's | 1 | |
| Lane Furniture | 1 | |||