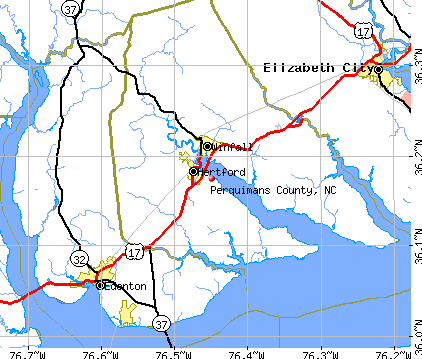
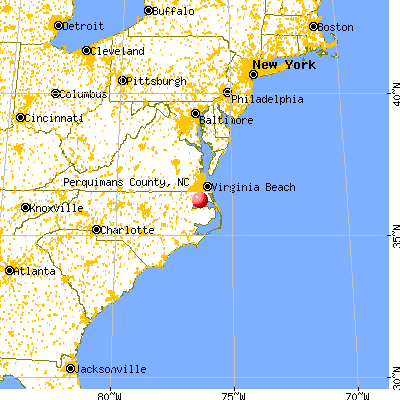
Perquimans County, North Carolina (NC)
County owner-occupied free and clear houses and condos in 2010: 1,663
County owner-occupied houses and condos in 2000: 3,651
Renter-occupied apartments: 1,360 (it was 994 in 2000)
| % of renters here: | 21% |
| State: | 33% |
Land area: 247 sq. mi.
Water area: 81.8 sq. mi.
Population density: 54 people per square mile (average).
Industries providing employment: Educational, health and social services (20.7%), Retail trade (11.6%), Manufacturing (11.2%).
Type of workers:
- Private wage or salary: 70%
- Government: 23%
- Self-employed, not incorporated: 6%
- Unpaid family work: 0%
- OSM Map
- General Map
- Google Map
- MSN Map

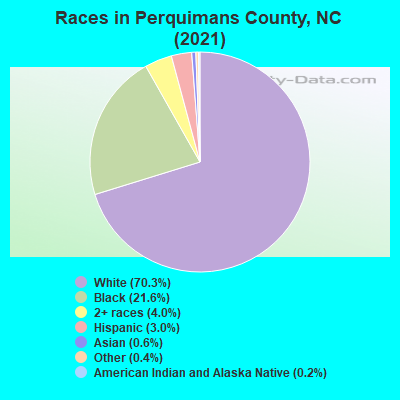
- 9,26870.0%White Non-Hispanic Alone
- 2,96922.4%Black Non-Hispanic Alone
- 5003.8%Two or more races
- 4403.3%Hispanic or Latino
- 580.4%Asian alone
- 30.02%Native Hawaiian and Other
Pacific Islander alone - 20.02%Some other race alone
- 10.01%American Indian and Alaska Native alone
| Median resident age: | 49.9 years |
| North Carolina median age: | 39.2 years |
| Males: 6,352 | |
| Females: 6,986 |

 | Road Construction/Projects in Coastal NC (429 replies) |
| Proposed I-795 Quad East loop (719 replies) |
| Coastal and Eastern NC projects included in NCDOT's draft 2018-2027 STIP (3 replies) |
| Looking to eventually retire to the coast (11 replies) |
| Help with home rentals in Perquimans County (0 replies) |
| hertford area (4 replies) |
| Perquimans County: | 2.0 people |
| North Carolina: | 2 people |
Estimated median household income in 2022: $60,563 ($29,538 in 1999)
| This county: | $60,563 |
| North Carolina: | $67,481 |
Median contract rent in 2022 for apartments: $674 (lower quartile is $491, upper quartile is $936)
| This county: | $674 |
| State: | $945 |
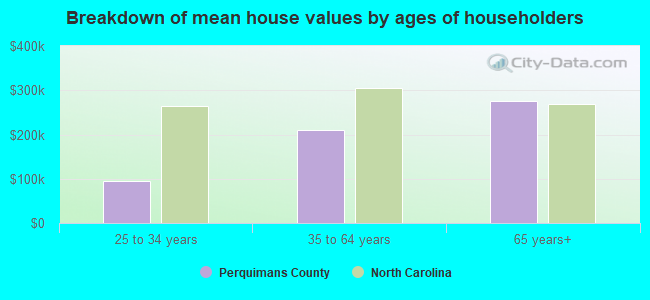
Estimated median house or condo value in 2022: $252,170 (it was $71,400 in 2000)
| Perquimans: | $252,170 |
| North Carolina: | $280,600 |
Median monthly housing costs for homes and condos with a mortgage: $1,421
Median monthly housing costs for units without a mortgage: $475
Institutionalized population: 72
Crime in 2021 (reported by the sheriff's office or county police, not the county total):
- Murders: 0
- Rapes: 3
- Robberies: 2
- Assaults: 13
- Burglaries: 14
- Thefts: 48
- Auto thefts: 4
Crime in 2018 (reported by the sheriff's office or county police, not the county total):
- Murders: 0
- Rapes: 0
- Robberies: 1
- Assaults: 8
- Burglaries: 38
- Thefts: 41
- Auto thefts: 3
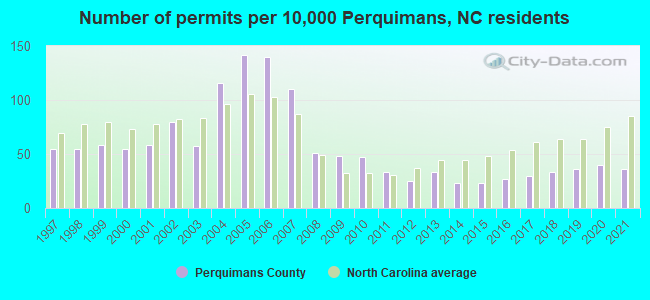
Single-family new house construction building permits:
- 2022: 46 buildings, average cost: $213,600
- 2021: 41 buildings, average cost: $217,500
- 2020: 45 buildings, average cost: $205,500
- 2019: 41 buildings, average cost: $205,500
- 2018: 38 buildings, average cost: $205,500
- 2017: 34 buildings, average cost: $205,500
- 2016: 31 buildings, average cost: $205,500
- 2015: 26 buildings, average cost: $205,500
- 2014: 26 buildings, average cost: $205,500
- 2013: 38 buildings, average cost: $231,300
- 2012: 28 buildings, average cost: $264,500
- 2011: 38 buildings, average cost: $239,400
- 2010: 53 buildings, average cost: $163,700
- 2009: 54 buildings, average cost: $219,300
- 2008: 58 buildings, average cost: $205,200
- 2007: 125 buildings, average cost: $224,200
- 2006: 159 buildings, average cost: $214,900
- 2005: 161 buildings, average cost: $204,400
- 2004: 132 buildings, average cost: $182,300
- 2003: 65 buildings, average cost: $189,300
- 2002: 91 buildings, average cost: $170,300
- 2001: 66 buildings, average cost: $189,000
- 2000: 63 buildings, average cost: $189,000
- 1999: 66 buildings, average cost: $164,900
- 1998: 63 buildings, average cost: $156,800
- 1997: 63 buildings, average cost: $118,100

Median real estate property taxes paid for housing units with mortgages in 2022: $1,481 (0.6%)
Median real estate property taxes paid for housing units with no mortgage in 2022: $1,015 (0.5%)


| Perquimans County: | 12.7% |
| North Carolina: | 12.8% |
Median age of residents in 2022: 49.9 years old
(Males: 49.7 years old, Females: 50.8 years old)
(Median age for: White residents: 53.1 years old, Black residents: 47.2 years old, Asian residents: 71.1 years old, Hispanic or Latino residents: 40.0 years old, Other race residents: 53.0 years old)
Fair market rent in 2006 for a 1-bedroom apartment in Perquimans County is $483 a month.
Fair market rent for a 2-bedroom apartment is $570 a month.
Fair market rent for a 3-bedroom apartment is $770 a month.
Neighboring counties: Ashe County  , Cocke County, Tennessee , Johnson County, Tennessee , Putnam County, Tennessee , Williamson County, Tennessee .
| Here: | 3.8% |
| North Carolina: | 3.2% |


Current college students: 343
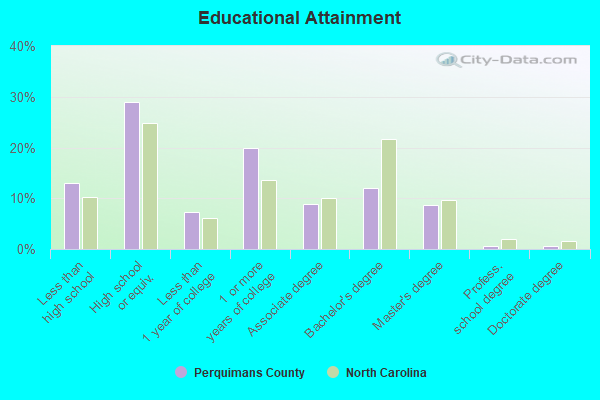
People 25 years of age or older with a high school degree or higher: 86.4%
People 25 years of age or older with a bachelor's degree or higher: 19.6%
Number of foreign born residents: 314 (65.4% naturalized citizens)
| Perquimans County: | 2.4% |
| Whole state: | 8.6% |
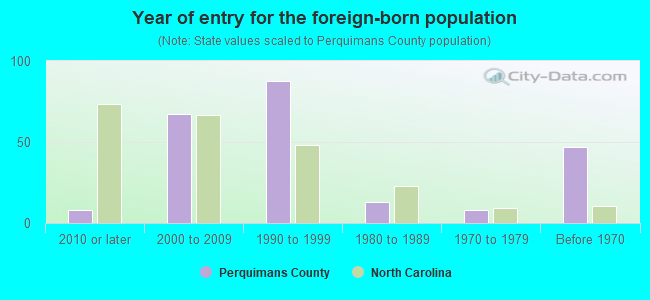
- Year of entry for the foreign-born population
- 92010 or later
- 582000 to 2009
- 1081990 to 1999
- 131980 to 1989
- 81970 to 1979
- 47Before 1970
Mean travel time to work (commute): $ minutes
Percentage of county residents living and working in this county: 79.2%
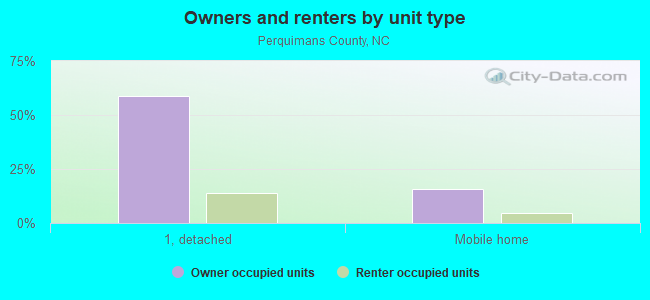
Housing units in structures:
- One, detached: 4,961
- One, attached: 14
- Two: 89
- 3 or 4: 148
- 5 to 9: 31
- 10 to 19: 37
- 20 or more: 85
- Mobile homes: 1,634
- Boats, RVs, vans, etc.: 38
Housing units in Perquimans County with a mortgage: 2,530 (270 second mortgage, 0 home equity loan, 267 both second mortgage and home equity loan)
Houses without a mortgage: 79
| Here: | 2.5% with mortgage |
| State: | 97.0% with mortgage |
Religion statistics for Perquimans County
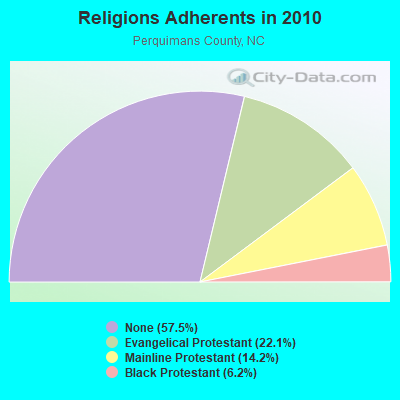
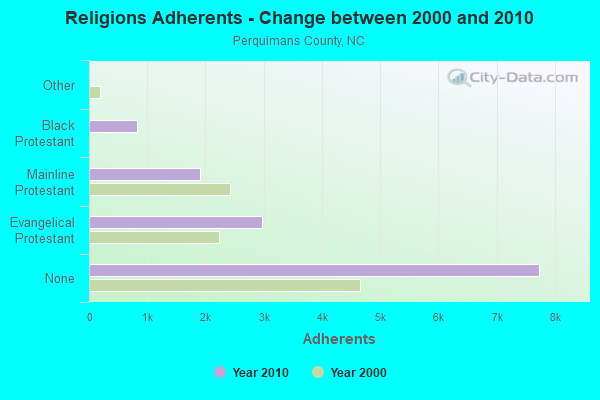
| Religion | Adherents | Congregations |
|---|---|---|
| Evangelical Protestant | 2,974 | 19 |
| Mainline Protestant | 1,911 | 12 |
| Black Protestant | 831 | 8 |
| Other | 2 | 1 |
| None | 7,735 | - |
Source: Clifford Grammich, Kirk Hadaway, Richard Houseal, Dale E.Jones, Alexei Krindatch, Richie Stanley and Richard H.Taylor. 2012. 2010 U.S.Religion Census: Religious Congregations & Membership Study. Association of Statisticians of American Religious Bodies. Jones, Dale E., et al. 2002. Congregations and Membership in the United States 2000. Nashville, TN: Glenmary Research Center.
Food Environment Statistics:
| Perquimans County: | 2.40 / 10,000 pop. |
| State: | 2.05 / 10,000 pop. |
| This county: | 3.20 / 10,000 pop. |
| North Carolina: | 0.92 / 10,000 pop. |
| Perquimans County: | 0.80 / 10,000 pop. |
| North Carolina: | 4.75 / 10,000 pop. |
| This county: | 6.40 / 10,000 pop. |
| State: | 7.57 / 10,000 pop. |
| Perquimans County: | 11.1% |
| North Carolina: | 9.8% |
| Perquimans County: | 31.4% |
| State: | 28.3% |
| Here: | 17.4% |
| State: | 15.6% |
Agriculture in Perquimans County:
Average size of farms: 489 acresAverage value of agricultural products sold per farm: $199,192
Average value of crops sold per acre for harvested cropland: $274.11
The value of nursery, greenhouse, floriculture, and sod as a percentage of the total market value of agricultural products sold: 0.00%
The value of livestock, poultry, and their products as a percentage of the total market value of agricultural products sold: 38.94%
Average total farm production expenses per farm: $183,236
Harvested cropland as a percentage of land in farms: 90.66%
Average market value of all machinery and equipment per farm: $143,434
The percentage of farms operated by a family or individual: 84.46%
Average age of principal farm operators: 50 years
Average number of cattle and calves per 100 acres of all land in farms: 0.94
Corn for grain: 16642 harvested acres
All wheat for grain: 11768 harvested acres
Upland cotton: 26784 harvested acres
Soybeans for beans: 36364 harvested acres
Vegetables: 494 harvested acres
Earthquake activity:
Perquimans County-area historical earthquake activity is significantly above North Carolina state average. It is 64% smaller than the overall U.S. average.On 8/23/2011 at 17:51:04, a magnitude 5.8 (5.8 MW, Depth: 3.7 mi, Class: Moderate, Intensity: VI - VII) earthquake occurred 145.4 miles away from Perquimans County center
On 12/9/2003 at 20:59:14, a magnitude 4.5 (4.5 MB, 4.5 LG, Class: Light, Intensity: IV - V) earthquake occurred 126.6 miles away from the county center
On 8/9/2020 at 12:07:37, a magnitude 5.1 (5.1 MW, Depth: 4.7 mi) earthquake occurred 259.6 miles away from the county center
On 12/9/2003 at 20:59:18, a magnitude 4.5 (4.5 ML, Depth: 6.2 mi) earthquake occurred 143.4 miles away from the county center
On 8/25/2011 at 05:07:52, a magnitude 4.5 (4.5 ML, Depth: 4.2 mi) earthquake occurred 148.5 miles away from Perquimans County center
On 1/15/2019 at 23:30:48, a magnitude 4.6 (4.6 MW, Depth: 6.2 mi) earthquake occurred 204.3 miles away from the county center
Magnitude types: regional Lg-wave magnitude (LG), body-wave magnitude (MB), local magnitude (ML), moment magnitude (MW)
Most recent natural disasters:
- North Carolina Severe Storms, Tornadoes, And Flooding, Incident Period: February 6, 2020 - February 19, 2020, FEMA Id: 4543, Natural disaster type: Storm, Tornado, Flood
- North Carolina Covid-19 Pandemic, Incident Period: January 20, 2020, FEMA Id: 4487, Natural disaster type: Other
- North Carolina Hurricane Dorian, Incident Period: September 1, 2019 - September 9, 2019, FEMA Id: 4465, Natural disaster type: Hurricane
- North Carolina Hurricane Matthew, Incident Period: October 04, 2016 to October 24, 2016, Emergency Declared EM-3380: October 07, 2016, FEMA Id: 3380, Natural disaster type: Hurricane
- North Carolina Hurricane Matthew, Incident Period: October 04, 2016 to October 24, 2016, Major Disaster (Presidential) Declared DR-4285: October 10, 2016, FEMA Id: 4285, Natural disaster type: Hurricane
- North Carolina Hurricane Irene, Incident Period: August 25, 2011 to September 01, 2011, Emergency Declared EM-3327: August 25, 2011, FEMA Id: 3327, Natural disaster type: Hurricane
- North Carolina Hurricane Irene, Incident Period: August 25, 2011 to September 01, 2011, Major Disaster (Presidential) Declared DR-4019: August 31, 2011, FEMA Id: 4019, Natural disaster type: Hurricane
- North Carolina Hurricane Earl, Incident Period: September 01, 2010 to September 04, 2010, Emergency Declared EM-3314: September 01, 2010, FEMA Id: 3314, Natural disaster type: Hurricane
- North Carolina Hurricane Ophelia, Incident Period: September 11, 2005 to September 17, 2005, Emergency Declared EM-3254: September 14, 2005, FEMA Id: 3254, Natural disaster type: Hurricane
- North Carolina Hurricane Katrina Evacuation, Incident Period: August 29, 2005 to October 01, 2005, Emergency Declared EM-3222: September 05, 2005, FEMA Id: 3222, Natural disaster type: Hurricane
- 6 other natural disasters have been reported since 1953.
The number of natural disasters in Perquimans County (16) is near the US average (15).
Major Disasters (Presidential) Declared: 7
Emergencies Declared: 6
Causes of natural disasters: Hurricanes: 12, Storms: 2, Tornadoes: 2, Flood: 1, Ice Storm: 1, Other: 1 (Note: some incidents may be assigned to more than one category).
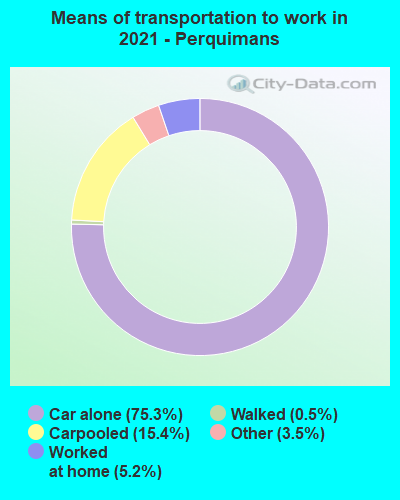
Means of transportation to work:
- Drove a car alone: 2,260 (71.8%)
- Carpooled: 358 (11.4%)
- Bus: 4 (0.1%)
- Taxicab, motorcycle, or other means: 99 (3.1%)
- Bicycle: 2 (0.1%)
- Walked: 22 (0.7%)
- Worked at home: 359 (11.4%)


- Health care and social assistance (16%)
- Accommodation and food services (12%)
- Educational services (9%)
- Retail trade (9%)
- Public administration (8%)
- Finance and insurance (6%)
- Other services, except public administration (5%)
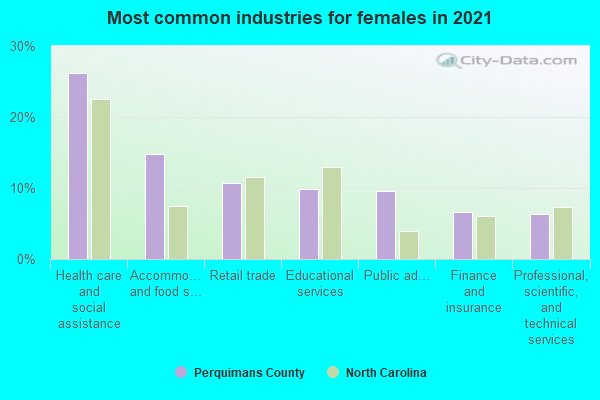
- Health care and social assistance (20%)
- Accommodation and food services (15%)
- Educational services (12%)
- Retail trade (11%)
- Public administration (10%)
- Finance and insurance (7%)
- Other services, except public administration (6%)
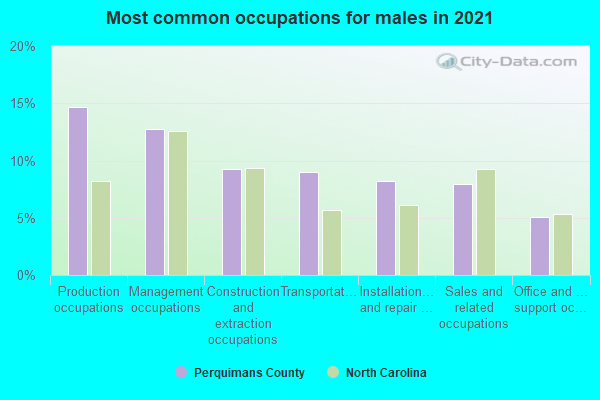
- Production occupations (13%)
- Management occupations (12%)
- Construction and extraction occupations (11%)
- Installation, maintenance, and repair occupations (9%)
- Sales and related occupations (8%)
- Building and grounds cleaning and maintenance occupations (6%)
- Transportation occupations (6%)
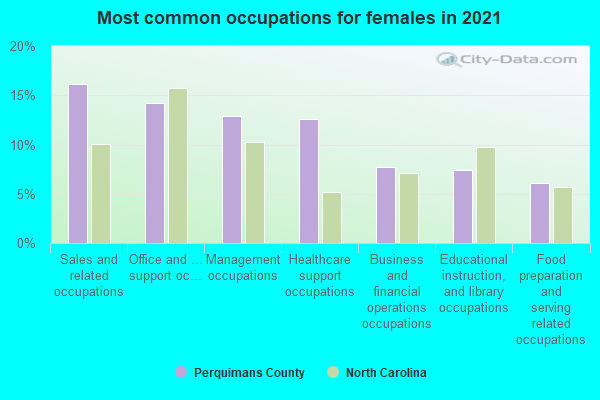
- Office and administrative support occupations (18%)
- Management occupations (14%)
- Sales and related occupations (13%)
- Healthcare support occupations (8%)
- Educational instruction, and library occupations (8%)
- Food preparation and serving related occupations (7%)
- Business and financial operations occupations (6%)
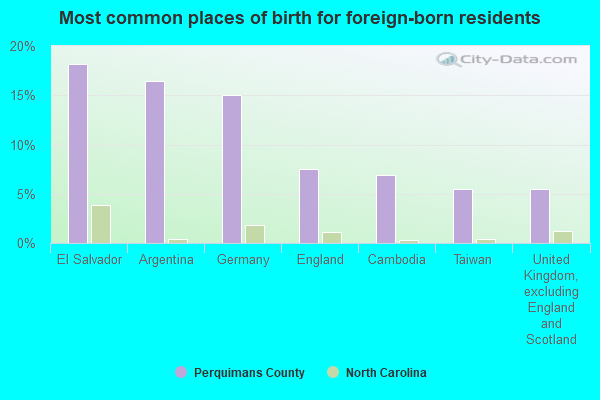
- El Salvador (16%)
- Argentina (15%)
- Germany (15%)
- Other Australian and New Zealand Subregion (12%)
- Taiwan (10%)
- Mexico (10%)
- United Kingdom, excluding England and Scotland (7%)

- English (23%)
- American (20%)
- Irish (8%)
- Italian (5%)
- German (3%)
- Scotch-Irish (1%)
- Scottish (1%)
People in group quarters in Perquimans County, North Carolina in 2010:
- 62 people in nursing facilities/skilled-nursing facilities
- 12 people in workers' group living quarters and job corps centers
- 10 people in correctional facilities intended for juveniles
People in group quarters in Perquimans County, North Carolina in 2000:
- 108 people in nursing homes
- 6 people in other group homes
- 6 people in other nonhousehold living situations
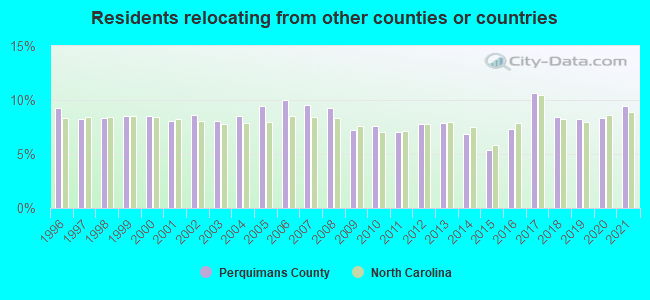
9.46% of this county's 2021 resident taxpayers lived in other counties in 2020 ($57,536 average adjusted gross income)
| Here: | 9.46% |
| North Carolina average: | 8.85% |
10 or fewer of this county's residents moved from foreign countries.
5.60% relocated from other counties in North Carolina ($28,146 average AGI)
3.86% relocated from other states ($29,389 average AGI)
Perquimans County: 3.86% North Carolina average: 4.18%
Top counties from which taxpayers relocated into this county between 2020 and 2021:
| from Pasquotank County, NC | |
| from Chowan County, NC | |
| from Chesapeake city, VA |
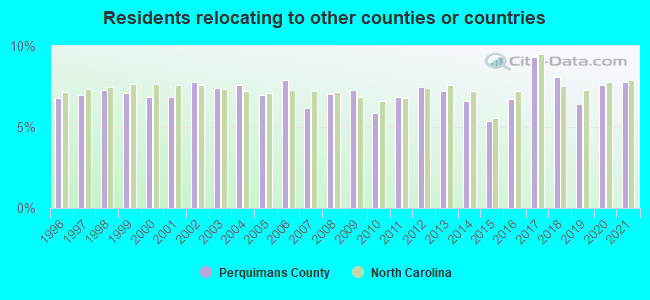
7.76% of this county's 2020 resident taxpayers moved to other counties in 2021 ($52,187 average adjusted gross income)
| Here: | 7.76% |
| North Carolina average: | 7.89% |
10 or fewer of this county's residents moved to foreign countries.
5.00% relocated to other counties in North Carolina ($30,647 average AGI)
2.76% relocated to other states ($21,543 average AGI)
Perquimans County: 2.76% North Carolina average: 3.18%
Top counties to which taxpayers relocated from this county between 2020 and 2021:
| to Pasquotank County, NC | |
| to Chowan County, NC |
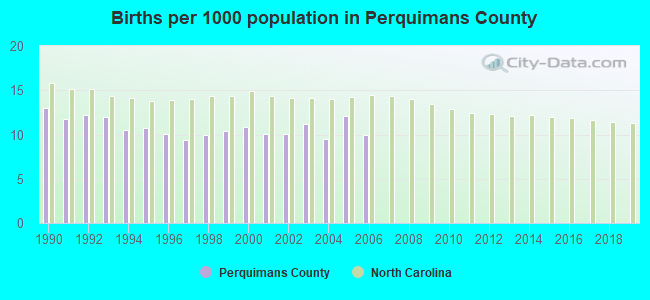
Births per 1000 population from 1990 to 1999: 11.0
Births per 1000 population from 2000 to 2006: 10.6
Deaths per 1000 population from 1990 to 1999: 12.2
Deaths per 1000 population from 2000 to 2009: 12.2
Deaths per 1000 population from 2010 to 2020: 12.1

Infant deaths per 1000 live births from 1990 to 1999: 14.4
Infant deaths per 1000 live births from 2000 to 2006: 17.1

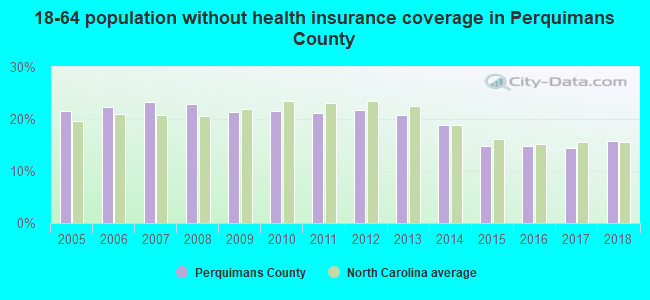
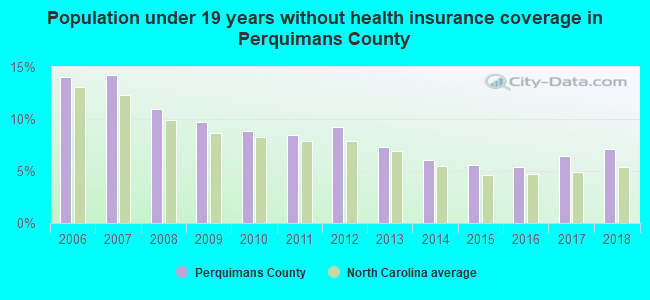
Persons under 19 years old without health insurance coverage in 2018: 7.1%


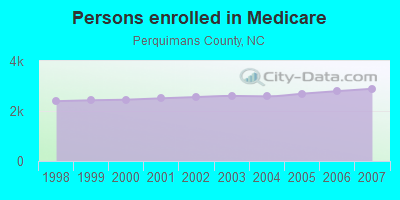
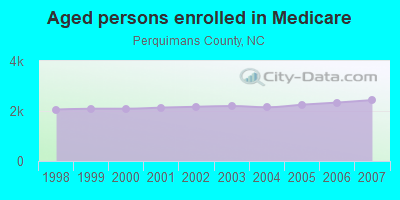
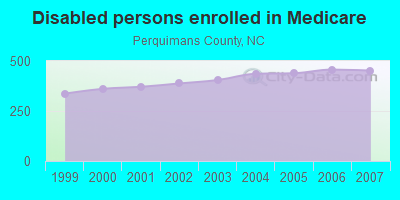
Persons enrolled in hospital insurance and/or supplemental medical insurance (Medicare) in July 1, 2007: 2,889 (2,437 aged, 452 disabled)
Children under 18 without health insurance coverage in 2007: 344 (13%)
Most common underlying causes of death in Perquimans County, North Carolina in 1999 - 2019:
- Bronchus or lung, unspecified - Malignant neoplasms (126)
- Acute myocardial infarction, unspecified (124)
- Atherosclerotic heart disease (50)
- Unspecified dementia (23)
- Alzheimer disease, unspecified (10)
- Chronic obstructive pulmonary disease, unspecified (10)
Population without health insurance coverage in 2000: 14%
Children under 18 without health insurance coverage in 2000: 10%
Medical specialist MDs per 100,000 population in 2005: 1,051
Dentists per 100,000 population in 1998: 17
Total births per 100,000 population, July 2005 - July 2006 : 18
Total deaths per 100,000 population, July 2005 - July 2006: 50
Limited-service eating places per 100,000 population in 2005 : 8
Household type by relationship:
Households: 13,338- Male householders: 2,759 (743 living alone), Female householders: 3,071 (885 living alone)
3,057 spouses (3,057 opposite-sex spouses), 174 unmarried partners, (174 opposite-sex unmarried partners), 3,147 children (2,943 natural, 111 adopted, 88 stepchildren), 348 grandchildren, 186 brothers or sisters, 164 parents, 46 foster children, 216 other relatives, 120 non-relatives
- In group quarters: 95
Size of family households: 2,580 2-persons, 641 3-persons, 508 4-persons, 189 5-persons, 72 6-persons, 91 7-or-more-persons.
Size of nonfamily households: 1,628 1-person, 110 2-persons, 26 3-persons.
1,355 married couples with children.
709 single-parent households (226 men, 483 women).
96.0% of residents of Perquimans speak English at home.
2.8% of residents speak Spanish at home (100% speak English very well).
0.6% of residents speak other Indo-European language at home (89% speak English very well, 11% speak English well).
0.4% of residents speak Asian or Pacific Island language at home (35% speak English very well, 33% speak English well, 33% speak English not well).
0.6% of residents speak other language at home (87% speak English very well, 6% speak English well, 7% speak English not well).
In fiscal year 2004:
Federal Government expenditure: $88,183,000 ($7,497 per capita)
Department of Defense expenditure: $6,153,000
Federal direct payments to individuals for retirement and disability: $47,101,000
Federal other direct payments to individuals: $14,823,000
Federal direct payments not to individuals: $4,929,000
Federal grants: $18,653,000
Federal procurement contracts: $845,000 ($414,000 Department of Defense)
Federal salaries and wages: $1,832,000 ($0,000 Department of Defense)
Federal Government direct loans: $15,614,000
Federal guaranteed/insured loans: $2,785,000
Federal Government insurance: $102,960,000
Population change from April 1, 2000 to July 1, 2005:
Births: 673| Here: | 56 per 1000 residents |
| State: | 72 per 1000 residents |
Deaths: 754
| Here: | 62 per 1000 residents |
| State: | 44 per 1000 residents |
Net international migration: +11
| Here: | +1 per 1000 residents |
| State: | +18 per 1000 residents |
Net internal migration: +810
| Here: | +67 per 1000 residents |
| State: | +27 per 1000 residents |

Total withdrawal of fresh water for public supply: 0.72 millions of gallons per day (all from ground)
| Here: | 6.2 |
| State: | 6.4 |
| Here: | 5.5 |
| State: | 4.4 |
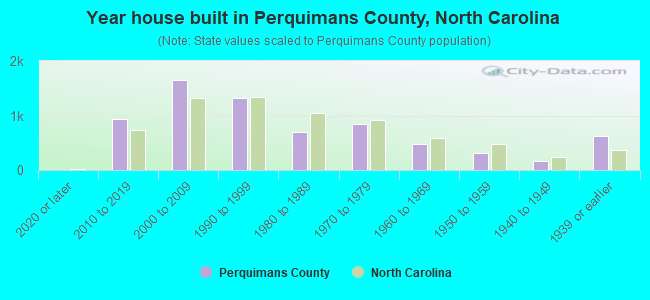
- Year house built in Perquimans County, North Carolina
- 02020 or later
- 9312010 to 2019
- 1,4242000 to 2009
- 1,2931990 to 1999
- 8081980 to 1989
- 8101970 to 1979
- 5431960 to 1969
- 3361950 to 1959
- 1671940 to 1949
- 6381939 or earlier

- Rooms in owner-occupied houses in Perquimans County, North Carolina
- 01 room
- 482 rooms
- 2053 rooms
- 3264 rooms
- 8655 rooms
- 1,0616 rooms
- 7637 rooms
- 4968 rooms
- 7369+ rooms

- Rooms in renter-occupied apartments in Perquimans County, North Carolina
- 31 room
- 82 rooms
- 703 rooms
- 2414 rooms
- 3255 rooms
- 4376 rooms
- 1657 rooms
- 818 rooms
- 129+ rooms

- Bedrooms in owner-occupied houses in Perquimans County, North Carolina
- 0no bedroom
- 1271 bedroom
- 6192 bedrooms
- 2,5903 bedrooms
- 1,0244 bedrooms
- 1295+ bedrooms

- Bedrooms in renter-occupied apartments in Perquimans County, North Carolina
- 3no bedroom
- 741 bedroom
- 4902 bedrooms
- 5563 bedrooms
- 2264 bedrooms
- 05+ bedrooms

- Cars and other vehicles available in Perquimans County in owner-occupied houses/condos
- 126no vehicle
- 1,1301 vehicle
- 1,7522 vehicles
- 1,0183 vehicles
- 3894 vehicles
- 855+ vehicles

- Cars and other vehicles available in Perquimans County in renter-occupied apartments
- 95no vehicle
- 5601 vehicle
- 4192 vehicles
- 2423 vehicles
- 254 vehicles
- 125+ vehicles
87.3% of Perquimans County residents lived in the same house 1 years ago.
Out of people who lived in different houses, 24% lived in this county.
Out of people who lived in different counties, 46% lived in North Carolina.
| Perquimans County: | 87.3% |
| State average: | 87.3% |
Place of birth for U.S.-born residents:
- This state: 7,215
- Other state: 5,715
- Northeast: 1,710
- Midwest: 929
- South: 2,868
- West: 200

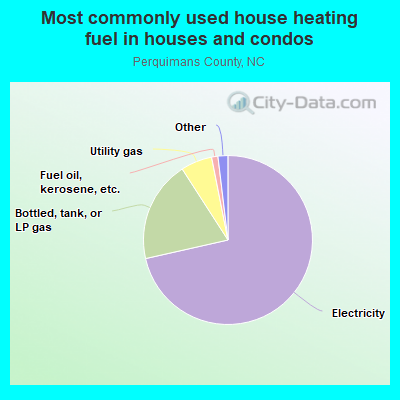
- 72.4%Electricity
- 18.2%Bottled, tank, or LP gas
- 5.7%Utility gas
- 1.5%Fuel oil, kerosene, etc.
- 1.0%Other fuel
- 0.8%Wood
- 0.4%No fuel used

- 70.8%Electricity
- 21.1%Bottled, tank, or LP gas
- 5.1%Fuel oil, kerosene, etc.
- 3.1%Utility gas
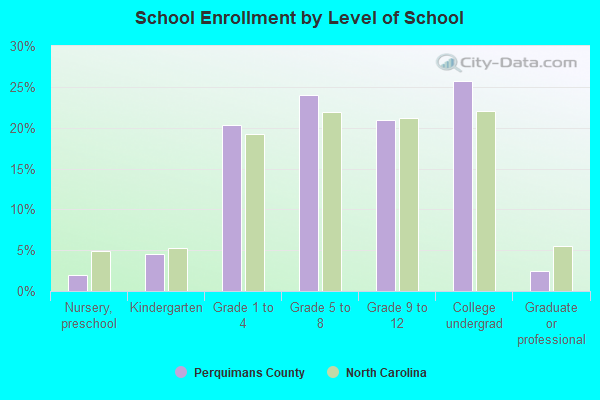
Private vs. public school enrollment:
| Here: | 16.2% |
| North Carolina: | 13.8% |
| Here: | 3.2% |
| North Carolina: | 11.9% |
| Here: | 1.9% |
| North Carolina: | 19.3% |

Perquimans County government finances - Expenditure in 2017:
- Assistance and Subsidies - Public Welfare, Cash Assistance Programs - Other: $621,000
- Charges - Solid Waste Management: $897,000
Miscellaneous Commercial Activities: $805,000
Elementary and Secondary Education School Lunch: $233,000
Elementary and Secondary Education School Tuition and Transportation: $50,000
Other: $44,000
Parks and Recreation: $18,000
Elementary and Secondary Education - Other: $6,000
- Construction - Libraries: $1,777,000
Parks and Recreation: $309,000
Elementary and Secondary Education: $197,000
- Current Operations - Elementary and Secondary Education: $17,855,000
Police Protection: $1,903,000
Water Utilities: $1,763,000
Public Welfare - Other: $1,595,000
Health - Other: $1,276,000
Solid Waste Management: $967,000
General Public Buildings: $796,000
General - Other: $488,000
Financial Administration: $461,000
Central Staff Services: $447,000
Parks and Recreation: $407,000
Housing and Community Development: $214,000
Protective Inspection and Regulation - Other: $199,000
Libraries: $169,000
Judicial and Legal Services: $124,000
Local Fire Protection: $110,000
Natural Resources - Other: $104,000
Correctional Institutions: $1,000
- Federal Intergovernmental - General Local Government Support: $383,000
Education: $220,000
Other: $6,000
- General - Interest on Debt: $577,000
- Intergovernmental to Local - Other - Correctional Institutions: $601,000
Other - Local Fire Protection: $405,000
Other - Elementary and Secondary Education: $77,000
- Intergovernmental to State - Public Welfare: $156,000
- Local Intergovernmental - Other: $135,000
- Long Term Debt - Outstanding Unspecified Public Purpose: $13,774,000
Beginning Outstanding - Unspecified Public Purpose: $12,353,000
Issue, Unspecified Public Purpose: $2,500,000
Retired Unspecified Public Purpose: $1,080,000
- Miscellaneous - Donations From Private Sources: $603,000
General Revenue - Other: $251,000
Fines and Forfeits: $160,000
Rents: $84,000
Interest Earnings: $1,000
- Other Capital Outlay - Elementary and Secondary Education: $587,000
Parks and Recreation: $372,000
Police Protection: $275,000
Health - Other: $196,000
Public Welfare - Other: $31,000
Local Fire Protection: $27,000
General - Other: $3,000
Central Staff Services: $1,000
- Other Funds - Cash and Securities: $1,265,000
- Revenue - Water Utilities: $1,988,000
- State Intergovernmental - Education: $14,739,000
Public Welfare: $1,799,000
General Local Government Support: $798,000
Other: $551,000
Housing and Community Development: $167,000
- Tax - Property: $8,189,000
General Sales and Gross Receipts: $2,070,000
Other Selective Sales: $316,000
Occupation and Business License - Other: $77,000
Documentary and Stock Transfer: $71,000
Other License: $24,000
- Total Salaries and Wages: $10,868,000
- Water Utilities - Interest on Debt: $46,000
Perquimans County government finances - Revenue in 2017:
- Assistance and Subsidies - Public Welfare, Cash Assistance Programs - Other: $621,000
- Charges - Solid Waste Management: $897,000
Miscellaneous Commercial Activities: $805,000
Elementary and Secondary Education School Lunch: $233,000
Elementary and Secondary Education School Tuition and Transportation: $50,000
Other: $44,000
Parks and Recreation: $18,000
Elementary and Secondary Education - Other: $6,000
- Construction - Libraries: $1,777,000
Parks and Recreation: $309,000
Elementary and Secondary Education: $197,000
- Current Operations - Elementary and Secondary Education: $17,855,000
Police Protection: $1,903,000
Water Utilities: $1,763,000
Public Welfare - Other: $1,595,000
Health - Other: $1,276,000
Solid Waste Management: $967,000
General Public Buildings: $796,000
General - Other: $488,000
Financial Administration: $461,000
Central Staff Services: $447,000
Parks and Recreation: $407,000
Housing and Community Development: $214,000
Protective Inspection and Regulation - Other: $199,000
Libraries: $169,000
Judicial and Legal Services: $124,000
Local Fire Protection: $110,000
Natural Resources - Other: $104,000
Correctional Institutions: $1,000
- Federal Intergovernmental - General Local Government Support: $383,000
Education: $220,000
Other: $6,000
- General - Interest on Debt: $577,000
- Intergovernmental to Local - Other - Correctional Institutions: $601,000
Other - Local Fire Protection: $405,000
Other - Elementary and Secondary Education: $77,000
- Intergovernmental to State - Public Welfare: $156,000
- Local Intergovernmental - Other: $135,000
- Long Term Debt - Outstanding Unspecified Public Purpose: $13,774,000
Beginning Outstanding - Unspecified Public Purpose: $12,353,000
Issue, Unspecified Public Purpose: $2,500,000
Retired Unspecified Public Purpose: $1,080,000
- Miscellaneous - Donations From Private Sources: $603,000
General Revenue - Other: $251,000
Fines and Forfeits: $160,000
Rents: $84,000
Interest Earnings: $1,000
- Other Capital Outlay - Elementary and Secondary Education: $587,000
Parks and Recreation: $372,000
Police Protection: $275,000
Health - Other: $196,000
Public Welfare - Other: $31,000
Local Fire Protection: $27,000
General - Other: $3,000
Central Staff Services: $1,000
- Other Funds - Cash and Securities: $1,265,000
- Revenue - Water Utilities: $1,988,000
- State Intergovernmental - Education: $14,739,000
Public Welfare: $1,799,000
General Local Government Support: $798,000
Other: $551,000
Housing and Community Development: $167,000
- Tax - Property: $8,189,000
General Sales and Gross Receipts: $2,070,000
Other Selective Sales: $316,000
Occupation and Business License - Other: $77,000
Documentary and Stock Transfer: $71,000
Other License: $24,000
- Total Salaries and Wages: $10,868,000
- Water Utilities - Interest on Debt: $46,000
Perquimans County government finances - Debt in 2017:
- Assistance and Subsidies - Public Welfare, Cash Assistance Programs - Other: $621,000
- Charges - Solid Waste Management: $897,000
Miscellaneous Commercial Activities: $805,000
Elementary and Secondary Education School Lunch: $233,000
Elementary and Secondary Education School Tuition and Transportation: $50,000
Other: $44,000
Parks and Recreation: $18,000
Elementary and Secondary Education - Other: $6,000
- Construction - Libraries: $1,777,000
Parks and Recreation: $309,000
Elementary and Secondary Education: $197,000
- Current Operations - Elementary and Secondary Education: $17,855,000
Police Protection: $1,903,000
Water Utilities: $1,763,000
Public Welfare - Other: $1,595,000
Health - Other: $1,276,000
Solid Waste Management: $967,000
General Public Buildings: $796,000
General - Other: $488,000
Financial Administration: $461,000
Central Staff Services: $447,000
Parks and Recreation: $407,000
Housing and Community Development: $214,000
Protective Inspection and Regulation - Other: $199,000
Libraries: $169,000
Judicial and Legal Services: $124,000
Local Fire Protection: $110,000
Natural Resources - Other: $104,000
Correctional Institutions: $1,000
- Federal Intergovernmental - General Local Government Support: $383,000
Education: $220,000
Other: $6,000
- General - Interest on Debt: $577,000
- Intergovernmental to Local - Other - Correctional Institutions: $601,000
Other - Local Fire Protection: $405,000
Other - Elementary and Secondary Education: $77,000
- Intergovernmental to State - Public Welfare: $156,000
- Local Intergovernmental - Other: $135,000
- Long Term Debt - Outstanding Unspecified Public Purpose: $13,774,000
Beginning Outstanding - Unspecified Public Purpose: $12,353,000
Issue, Unspecified Public Purpose: $2,500,000
Retired Unspecified Public Purpose: $1,080,000
- Miscellaneous - Donations From Private Sources: $603,000
General Revenue - Other: $251,000
Fines and Forfeits: $160,000
Rents: $84,000
Interest Earnings: $1,000
- Other Capital Outlay - Elementary and Secondary Education: $587,000
Parks and Recreation: $372,000
Police Protection: $275,000
Health - Other: $196,000
Public Welfare - Other: $31,000
Local Fire Protection: $27,000
General - Other: $3,000
Central Staff Services: $1,000
- Other Funds - Cash and Securities: $1,265,000
- Revenue - Water Utilities: $1,988,000
- State Intergovernmental - Education: $14,739,000
Public Welfare: $1,799,000
General Local Government Support: $798,000
Other: $551,000
Housing and Community Development: $167,000
- Tax - Property: $8,189,000
General Sales and Gross Receipts: $2,070,000
Other Selective Sales: $316,000
Occupation and Business License - Other: $77,000
Documentary and Stock Transfer: $71,000
Other License: $24,000
- Total Salaries and Wages: $10,868,000
- Water Utilities - Interest on Debt: $46,000
Perquimans County government finances - Cash and Securities in 2017:
- Assistance and Subsidies - Public Welfare, Cash Assistance Programs - Other: $621,000
- Charges - Solid Waste Management: $897,000
Miscellaneous Commercial Activities: $805,000
Elementary and Secondary Education School Lunch: $233,000
Elementary and Secondary Education School Tuition and Transportation: $50,000
Other: $44,000
Parks and Recreation: $18,000
Elementary and Secondary Education - Other: $6,000
- Construction - Libraries: $1,777,000
Parks and Recreation: $309,000
Elementary and Secondary Education: $197,000
- Current Operations - Elementary and Secondary Education: $17,855,000
Police Protection: $1,903,000
Water Utilities: $1,763,000
Public Welfare - Other: $1,595,000
Health - Other: $1,276,000
Solid Waste Management: $967,000
General Public Buildings: $796,000
General - Other: $488,000
Financial Administration: $461,000
Central Staff Services: $447,000
Parks and Recreation: $407,000
Housing and Community Development: $214,000
Protective Inspection and Regulation - Other: $199,000
Libraries: $169,000
Judicial and Legal Services: $124,000
Local Fire Protection: $110,000
Natural Resources - Other: $104,000
Correctional Institutions: $1,000
- Federal Intergovernmental - General Local Government Support: $383,000
Education: $220,000
Other: $6,000
- General - Interest on Debt: $577,000
- Intergovernmental to Local - Other - Correctional Institutions: $601,000
Other - Local Fire Protection: $405,000
Other - Elementary and Secondary Education: $77,000
- Intergovernmental to State - Public Welfare: $156,000
- Local Intergovernmental - Other: $135,000
- Long Term Debt - Outstanding Unspecified Public Purpose: $13,774,000
Beginning Outstanding - Unspecified Public Purpose: $12,353,000
Issue, Unspecified Public Purpose: $2,500,000
Retired Unspecified Public Purpose: $1,080,000
- Miscellaneous - Donations From Private Sources: $603,000
General Revenue - Other: $251,000
Fines and Forfeits: $160,000
Rents: $84,000
Interest Earnings: $1,000
- Other Capital Outlay - Elementary and Secondary Education: $587,000
Parks and Recreation: $372,000
Police Protection: $275,000
Health - Other: $196,000
Public Welfare - Other: $31,000
Local Fire Protection: $27,000
General - Other: $3,000
Central Staff Services: $1,000
- Other Funds - Cash and Securities: $1,265,000
- Revenue - Water Utilities: $1,988,000
- State Intergovernmental - Education: $14,739,000
Public Welfare: $1,799,000
General Local Government Support: $798,000
Other: $551,000
Housing and Community Development: $167,000
- Tax - Property: $8,189,000
General Sales and Gross Receipts: $2,070,000
Other Selective Sales: $316,000
Occupation and Business License - Other: $77,000
Documentary and Stock Transfer: $71,000
Other License: $24,000
- Total Salaries and Wages: $10,868,000
- Water Utilities - Interest on Debt: $46,000
Supplemental Security Income (SSI) in 2006:
- Total number of recipients: 346
- Number of aged recipients: 45
- Number of blind and disabled recipients: 301
- Number of recipients under 18: 43
- Number of recipients between 18 and 64: 216
- Number of recipients older than 64: 87
- Number of recipients also receiving OASDI: 152
- Amount of payments (thousands of dollars): 137
| Most common first names in Perquimans County, NC among deceased individuals | ||
| Name | Count | Lived (average) |
|---|---|---|
| William | 137 | 73.0 years |
| James | 105 | 71.2 years |
| Mary | 97 | 81.9 years |
| John | 95 | 73.6 years |
| George | 59 | 74.7 years |
| Robert | 44 | 70.8 years |
| Elizabeth | 38 | 81.4 years |
| Joseph | 37 | 75.5 years |
| Willie | 37 | 68.7 years |
| Charles | 33 | 73.0 years |
| Most common last names in Perquimans County, NC among deceased individuals | ||
| Last name | Count | Lived (average) |
|---|---|---|
| White | 127 | 76.0 years |
| Winslow | 59 | 77.0 years |
| Perry | 59 | 76.4 years |
| Riddick | 51 | 74.3 years |
| Lane | 50 | 81.2 years |
| Harrell | 47 | 73.9 years |
| Jones | 47 | 76.3 years |
| Felton | 46 | 72.5 years |
| Smith | 38 | 79.1 years |
| Stallings | 37 | 75.6 years |
| Businesses in Perquimans County, NC | ||||
| Name | Count | Name | Count | |
|---|---|---|---|---|
| Ace Hardware | 1 | McDonald's | 1 | |
| Curves | 1 | Subway | 1 | |
| FedEx | 1 | U-Haul | 1 | |
| H&R Block | 1 | U.S. Cellular | 1 | |
| Hardee's | 1 | UPS | 2 | |