Tuscola County, Michigan (MI)
County owner-occupied free and clear houses and condos in 2010: 7,003
County owner-occupied houses and condos in 2000: 18,048
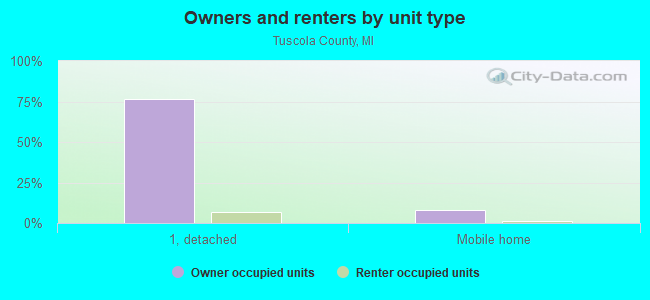
Renter-occupied apartments: 3,710 (it was 3,406 in 2000)
| % of renters here: | 16% |
| State: | 28% |
Land area: 812 sq. mi.
Water area: 101.4 sq. mi.
Population density: 65 people per square mile (average).
Industries providing employment: Educational, health and social services (22.5%), Manufacturing (19.4%), Retail trade (13.2%).
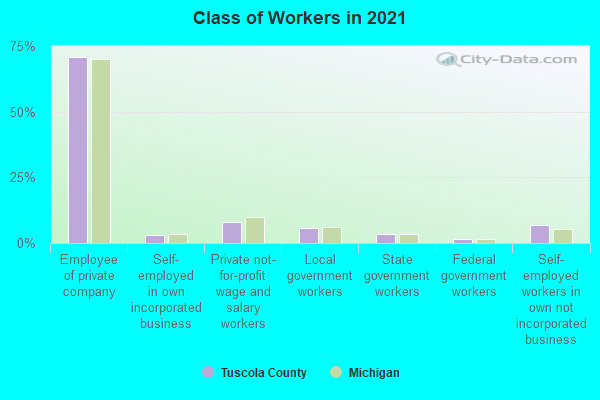
Type of workers:
- Private wage or salary: 82%
- Government: 11%
- Self-employed, not incorporated: 7%
- Unpaid family work: 1%
- OSM Map
- General Map
- Google Map
- MSN Map

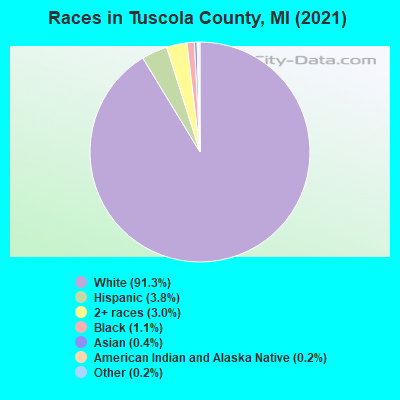
- 48,24391.3%White Non-Hispanic Alone
- 2,1004.0%Hispanic or Latino
- 1,4872.8%Two or more races
- 5421.0%Black Non-Hispanic Alone
- 2660.5%Asian alone
- 1180.2%American Indian and Alaska Native alone
- 1040.2%Some other race alone
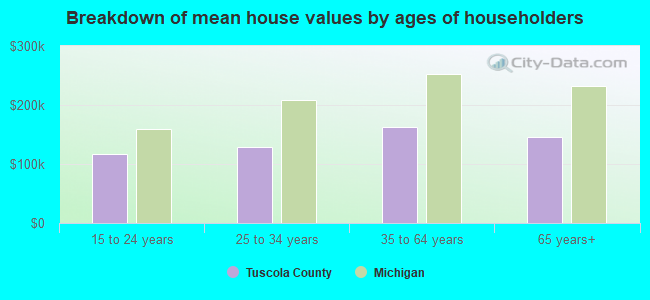
| Median resident age: | 45.1 years |
| Michigan median age: | 40.3 years |
| Males: 26,968 | |
| Females: 26,124 |

 | 2/3 of Michigan Counties add Residents; Wayne County population loss slows to a crawl (33 replies) |
| Anyone familiar with Caro and nearbye areas? (12 replies) |
| Caro, MI (18 replies) |
| Vassar, MI...What can ya tell me? (16 replies) |
| Special education process in Michigan? (6 replies) |
| Visiting Vassar, please help (8 replies) |
| Tuscola County: | 2.0 people |
| Michigan: | 2 people |
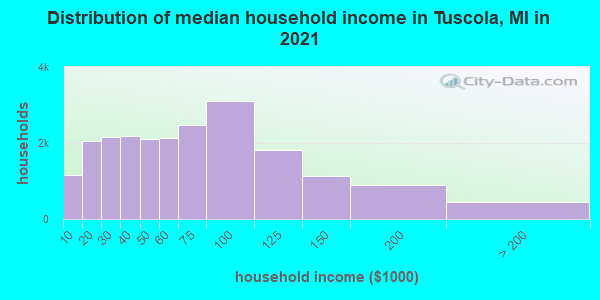
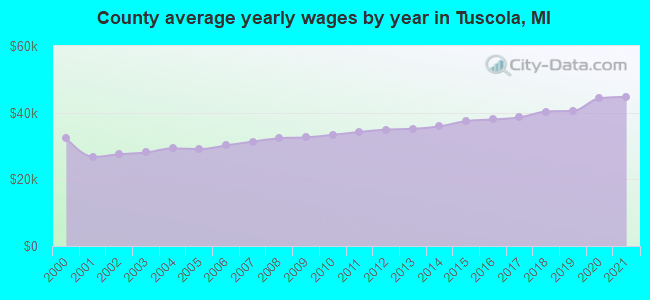
Estimated median household income in 2022: $58,488 ($40,174 in 1999)
| This county: | $58,488 |
| Michigan: | $66,986 |
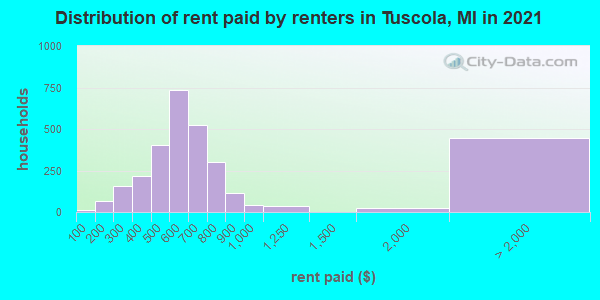
Median contract rent in 2022 for apartments: $606 (lower quartile is $485, upper quartile is $727)
| This county: | $606 |
| State: | $865 |
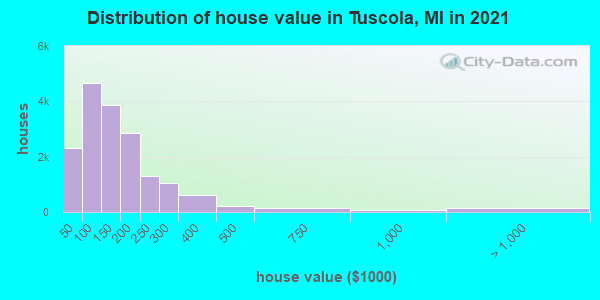
Estimated median house or condo value in 2022: $141,938 (it was $88,300 in 2000)
| Tuscola: | $141,938 |
| Michigan: | $224,400 |
Median monthly housing costs for homes and condos with a mortgage: $1,147
Median monthly housing costs for units without a mortgage: $479
Institutionalized population: 792
Crime in 2021 (reported by the sheriff's office or county police, not the county total):
- Murders: 0
- Rapes: 22
- Robberies: 1
- Assaults: 31
- Burglaries: 31
- Thefts: 75
- Auto thefts: 15
Crime in 2020 (reported by the sheriff's office or county police, not the county total):
- Murders: 0
- Rapes: 17
- Robberies: 0
- Assaults: 40
- Burglaries: 41
- Thefts: 70
- Auto thefts: 24
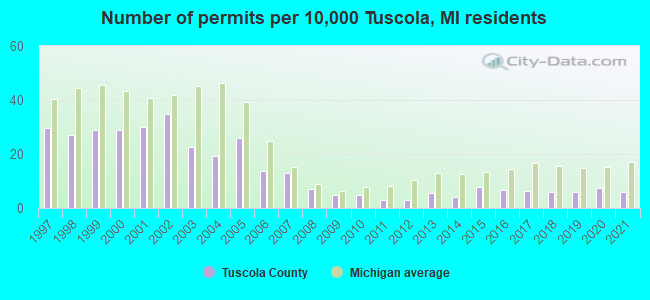
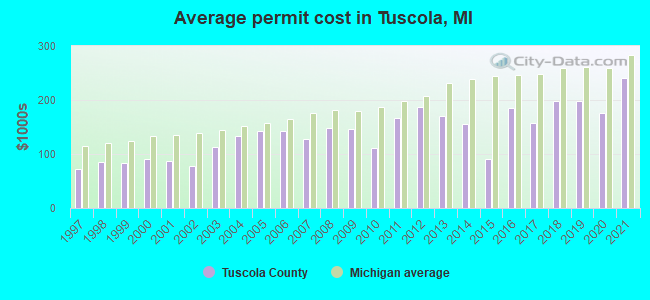
Single-family new house construction building permits:
- 2022: 59 buildings, average cost: $256,300
- 2021: 34 buildings, average cost: $239,900
- 2020: 43 buildings, average cost: $176,000
- 2019: 34 buildings, average cost: $197,800
- 2018: 35 buildings, average cost: $199,200
- 2017: 36 buildings, average cost: $158,200
- 2016: 38 buildings, average cost: $185,300
- 2015: 45 buildings, average cost: $89,800
- 2014: 23 buildings, average cost: $156,000
- 2013: 32 buildings, average cost: $170,000
- 2012: 17 buildings, average cost: $187,400
- 2011: 18 buildings, average cost: $166,100
- 2010: 29 buildings, average cost: $111,500
- 2009: 27 buildings, average cost: $145,700
- 2008: 41 buildings, average cost: $147,500
- 2007: 75 buildings, average cost: $128,200
- 2006: 79 buildings, average cost: $142,300
- 2005: 151 buildings, average cost: $141,700
- 2004: 112 buildings, average cost: $134,100
- 2003: 131 buildings, average cost: $112,500
- 2002: 202 buildings, average cost: $77,200
- 2001: 174 buildings, average cost: $86,800
- 2000: 168 buildings, average cost: $90,000
- 1999: 169 buildings, average cost: $82,500
- 1998: 158 buildings, average cost: $86,400
- 1997: 172 buildings, average cost: $72,700
Median real estate property taxes paid for housing units with mortgages in 2022: $1,830 (1.2%)
Median real estate property taxes paid for housing units with no mortgage in 2022: $1,572 (1.2%)
| Tuscola County: | 12.5% |
| Michigan: | 13.4% |
Median age of residents in 2022: 45.1 years old
(Males: 43.4 years old, Females: 46.7 years old)
(Median age for: White residents: 46.6 years old, Black residents: 26.6 years old, American Indian residents: 25.7 years old, Asian residents: 33.4 years old, Hispanic or Latino residents: 28.7 years old, Other race residents: 54.2 years old)
Fair market rent in 2006 for a 1-bedroom apartment in Tuscola County is $418 a month.
Fair market rent for a 2-bedroom apartment is $530 a month.
Fair market rent for a 3-bedroom apartment is $636 a month.
Cities in this county include: Caro, Vassar, Cass City, Reese, Millington, Mayville, Fostoria, Fairgrove, Unionville, Akron.
2023 air pollution in Tuscola County:
Ozone (1-hour): 0.036 ppm (standard limit: 0.12 ppm). Near U.S. average.
| Here: | 4.7% |
| Michigan: | 3.5% |
Current college students: 2,369
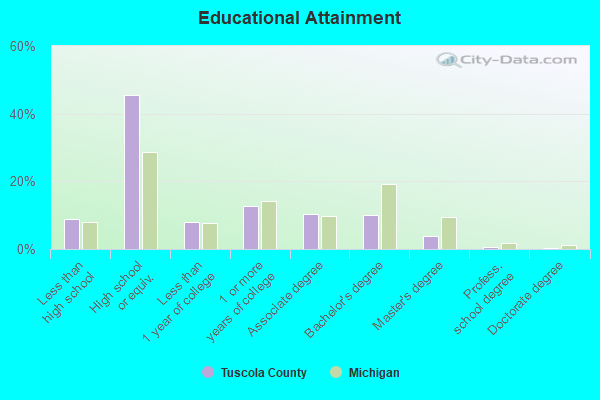
People 25 years of age or older with a high school degree or higher: 91.5%
People 25 years of age or older with a bachelor's degree or higher: 15.3%
Number of foreign born residents: 515 (57.4% naturalized citizens)
| Tuscola County: | 1.0% |
| Whole state: | 6.9% |
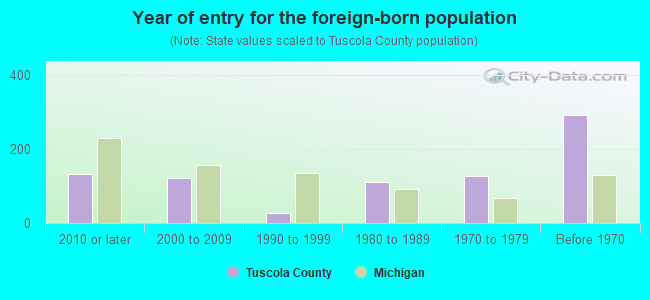
- Year of entry for the foreign-born population
- 1842010 or later
- 1482000 to 2009
- 421990 to 1999
- 1111980 to 1989
- 1271970 to 1979
- 291Before 1970
Mean travel time to work (commute): minutes
Percentage of county residents living and working in this county: 99.5%
Housing units in structures:
- One, detached: 19,666
- One, attached: 279
- Two: 303
- 3 or 4: 418
- 5 to 9: 565
- 10 to 19: 101
- 20 to 49: 218
- 50 or more: 122
- Mobile homes: 2,381
Housing units in Tuscola County with a mortgage: 9,364 (640 second mortgage, 3 home equity loan, 482 both second mortgage and home equity loan)
Houses without a mortgage: 225
| Here: | 3.8% with mortgage |
| State: | 96.7% with mortgage |
Religion statistics for Tuscola County
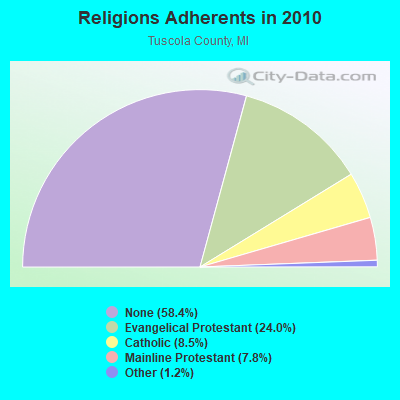
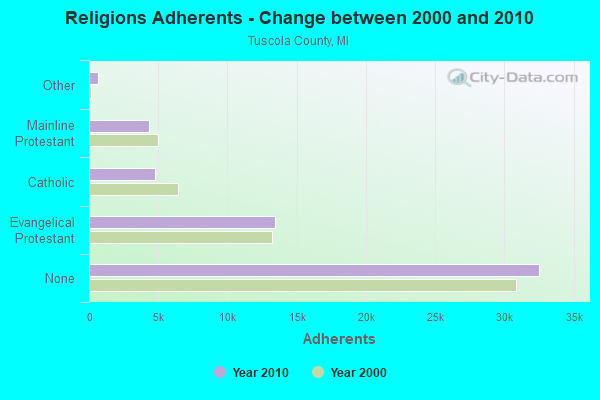
| Religion | Adherents | Congregations |
|---|---|---|
| Evangelical Protestant | 13,401 | 58 |
| Catholic | 4,756 | 7 |
| Mainline Protestant | 4,360 | 23 |
| Other | 678 | 5 |
| None | 32,534 | - |
Source: Clifford Grammich, Kirk Hadaway, Richard Houseal, Dale E.Jones, Alexei Krindatch, Richie Stanley and Richard H.Taylor. 2012. 2010 U.S.Religion Census: Religious Congregations & Membership Study. Association of Statisticians of American Religious Bodies. Jones, Dale E., et al. 2002. Congregations and Membership in the United States 2000. Nashville, TN: Glenmary Research Center.
Food Environment Statistics:
| Tuscola County: | 2.12 / 10,000 pop. |
| State: | 2.34 / 10,000 pop. |
| Here: | 0.18 / 10,000 pop. |
| Michigan: | 0.18 / 10,000 pop. |
| This county: | 2.12 / 10,000 pop. |
| Michigan: | 1.52 / 10,000 pop. |
| Tuscola County: | 3.18 / 10,000 pop. |
| Michigan: | 2.99 / 10,000 pop. |
| This county: | 4.41 / 10,000 pop. |
| State: | 6.80 / 10,000 pop. |
| Tuscola County: | 9.0% |
| Michigan: | 9.7% |
| Tuscola County: | 29.2% |
| State: | 29.7% |
| Here: | 11.1% |
| State: | 13.4% |
Agriculture in Tuscola County:
Average size of farms: 260 acresAverage value of agricultural products sold per farm: $72,599
Average value of crops sold per acre for harvested cropland: $269.63
The value of nursery, greenhouse, floriculture, and sod as a percentage of the total market value of agricultural products sold: 0.89%
The value of livestock, poultry, and their products as a percentage of the total market value of agricultural products sold: 22.39%
Average total farm production expenses per farm: $70,204
Harvested cropland as a percentage of land in farms: 80.47%
Irrigated harvested cropland as a percentage of land in farms: 2.14%
Average market value of all machinery and equipment per farm: $107,161
The percentage of farms operated by a family or individual: 88.31%
Average age of principal farm operators: 53 years
Average number of cattle and calves per 100 acres of all land in farms: 5.41
Milk cows as a percentage of all cattle and calves: 24.46%
Corn for grain: 79706 harvested acres
All wheat for grain: 19450 harvested acres
Soybeans for beans: 77296 harvested acres
Vegetables: 2,230 harvested acres
Land in orchards: 197 acres
Earthquake activity:
Tuscola County-area historical earthquake activity is significantly above Michigan state average. It is 57% smaller than the overall U.S. average.On 9/25/1998 at 19:52:52, a magnitude 5.2 (4.8 MB, 4.3 MS, 5.2 LG, 4.5 MW, Depth: 3.1 mi, Class: Moderate, Intensity: VI - VII) earthquake occurred 206.5 miles away from Tuscola County center
On 1/31/1986 at 16:46:43, a magnitude 5.0 (5.0 MB) earthquake occurred 173.2 miles away from the county center
On 5/2/2015 at 16:23:07, a magnitude 4.2 (4.2 MW, Depth: 2.8 mi, Class: Light, Intensity: IV - V) earthquake occurred 132.0 miles away from the county center
On 7/12/1986 at 08:19:37, a magnitude 4.5 (4.5 MB) earthquake occurred 208.1 miles away from the county center
On 7/27/1980 at 18:52:21, a magnitude 5.2 (5.1 MB, 4.7 MS, 5.0 UK, 5.2 UK) earthquake occurred 364.7 miles away from Tuscola County center
On 6/10/2019 at 14:50:45, a magnitude 4.0 (4.0 MB, Depth: 1.2 mi) earthquake occurred 159.3 miles away from the county center
Magnitude types: regional Lg-wave magnitude (LG), body-wave magnitude (MB), surface-wave magnitude (MS), moment magnitude (MW)
Most recent natural disasters:
- Michigan Covid-19 Pandemic, Incident Period: January 20, 2020, FEMA Id: 4494, Natural disaster type: Other
- Michigan Hurricane Katrina Evacuation, Incident Period: August 29, 2005 to October 01, 2005, Emergency Declared EM-3225: September 07, 2005, FEMA Id: 3225, Natural disaster type: Hurricane
- Michigan Severe Winter Storm, Incident Period: December 11, 2000 to December 31, 2000, Emergency Declared EM-3160: January 10, 2001, FEMA Id: 3160, Natural disaster type: Winter Storm
- Michigan Flooding, Incident Period: June 21, 1996 to July 01, 1996, Major Disaster (Presidential) Declared DR-1128: July 23, 1996, FEMA Id: 1128, Natural disaster type: Flood
- Michigan SEVERE STORMS, FLOODING, Incident Period: September 10, 1986 to October 10, 1986, Major Disaster (Presidential) Declared DR-774: September 18, 1986, FEMA Id: 774, Natural disaster type: Storm, Flood
- Michigan SEVERE STORMS AND FLOODING, Incident Period: September 05, 1985 to September 28, 1985, Major Disaster (Presidential) Declared DR-744: September 18, 1985, FEMA Id: 744, Natural disaster type: Storm, Flood
- Michigan Blizzards and Snowstorms, Incident Period: January 27, 1978, Emergency Declared EM-3057: January 27, 1978, FEMA Id: 3057, Natural disaster type: Snowstorm, Blizzard
- Michigan Severe Storms, Tornadoes, Icing, Flooding, Incident Period: March 19, 1976, Major Disaster (Presidential) Declared DR-495: March 19, 1976, FEMA Id: 495, Natural disaster type: Storm, Tornado, Flood
- Michigan SEVERE STORMS, FLOODING, Incident Period: April 12, 1973, Major Disaster (Presidential) Declared DR-371: April 12, 1973, FEMA Id: 371, Natural disaster type: Storm, Flood
- Michigan SEVERE STORMS, FLOODING, Incident Period: December 01, 1972, Major Disaster (Presidential) Declared DR-363: December 01, 1972, FEMA Id: 363, Natural disaster type: Storm, Flood
The number of natural disasters in Tuscola County (10) is smaller than the US average (15).
Major Disasters (Presidential) Declared: 6
Emergencies Declared: 3
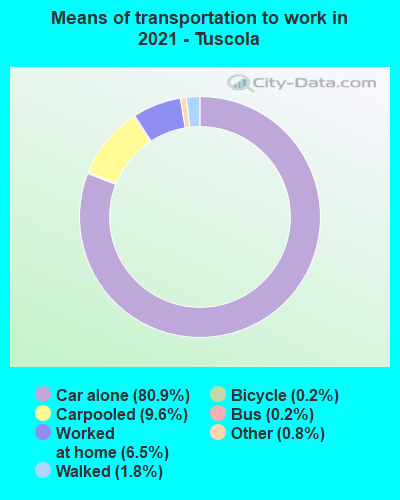
Means of transportation to work:
- Drove a car alone: 12,083 (78.8%)
- Carpooled: 1,159 (7.6%)
- Bus: 28 (0.2%)
- Long-distance train or commuter rail: 4 (0.0%)
- Taxicab, motorcycle, or other means: 165 (1.1%)
- Bicycle: 42 (0.3%)
- Walked: 290 (1.9%)
- Worked at home: 1,361 (8.9%)
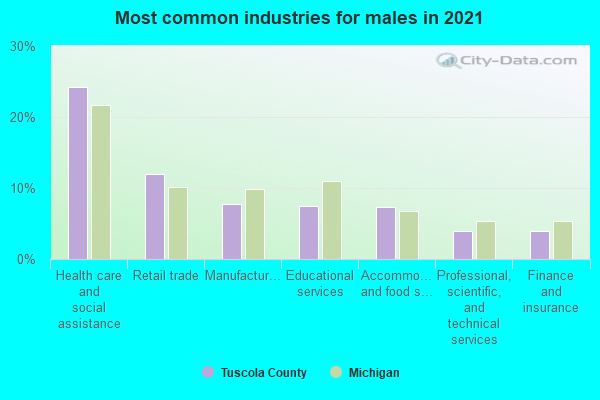
- Health care and social assistance (24%)
- Retail trade (13%)
- Educational services (8%)
- Accommodation and food services (8%)
- Manufacturing (7%)
- Professional, scientific, and technical services (4%)
- Other services, except public administration (4%)
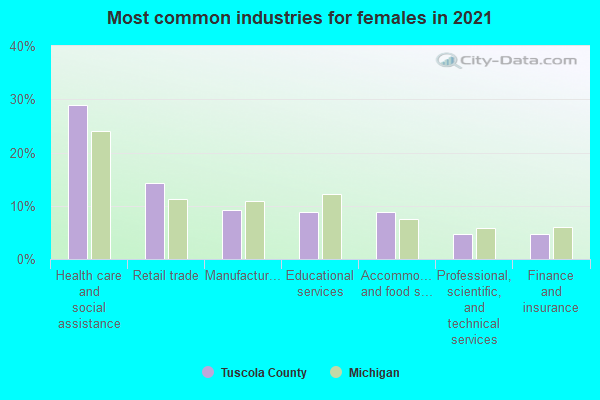
- Health care and social assistance (30%)
- Retail trade (15%)
- Educational services (9%)
- Accommodation and food services (9%)
- Manufacturing (9%)
- Professional, scientific, and technical services (5%)
- Other services, except public administration (5%)
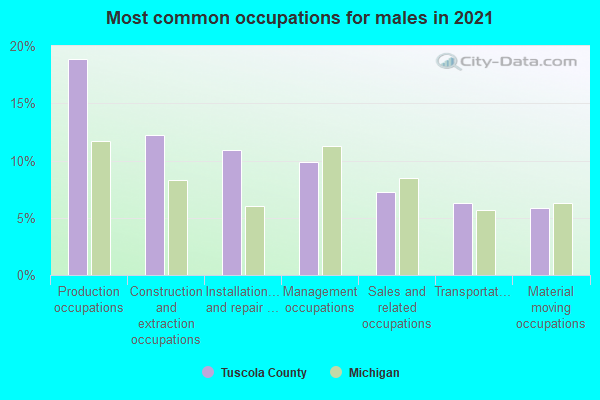
- Production occupations (20%)
- Construction and extraction occupations (13%)
- Management occupations (11%)
- Installation, maintenance, and repair occupations (10%)
- Sales and related occupations (7%)
- Transportation occupations (6%)
- Material moving occupations (5%)
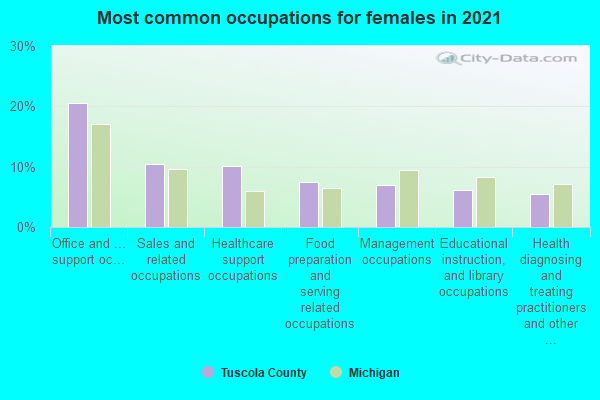
- Office and administrative support occupations (19%)
- Healthcare support occupations (11%)
- Sales and related occupations (11%)
- Food preparation and serving related occupations (8%)
- Management occupations (7%)
- Educational instruction, and library occupations (7%)
- Health diagnosing and treating practitioners and other technical occupations (6%)
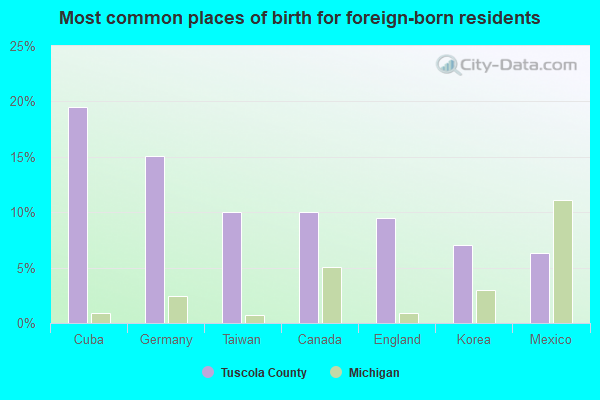
- Cuba (15%)
- Canada (11%)
- Germany (9%)
- Taiwan (8%)
- England (6%)
- Korea (6%)
- Panama (6%)
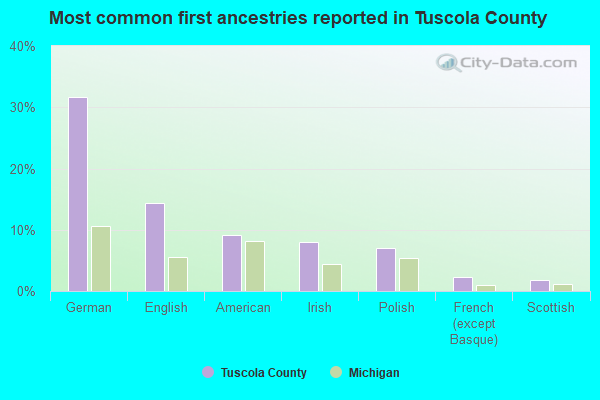
- German (32%)
- English (13%)
- American (11%)
- Irish (7%)
- Polish (7%)
- Italian (2%)
- French Canadian (2%)
People in group quarters in Tuscola County, Michigan in 2010:
- 338 people in group homes intended for adults
- 321 people in nursing facilities/skilled-nursing facilities
- 244 people in residential treatment centers for juveniles (non-correctional)
- 153 people in correctional residential facilities
- 74 people in local jails and other municipal confinement facilities
- 58 people in residential treatment centers for adults
- 39 people in workers' group living quarters and job corps centers
- 8 people in other noninstitutional facilities
People in group quarters in Tuscola County, Michigan in 2000:
- 287 people in homes for abused, dependent, and neglected children
- 255 people in nursing homes
- 204 people in other group homes
- 191 people in mental (psychiatric) hospitals or wards
- 160 people in state prisons
- 89 people in other types of correctional institutions
- 85 people in local jails and other confinement facilities (including police lockups)
- 66 people in homes for the mentally retarded
- 55 people in other noninstitutional group quarters
- 47 people in agriculture workers' dormitories on farms
- 16 people in homes for the physically handicapped
- 4 people in religious group quarters
- 2 people in unknown juvenile institutions
5.57% of this county's 2021 resident taxpayers lived in other counties in 2020 ($45,227 average adjusted gross income)
| Here: | 5.57% |
| Michigan average: | 5.83% |
10 or fewer of this county's residents moved from foreign countries.
4.72% relocated from other counties in Michigan ($38,646 average AGI)
0.85% relocated from other states ($6,580 average AGI)
Tuscola County: 0.85% Michigan average: 1.78%
Top counties from which taxpayers relocated into this county between 2020 and 2021:
| from Genesee County, MI | |
| from Saginaw County, MI | |
| from Lapeer County, MI | |
| from Huron County, MI | |
| from Bay County, MI | |
| from Sanilac County, MI | |
| from Oakland County, MI |
5.56% of this county's 2020 resident taxpayers moved to other counties in 2021 ($43,111 average adjusted gross income)
| Here: | 5.56% |
| Michigan average: | 5.95% |
10 or fewer of this county's residents moved to foreign countries.
4.53% relocated to other counties in Michigan ($36,085 average AGI)
1.03% relocated to other states ($7,026 average AGI)
Tuscola County: 1.03% Michigan average: 1.91%
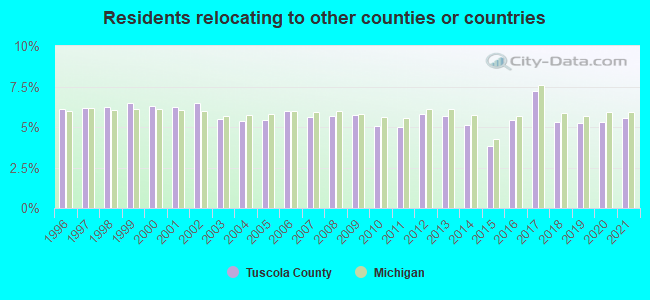
Top counties to which taxpayers relocated from this county between 2020 and 2021:
| to Saginaw County, MI | |
| to Genesee County, MI | |
| to Bay County, MI | |
| to Lapeer County, MI | |
| to Huron County, MI | |
| to Sanilac County, MI | |
| to Oakland County, MI |
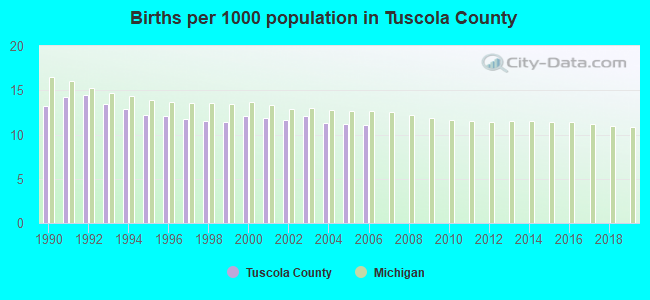
Births per 1000 population from 1990 to 1999: 12.7
Births per 1000 population from 2000 to 2006: 11.6
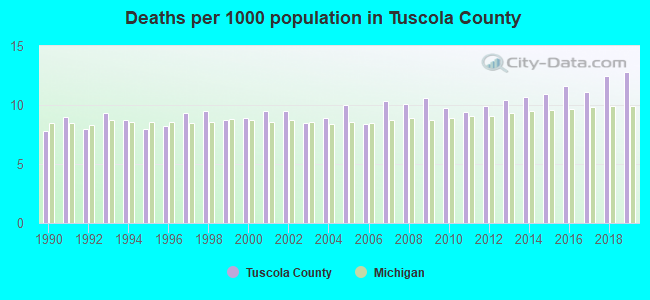
Deaths per 1000 population from 1990 to 1999: 8.7
Deaths per 1000 population from 2000 to 2009: 9.5
Deaths per 1000 population from 2010 to 2020: 11.3
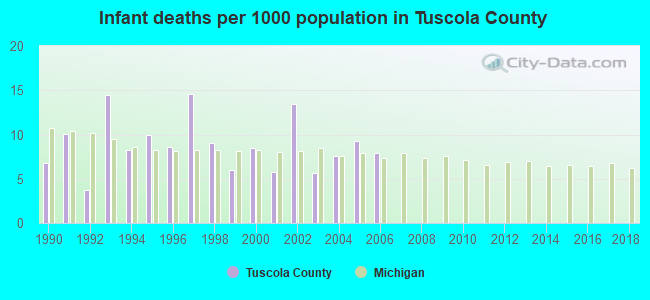
Infant deaths per 1000 live births from 1990 to 1999: 9.2
Infant deaths per 1000 live births from 2000 to 2006: 8.3
Persons under 19 years old without health insurance coverage in 2018: 4.0%
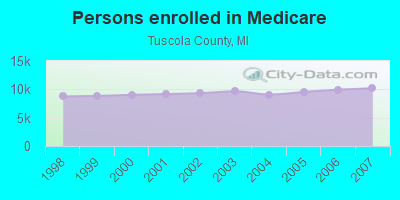
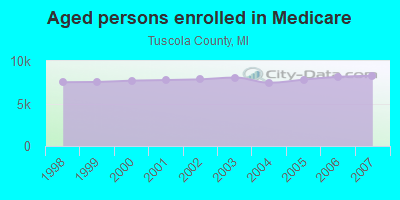
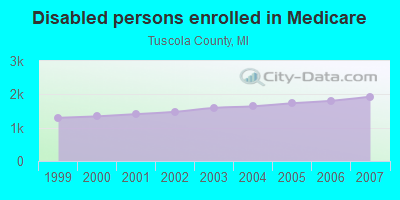
Persons enrolled in hospital insurance and/or supplemental medical insurance (Medicare) in July 1, 2007: 10,192 (8,261 aged, 1,931 disabled)
Children under 18 without health insurance coverage in 2007: 524 (4%)
Most common underlying causes of death in Tuscola County, Michigan in 1999 - 2019:
- Atherosclerotic heart disease (1,387)
- Bronchus or lung, unspecified - Malignant neoplasms (739)
- Acute myocardial infarction, unspecified (665)
- Chronic obstructive pulmonary disease, unspecified (559)
- Congestive heart failure (436)
- Unspecified dementia (348)
- Alzheimer disease, unspecified (344)
- Stroke, not specified as haemorrhage or infarction (282)
- Colon, unspecified - Malignant neoplasms (159)
- Pneumonia, unspecified (155)
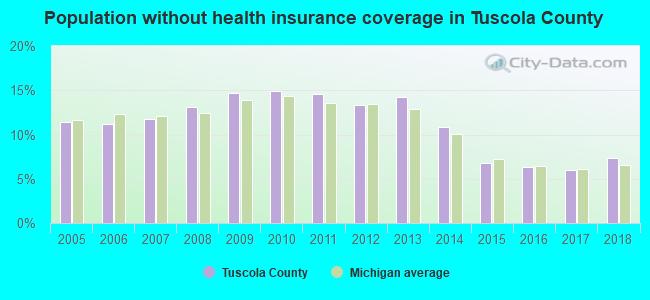
Population without health insurance coverage in 2000: 12%
Children under 18 without health insurance coverage in 2000: 8%
Short term general hospital admissions per 100,000 population in 2004: 2,155
Short term general hospital beds per 100,000 population in 2004: 73
Emergency room visits per 100,000 population in 2004: 22,617
General practice office based MDs per 100,000 population in 2005: 1,059
Medical specialist MDs per 100,000 population in 2005: 849
Dentists per 100,000 population in 1998: 2
Total births per 100,000 population, July 2005 - July 2006 : 29
Total deaths per 100,000 population, July 2005 - July 2006: 36
Limited-service eating places per 100,000 population in 2005 : 9
Suicides per 1,000,000 population from 2000 to 2006: 165.4. This is more than state average.
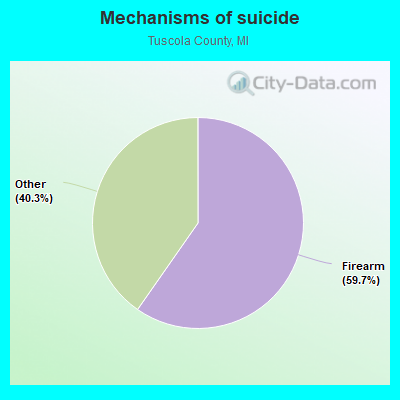
- Firearm - 98.7
- Other - 66.6
Household type by relationship:
Households: 53,092- Male householders: 11,266 (3,133 living alone), Female householders: 10,666 (3,608 living alone)
10,850 spouses (10,778 opposite-sex spouses), 1,865 unmarried partners, (1,849 opposite-sex unmarried partners), 14,103 children (12,697 natural, 340 adopted, 1,064 stepchildren), 957 grandchildren, 272 brothers or sisters, 400 parents, 30 foster children, 494 other relatives, 1,244 non-relatives
- In group quarters: 1,000
Size of family households: 7,209 2-persons, 2,917 3-persons, 2,290 4-persons, 1,052 5-persons, 296 6-persons, 259 7-or-more-persons.
Size of nonfamily households: 6,741 1-person, 983 2-persons, 110 3-persons, 53 4-persons, 36 5-persons.
6,784 married couples with children.
2,498 single-parent households (1,085 men, 1,413 women).
97.1% of residents of Tuscola speak English at home.
1.6% of residents speak Spanish at home (68% speak English very well, 24% speak English well, 4% speak English not well, 4% don't speak English at all).
0.9% of residents speak other Indo-European language at home (87% speak English very well, 11% speak English well, 3% speak English not well).
0.2% of residents speak Asian or Pacific Island language at home (84% speak English very well, 9% speak English well, 8% speak English not well).
0.1% of residents speak other language at home (100% speak English very well).
In fiscal year 2004:
Federal Government expenditure: $313,843,000 ($5,351 per capita)
Department of Defense expenditure: $28,433,000
Federal direct payments to individuals for retirement and disability: $141,771,000
Federal other direct payments to individuals: $68,647,000
Federal direct payments not to individuals: $12,193,000
Federal grants: $53,943,000
Federal procurement contracts: $28,183,000 ($26,002,000 Department of Defense)
Federal salaries and wages: $9,107,000 ($35,000 Department of Defense)
Federal Government direct loans: $3,943,000
Federal guaranteed/insured loans: $27,927,000
Federal Government insurance: $68,787,000
Population change from April 1, 2000 to July 1, 2005:
Births: 3,620| Here: | 62 per 1000 residents |
| State: | 68 per 1000 residents |
Deaths: 2,793
| Here: | 48 per 1000 residents |
| State: | 45 per 1000 residents |
Net international migration: +31
| Here: | +1 per 1000 residents |
| State: | +12 per 1000 residents |
Net internal migration: -621
| Here: | |
| State: |
Total withdrawal of fresh water for public supply: 2.30 millions of gallons per day (all from ground)
| Here: | 6.2 |
| State: | 6.5 |
| Here: | 4.8 |
| State: | 4.3 |
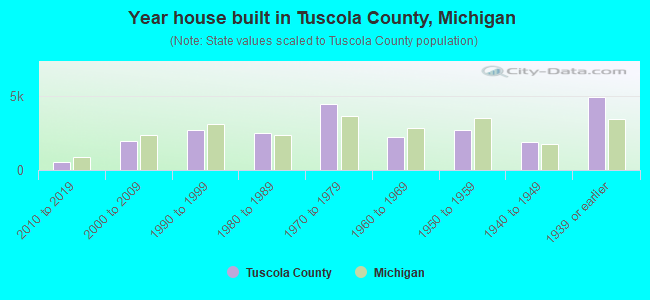
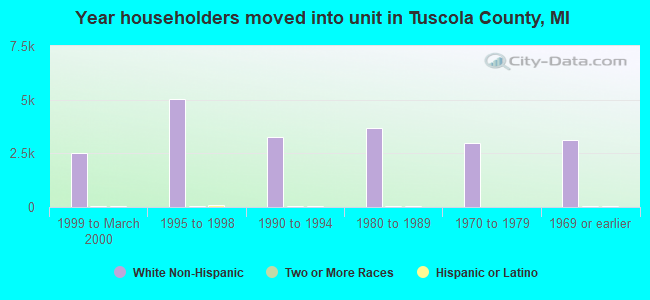
- Year house built in Tuscola County, Michigan
- 122020 or later
- 5802010 to 2019
- 1,8342000 to 2009
- 2,7311990 to 1999
- 2,3811980 to 1989
- 4,6631970 to 1979
- 2,2891960 to 1969
- 2,4871950 to 1959
- 2,0081940 to 1949
- 4,8141939 or earlier
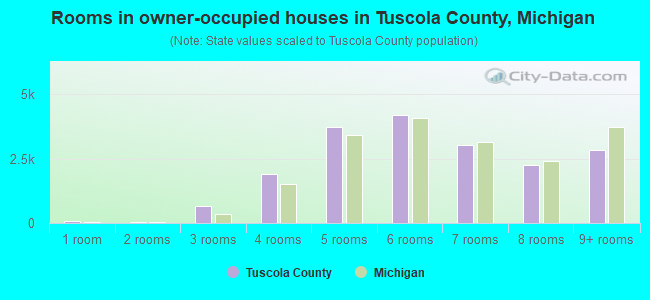
- Rooms in owner-occupied houses in Tuscola County, Michigan
- 381 room
- 162 rooms
- 6193 rooms
- 1,9124 rooms
- 3,8935 rooms
- 4,2176 rooms
- 2,7287 rooms
- 2,4828 rooms
- 2,9239+ rooms
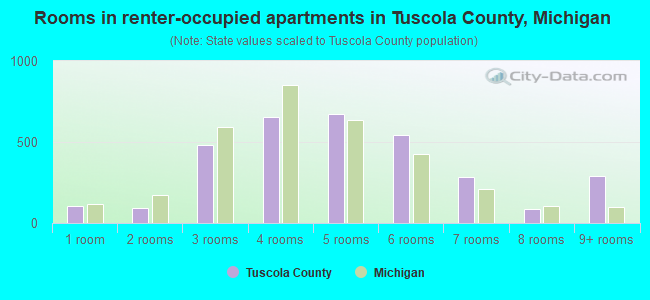
- Rooms in renter-occupied apartments in Tuscola County, Michigan
- 831 room
- 1442 rooms
- 4743 rooms
- 6334 rooms
- 6395 rooms
- 5866 rooms
- 2657 rooms
- 998 rooms
- 2969+ rooms
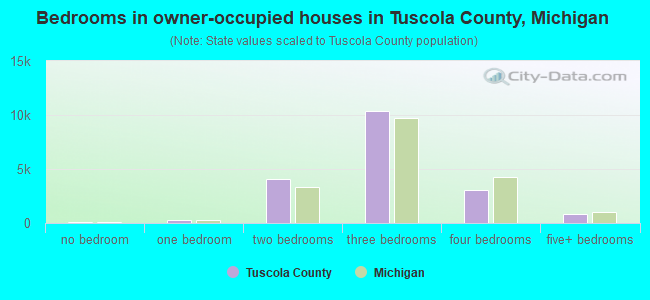
- Bedrooms in owner-occupied houses in Tuscola County, Michigan
- 83no bedroom
- 2721 bedroom
- 4,0032 bedrooms
- 10,6123 bedrooms
- 3,0014 bedrooms
- 8095+ bedrooms
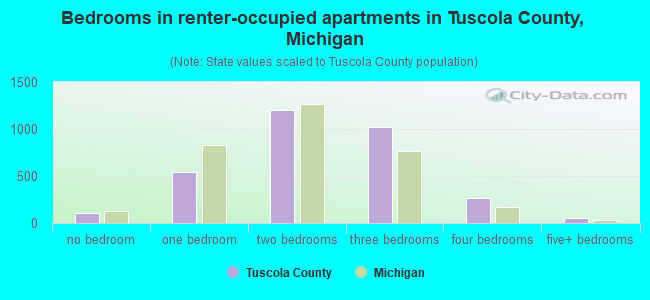
- Bedrooms in renter-occupied apartments in Tuscola County, Michigan
- 89no bedroom
- 6091 bedroom
- 1,1902 bedrooms
- 9603 bedrooms
- 2704 bedrooms
- 1055+ bedrooms
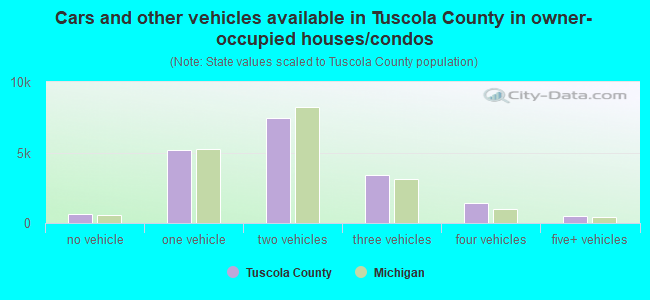
- Cars and other vehicles available in Tuscola County in owner-occupied houses/condos
- 657no vehicle
- 5,2041 vehicle
- 7,3932 vehicles
- 3,5993 vehicles
- 1,3834 vehicles
- 5265+ vehicles
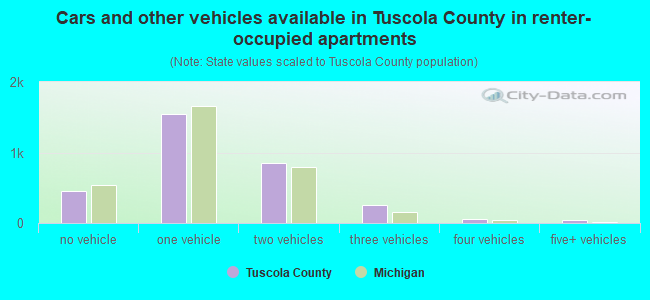
- Cars and other vehicles available in Tuscola County in renter-occupied apartments
- 449no vehicle
- 1,5471 vehicle
- 8562 vehicles
- 2563 vehicles
- 544 vehicles
- 695+ vehicles
91.5% of Tuscola County residents lived in the same house 1 years ago.
Out of people who lived in different houses, 29% lived in this county.
Out of people who lived in different counties, 85% lived in Michigan.
| Tuscola County: | 91.5% |
| State average: | 88.4% |
Place of birth for U.S.-born residents:
- This state: 47,676
- Other state: 4,571
- Northeast: 466
- Midwest: 1,497
- South: 1,849
- West: 747
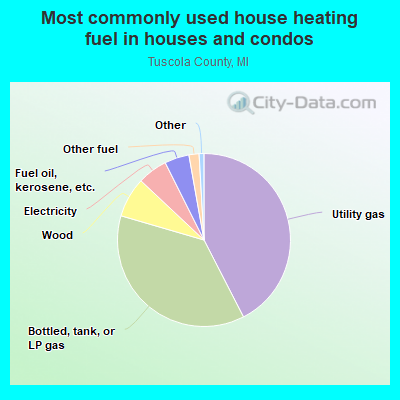
- 41.8%Utility gas
- 37.9%Bottled, tank, or LP gas
- 7.7%Wood
- 6.2%Electricity
- 4.1%Fuel oil, kerosene, etc.
- 1.5%Other fuel
- 0.6%No fuel used
- 0.1%Solar energy
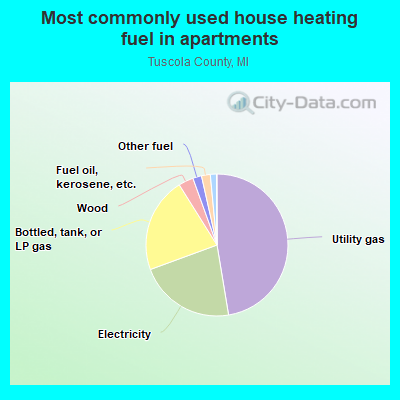
- 47.1%Utility gas
- 23.2%Electricity
- 21.2%Bottled, tank, or LP gas
- 3.5%Wood
- 2.2%Fuel oil, kerosene, etc.
- 1.6%Other fuel
- 1.2%No fuel used
Private vs. public school enrollment:
| Here: | 13.0% |
| Michigan: | 12.4% |
| Here: | 10.9% |
| Michigan: | 9.8% |
| Here: | 11.3% |
| Michigan: | 14.9% |
Tuscola County government finances - Expenditure in 2017:
- Charges - Other: $25,485,000
Solid Waste Management: $60,000
Parks and Recreation: $6,000
- Construction - Regular Highways: $10,319,000
- Current Operations - Public Welfare Institutions: $20,150,000
General - Other: $7,902,000
Regular Highways: $6,186,000
Health - Other: $4,971,000
Judicial and Legal Services: $3,228,000
Police Protection: $2,210,000
Solid Waste Management: $1,187,000
General Public Buildings: $1,130,000
Financial Administration: $799,000
Central Staff Services: $519,000
Natural Resources - Other: $405,000
Protective Inspection and Regulation - Other: $380,000
Correctional Institutions: $134,000
Housing and Community Development: $61,000
Parks and Recreation: $12,000
- Federal Intergovernmental - Other: $4,011,000
Health and Hospitals: $1,944,000
Housing and Community Development: $59,000
- General - Interest on Debt: $780,000
- Local Intergovernmental - Highways: $2,988,000
Other: $1,760,000
- Long Term Debt - Outstanding Unspecified Public Purpose: $28,598,000
Beginning Outstanding - Unspecified Public Purpose: $23,326,000
Issue, Unspecified Public Purpose: $8,362,000
Retired Unspecified Public Purpose: $3,090,000
- Miscellaneous - General Revenue - Other: $924,000
Donations From Private Sources: $532,000
Rents: $399,000
Interest Earnings: $239,000
Fines and Forfeits: $215,000
Sale of Property: $69,000
- Other Capital Outlay - Health - Other: $460,000
General - Other: $413,000
- Other Funds - Cash and Securities: $26,731,000
- State Intergovernmental - Highways: $6,454,000
Other: $1,934,000
General Local Government Support: $1,101,000
- Tax - Property: $14,333,000
Other License: $691,000
Other Selective Sales: $4,000
- Total Salaries and Wages: $7,762,000
Tuscola County government finances - Revenue in 2017:
- Charges - Other: $25,485,000
Solid Waste Management: $60,000
Parks and Recreation: $6,000
- Construction - Regular Highways: $10,319,000
- Current Operations - Public Welfare Institutions: $20,150,000
General - Other: $7,902,000
Regular Highways: $6,186,000
Health - Other: $4,971,000
Judicial and Legal Services: $3,228,000
Police Protection: $2,210,000
Solid Waste Management: $1,187,000
General Public Buildings: $1,130,000
Financial Administration: $799,000
Central Staff Services: $519,000
Natural Resources - Other: $405,000
Protective Inspection and Regulation - Other: $380,000
Correctional Institutions: $134,000
Housing and Community Development: $61,000
Parks and Recreation: $12,000
- Federal Intergovernmental - Other: $4,011,000
Health and Hospitals: $1,944,000
Housing and Community Development: $59,000
- General - Interest on Debt: $780,000
- Local Intergovernmental - Highways: $2,988,000
Other: $1,760,000
- Long Term Debt - Outstanding Unspecified Public Purpose: $28,598,000
Beginning Outstanding - Unspecified Public Purpose: $23,326,000
Issue, Unspecified Public Purpose: $8,362,000
Retired Unspecified Public Purpose: $3,090,000
- Miscellaneous - General Revenue - Other: $924,000
Donations From Private Sources: $532,000
Rents: $399,000
Interest Earnings: $239,000
Fines and Forfeits: $215,000
Sale of Property: $69,000
- Other Capital Outlay - Health - Other: $460,000
General - Other: $413,000
- Other Funds - Cash and Securities: $26,731,000
- State Intergovernmental - Highways: $6,454,000
Other: $1,934,000
General Local Government Support: $1,101,000
- Tax - Property: $14,333,000
Other License: $691,000
Other Selective Sales: $4,000
- Total Salaries and Wages: $7,762,000
Tuscola County government finances - Debt in 2017:
- Charges - Other: $25,485,000
Solid Waste Management: $60,000
Parks and Recreation: $6,000
- Construction - Regular Highways: $10,319,000
- Current Operations - Public Welfare Institutions: $20,150,000
General - Other: $7,902,000
Regular Highways: $6,186,000
Health - Other: $4,971,000
Judicial and Legal Services: $3,228,000
Police Protection: $2,210,000
Solid Waste Management: $1,187,000
General Public Buildings: $1,130,000
Financial Administration: $799,000
Central Staff Services: $519,000
Natural Resources - Other: $405,000
Protective Inspection and Regulation - Other: $380,000
Correctional Institutions: $134,000
Housing and Community Development: $61,000
Parks and Recreation: $12,000
- Federal Intergovernmental - Other: $4,011,000
Health and Hospitals: $1,944,000
Housing and Community Development: $59,000
- General - Interest on Debt: $780,000
- Local Intergovernmental - Highways: $2,988,000
Other: $1,760,000
- Long Term Debt - Outstanding Unspecified Public Purpose: $28,598,000
Beginning Outstanding - Unspecified Public Purpose: $23,326,000
Issue, Unspecified Public Purpose: $8,362,000
Retired Unspecified Public Purpose: $3,090,000
- Miscellaneous - General Revenue - Other: $924,000
Donations From Private Sources: $532,000
Rents: $399,000
Interest Earnings: $239,000
Fines and Forfeits: $215,000
Sale of Property: $69,000
- Other Capital Outlay - Health - Other: $460,000
General - Other: $413,000
- Other Funds - Cash and Securities: $26,731,000
- State Intergovernmental - Highways: $6,454,000
Other: $1,934,000
General Local Government Support: $1,101,000
- Tax - Property: $14,333,000
Other License: $691,000
Other Selective Sales: $4,000
- Total Salaries and Wages: $7,762,000
Tuscola County government finances - Cash and Securities in 2017:
- Charges - Other: $25,485,000
Solid Waste Management: $60,000
Parks and Recreation: $6,000
- Construction - Regular Highways: $10,319,000
- Current Operations - Public Welfare Institutions: $20,150,000
General - Other: $7,902,000
Regular Highways: $6,186,000
Health - Other: $4,971,000
Judicial and Legal Services: $3,228,000
Police Protection: $2,210,000
Solid Waste Management: $1,187,000
General Public Buildings: $1,130,000
Financial Administration: $799,000
Central Staff Services: $519,000
Natural Resources - Other: $405,000
Protective Inspection and Regulation - Other: $380,000
Correctional Institutions: $134,000
Housing and Community Development: $61,000
Parks and Recreation: $12,000
- Federal Intergovernmental - Other: $4,011,000
Health and Hospitals: $1,944,000
Housing and Community Development: $59,000
- General - Interest on Debt: $780,000
- Local Intergovernmental - Highways: $2,988,000
Other: $1,760,000
- Long Term Debt - Outstanding Unspecified Public Purpose: $28,598,000
Beginning Outstanding - Unspecified Public Purpose: $23,326,000
Issue, Unspecified Public Purpose: $8,362,000
Retired Unspecified Public Purpose: $3,090,000
- Miscellaneous - General Revenue - Other: $924,000
Donations From Private Sources: $532,000
Rents: $399,000
Interest Earnings: $239,000
Fines and Forfeits: $215,000
Sale of Property: $69,000
- Other Capital Outlay - Health - Other: $460,000
General - Other: $413,000
- Other Funds - Cash and Securities: $26,731,000
- State Intergovernmental - Highways: $6,454,000
Other: $1,934,000
General Local Government Support: $1,101,000
- Tax - Property: $14,333,000
Other License: $691,000
Other Selective Sales: $4,000
- Total Salaries and Wages: $7,762,000
Supplemental Security Income (SSI) in 2006:
- Total number of recipients: 1,157
- Number of aged recipients: 47
- Number of blind and disabled recipients: 1,110
- Number of recipients under 18: 205
- Number of recipients between 18 and 64: 812
- Number of recipients older than 64: 140
- Number of recipients also receiving OASDI: 387
- Amount of payments (thousands of dollars): 548
| Most common first names in Tuscola County, MI among deceased individuals | ||
| Name | Count | Lived (average) |
|---|---|---|
| John | 370 | 75.4 years |
| Mary | 307 | 80.4 years |
| William | 304 | 75.5 years |
| Robert | 261 | 69.8 years |
| George | 225 | 76.6 years |
| Charles | 208 | 74.9 years |
| James | 200 | 72.5 years |
| Helen | 172 | 80.7 years |
| Donald | 141 | 69.9 years |
| Harold | 138 | 74.9 years |
| Most common last names in Tuscola County, MI among deceased individuals | ||
| Last name | Count | Lived (average) |
|---|---|---|
| Smith | 147 | 74.9 years |
| Brown | 75 | 74.8 years |
| Miller | 72 | 77.6 years |
| Johnson | 57 | 73.5 years |
| Wilson | 53 | 76.4 years |
| Taylor | 51 | 74.9 years |
| Martin | 46 | 72.9 years |
| Campbell | 46 | 75.3 years |
| Spencer | 44 | 75.8 years |
| Wright | 42 | 76.9 years |
| Businesses in Tuscola County, MI | ||||
| Name | Count | Name | Count | |
|---|---|---|---|---|
| AT&T | 2 | La-Z-Boy | 1 | |
| Ace Hardware | 1 | Little Caesars Pizza | 3 | |
| Advance Auto Parts | 1 | MasterBrand Cabinets | 11 | |
| AutoZone | 1 | McDonald's | 3 | |
| Burger King | 1 | Pizza Hut | 1 | |
| Chevrolet | 4 | RadioShack | 2 | |
| Curves | 2 | Rite Aid | 2 | |
| DHL | 1 | Sears | 1 | |
| Dairy Queen | 1 | Subway | 6 | |
| Fashion Bug | 1 | Taco Bell | 1 | |
| FedEx | 2 | True Value | 3 | |
| Ford | 1 | U-Haul | 3 | |
| GNC | 1 | UPS | 4 | |
| Goodwill | 4 | Walmart | 1 | |
| H&R Block | 3 | Wendy's | 1 | |
| KFC | 1 | |||
Tuscola County on our top lists:
- #23 on the list of "Top 101 counties with the largest increase in the number of deaths per 1000 residents 2000-2006 to 2007-2013 (pop. 50,000+)"
- #35 on the list of "Top 101 counties with the lowest total withdrawal of fresh water for public supply (pop. 50,000+)"