Crime rate in Fort Worth, Texas (TX): murders, rapes, robberies, assaults, burglaries, thefts, auto thefts, arson, law enforcement employees, police officers, crime map
Crime rate in Fort Worth, TX
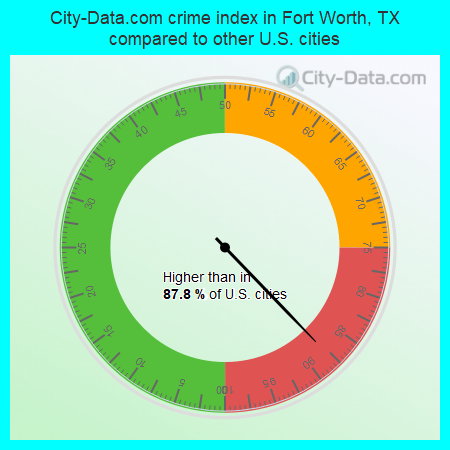
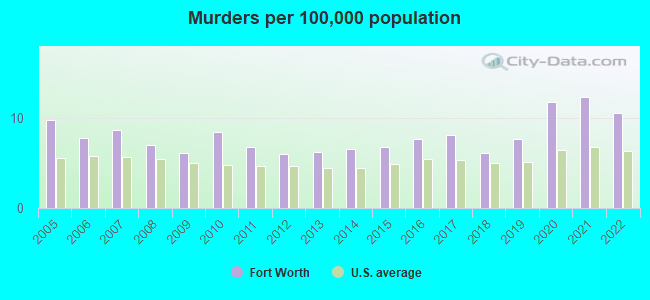
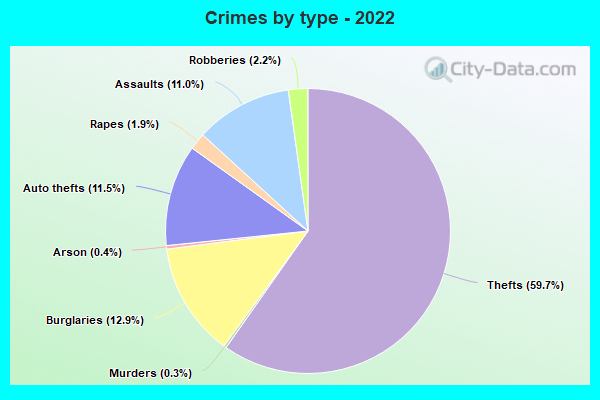
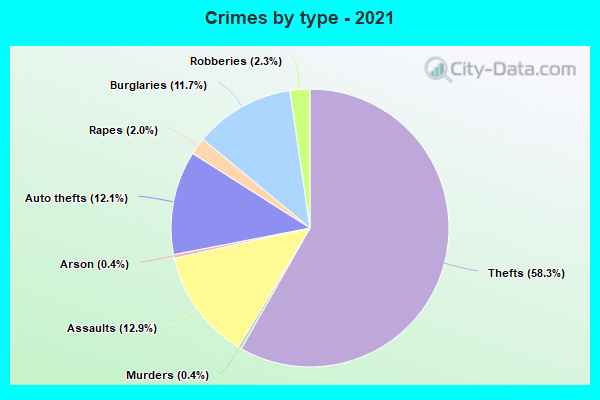
The 2022 crime rate in Fort Worth, TX is 301 (City-Data.com crime index), which is 1.2 times higher than the U.S. average. It was higher than in 87.8% U.S. cities. The 2022 Fort Worth crime rate fell by 4% compared to 2021. The number of homicides stood at 100 - a decrease of 17 compared to 2021. In the last 5 years Fort Worth has seen increasing violent crime and decreasing property crime.See how dangerous Fort Worth, TX is compared to the nearest cities:
(Note: Higher means more crime)
(Note: Higher means more crime)
| Fort Worth: | 301.3 |
| River Oaks: | 222.0 |
| Westover Hills: | 221.0 |
| Westworth Village: | 297.6 |
| Sansom Park: | 337.7 |
| Haltom City: | 131.6 |
| Forest Hill: | 284.8 |
| White Settlement: | 233.0 |
| Lake Worth: | 549.9 |
The City-Data.com crime index weighs serious crimes and violent crimes more heavily. Higher means more crime, U.S. average is 246.1. It adjusts for the number of visitors and daily workers commuting into cities.
- means the value is smaller than the state average.- means the value is about the same as the state average.
- means the value is bigger than the state average.
- means the value is much bigger than the state average.
According to our research of Texas and other state lists, there were 3,169 registered sex offenders living in Fort Worth, Texas as of April 26, 2024.
The ratio of all residents to sex offenders in Fort Worth is 270 to 1.
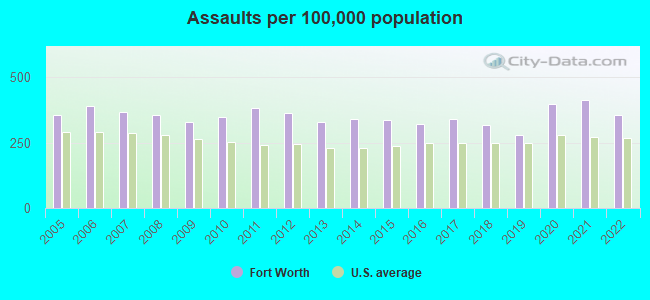
Violent crime rate in 2022
| Fort Worth: | 298.1 |
| U.S. Average: | 219.8 |
Violent crime rate in 2021
| Fort Worth: | 332.4 |
| U.S. Average: | 224.8 |
Violent crime rate in 2020
| Fort Worth: | 327.6 |
| U.S. Average: | 228.2 |
Violent crime rate in 2019
| Fort Worth: | 268.3 |
| U.S. Average: | 219.9 |
Violent crime rate in 2018
| Fort Worth: | 296.8 |
| U.S. Average: | 221.2 |
Violent crime rate in 2017
| Fort Worth: | 332.1 |
| U.S. Average: | 226.2 |
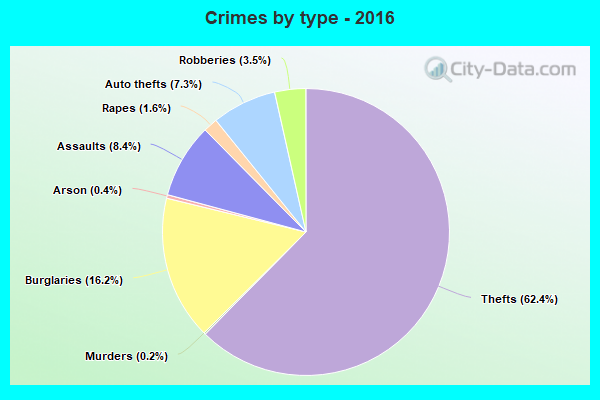
Violent crime rate in 2016
| Fort Worth: | 307.6 |
| U.S. Average: | 227.3 |
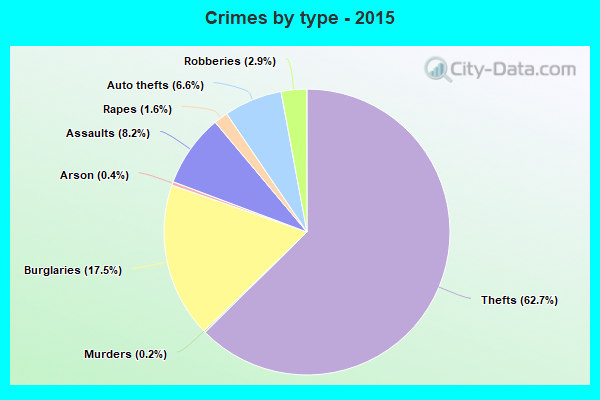
Violent crime rate in 2015
| Fort Worth: | 306.7 |
| U.S. Average: | 219.3 |
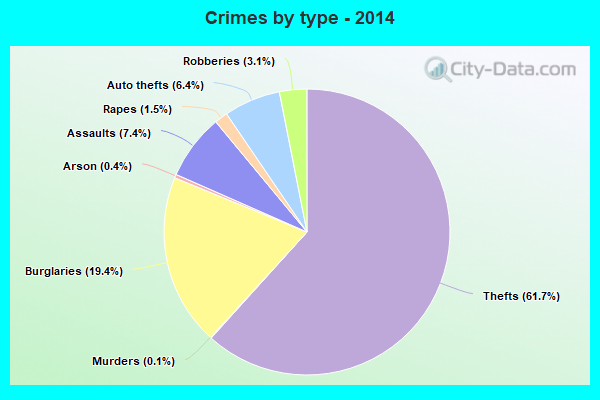
Violent crime rate in 2014
| Fort Worth: | 324.3 |
| U.S. Average: | 211.1 |
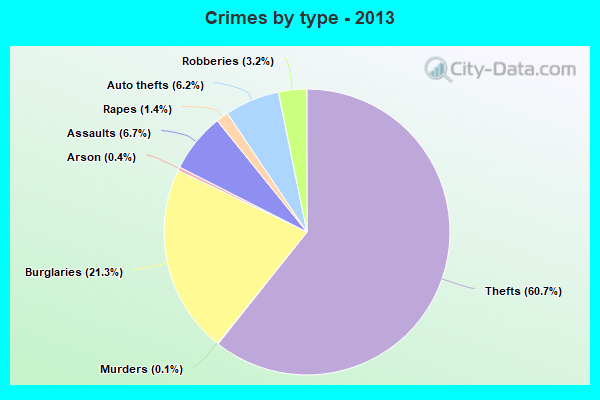
Violent crime rate in 2013
| Fort Worth: | 324.4 |
| U.S. Average: | 214.2 |
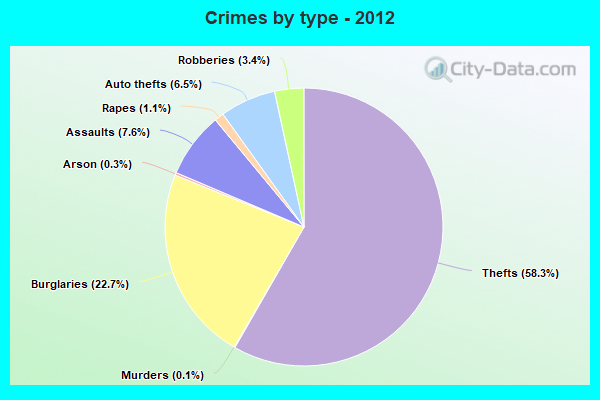
Violent crime rate in 2012
| Fort Worth: | 328.2 |
| U.S. Average: | 187.4 |
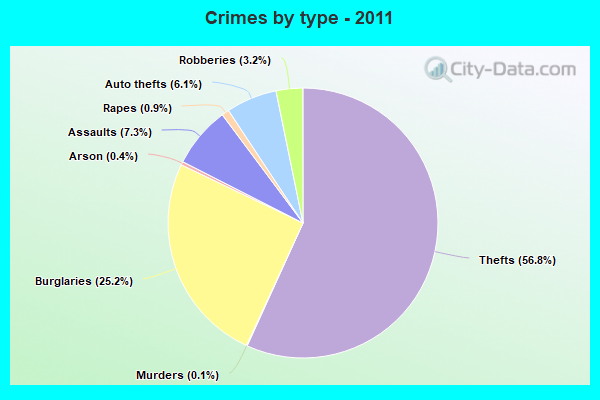
Violent crime rate in 2011
| Fort Worth: | 336.0 |
| U.S. Average: | 187.1 |
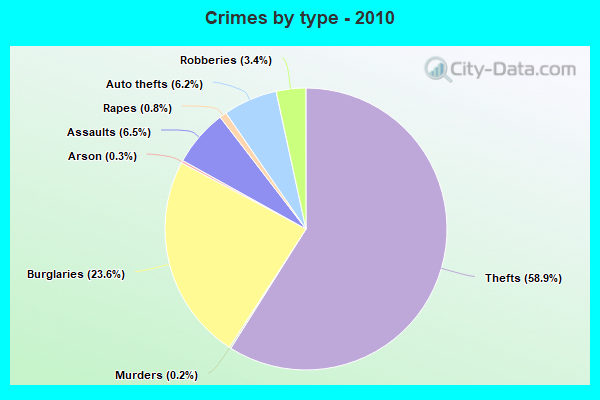
Violent crime rate in 2010
| Fort Worth: | 324.8 |
| U.S. Average: | 195.7 |
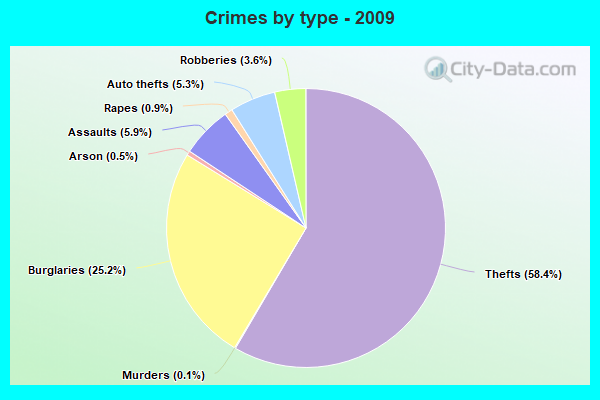
Violent crime rate in 2009
| Fort Worth: | 328.7 |
| U.S. Average: | 208.9 |
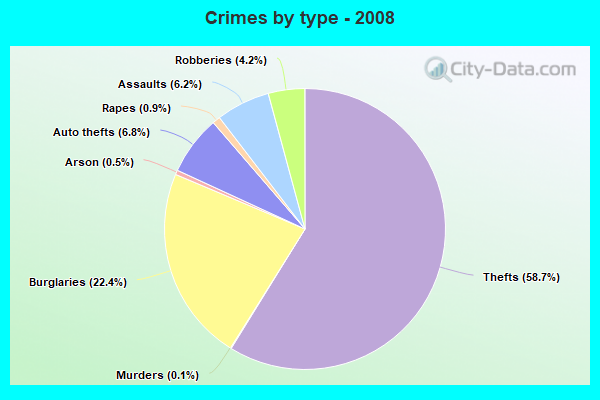
Violent crime rate in 2008
| Fort Worth: | 366.9 |
| U.S. Average: | 222.5 |
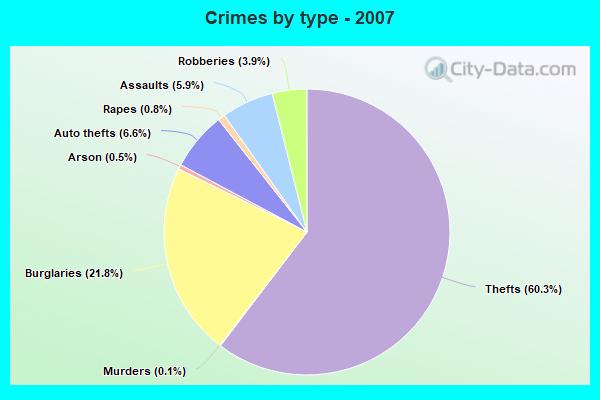
Violent crime rate in 2007
| Fort Worth: | 327.7 |
| U.S. Average: | 229.1 |
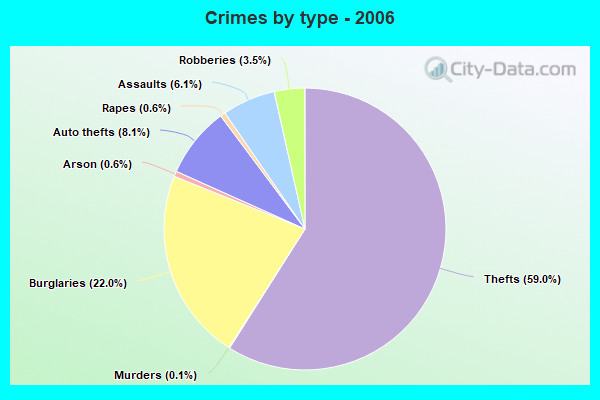
Violent crime rate in 2006
| Fort Worth: | 317.3 |
| U.S. Average: | 232.6 |
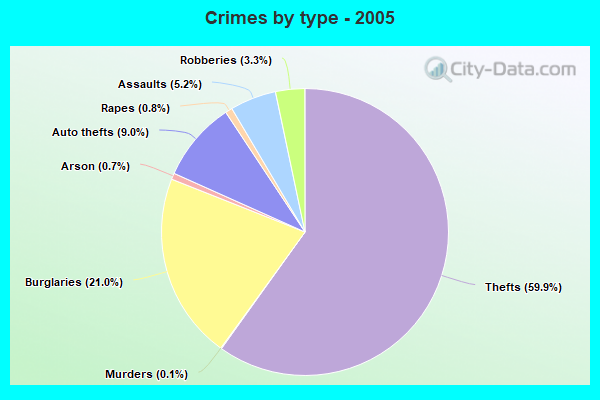
Violent crime rate in 2005
| Fort Worth: | 317.0 |
| U.S. Average: | 227.0 |
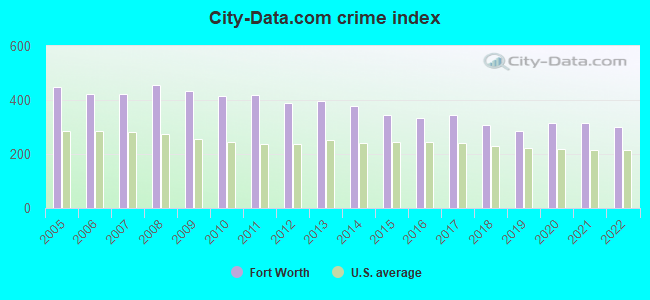
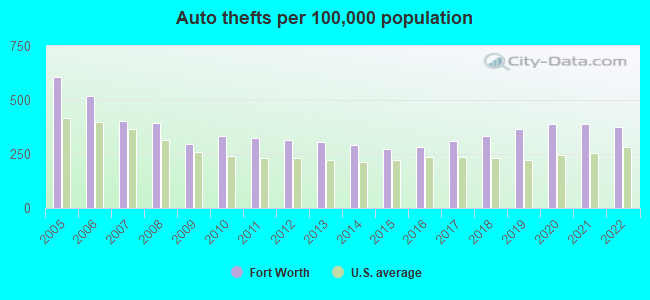
Property crime rate in 2022
| Fort Worth: | 237.6 |
| U.S. Average: | 166.5 |
Property crime rate in 2021
| Fort Worth: | 227.1 |
| U.S. Average: | 157.8 |
Property crime rate in 2020
| Fort Worth: | 235.1 |
| U.S. Average: | 169.6 |
Property crime rate in 2019
| Fort Worth: | 236.3 |
| U.S. Average: | 179.7 |
Property crime rate in 2018
| Fort Worth: | 252.5 |
| U.S. Average: | 190.2 |
Property crime rate in 2017
| Fort Worth: | 280.6 |
| U.S. Average: | 206.4 |
Property crime rate in 2016
| Fort Worth: | 287.6 |
| U.S. Average: | 216.6 |
Property crime rate in 2015
| Fort Worth: | 316.1 |
| U.S. Average: | 221.5 |
Property crime rate in 2014
| Fort Worth: | 362.1 |
| U.S. Average: | 230.8 |
Property crime rate in 2013
| Fort Worth: | 406.2 |
| U.S. Average: | 250.4 |
Property crime rate in 2012
| Fort Worth: | 407.2 |
| U.S. Average: | 267.3 |
Property crime rate in 2011
| Fort Worth: | 464.2 |
| U.S. Average: | 273.5 |
Property crime rate in 2010
| Fort Worth: | 459.6 |
| U.S. Average: | 276.4 |
Property crime rate in 2009
| Fort Worth: | 489.1 |
| U.S. Average: | 285.6 |
Property crime rate in 2008
| Fort Worth: | 483.9 |
| U.S. Average: | 302.2 |
Property crime rate in 2007
| Fort Worth: | 454.8 |
| U.S. Average: | 309.2 |
Property crime rate in 2006
| Fort Worth: | 480.9 |
| U.S. Average: | 317.3 |
Property crime rate in 2005
| Fort Worth: | 508.0 |
| U.S. Average: | 322.3 |
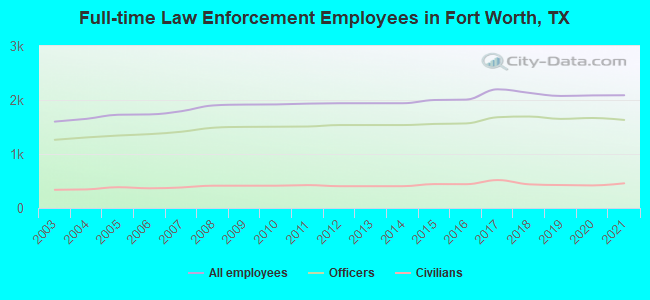
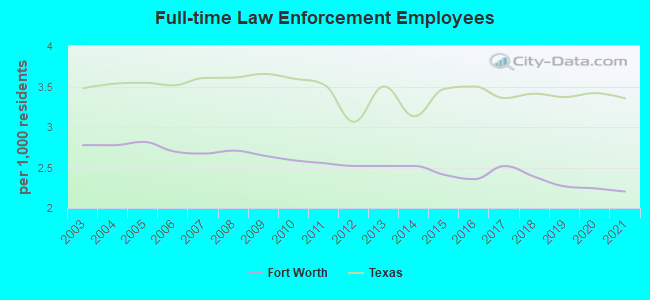
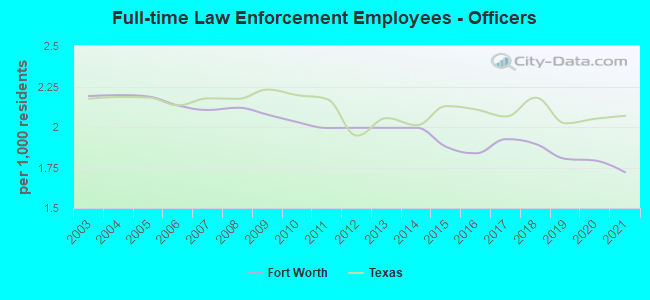
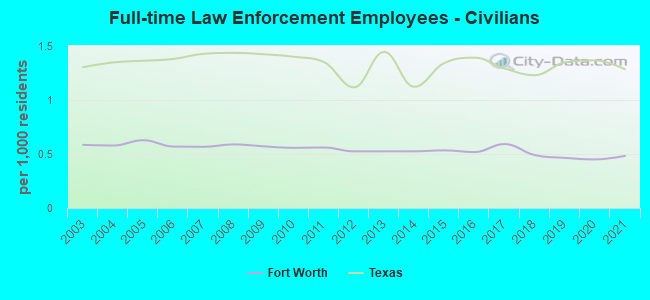
Full-time law enforcement employees in 2021, including police officers: 2,088 (1,631 officers - 1,416 male; 215 female).
| Officers per 1,000 residents here: | 1.72 |
| Texas average: | 2.07 |
Full-time law enforcement employees in 2020, including police officers: 2,085 (1,667 officers - 1,450 male; 217 female).
| Officers per 1,000 residents here: | 1.79 |
| Texas average: | 2.05 |
Full-time law enforcement employees in 2019, including police officers: 2,075 (1,650 officers - 1,437 male; 213 female).
| Officers per 1,000 residents here: | 1.80 |
| Texas average: | 2.02 |
Full-time law enforcement employees in 2018, including police officers: 2,132 (1,694 officers - 1,470 male; 224 female).
| Officers per 1,000 residents here: | 1.90 |
| Texas average: | 2.18 |
Full-time law enforcement employees in 2017, including police officers: 2,198 (1,681 officers - 1,459 male; 222 female).
| Officers per 1,000 residents here: | 1.93 |
| Texas average: | 2.06 |
Full-time law enforcement employees in 2016, including police officers: 2,007 (1,566 officers - 1,359 male; 207 female).
| Officers per 1,000 residents here: | 1.84 |
| Texas average: | 2.11 |
Full-time law enforcement employees in 2015, including police officers: 2,000 (1,557 officers - 1,339 male; 218 female).
| Officers per 1,000 residents here: | 1.88 |
| Texas average: | 2.13 |
Full-time law enforcement employees in 2012, including police officers: 1,940 (1,536 officers - 1,304 male; 232 female).
| Officers per 1,000 residents here: | 1.99 |
| Texas average: | 1.95 |
Full-time law enforcement employees in 2011, including police officers: 1,933 (1,509 officers - 1,278 male; 231 female).
| Officers per 1,000 residents here: | 1.99 |
| Texas average: | 2.17 |
Full-time law enforcement employees in 2010, including police officers: 1,918 (1,505 officers - 1,272 male; 233 female).
| Officers per 1,000 residents here: | 2.03 |
| Texas average: | 2.20 |
Full-time law enforcement employees in 2009, including police officers: 1,915 (1,502 officers - 1,264 male; 238 female).
| Officers per 1,000 residents here: | 2.08 |
| Texas average: | 2.23 |
Full-time law enforcement employees in 2008, including police officers: 1,899 (1,486 officers - 1,242 male; 244 female).
| Officers per 1,000 residents here: | 2.12 |
| Texas average: | 2.17 |
Full-time law enforcement employees in 2007, including police officers: 1,792 (1,412 officers - 1,178 male; 234 female).
| Officers per 1,000 residents here: | 2.11 |
| Texas average: | 2.18 |
Full-time law enforcement employees in 2006, including police officers: 1,733 (1,368 officers - 1,145 male; 223 female).
| Officers per 1,000 residents here: | 2.13 |
| Texas average: | 2.13 |
Full-time law enforcement employees in 2005, including police officers: 1,727 (1,342 officers - 1,125 male; 217 female).
| Officers per 1,000 residents here: | 2.19 |
| Texas average: | 2.18 |
Full-time law enforcement employees in 2004, including police officers: 1,651 (1,307 officers - 1,099 male; 208 female).
| Officers per 1,000 residents here: | 2.20 |
| Texas average: | 2.19 |
Full-time law enforcement employees in 2003, including police officers: 1,600 (1,263 officers - 1,057 male; 206 female).
| Officers per 1,000 residents here: | 2.19 |
| Texas average: | 2.17 |
Zip codes: 76052, 76102, 76103, 76104, 76105, 76106, 76107, 76108, 76110, 76111, 76114, 76115, 76117, 76118, 76123, 76127, 76129, 76133, 76135, 76137, 76148, 76164, 76177, 76244, 76248.