Alorton: Fire Incidents, Illinois (IL)
Where are fire incidents reported in Alorton, IL
Something went wrong! Please refresh the page.
| Fire incidents reported | |
|---|---|
| Sreet name | Count |
| CONVERSE | 64 |
| BOND AVE | 62 |
| BROADWAY | 58 |
| CONVERSE AVE | 54 |
| GREYSTONE DR | 36 |
| WALNUT | 36 |
| MCCASLAND AVE | 32 |
| GRAND ST | 28 |
| RACEHORSE DR | 28 |
| BRADY AVE | 26 |
| OLD MISSOURI AVE | 26 |
| JARVIS | 22 |
| MCCASLAND | 20 |
| OLD MISSOURI | 20 |
| BRADY | 18 |
| GRAND | 18 |
| 39TH ST | 16 |
| BOND | 16 |
| 42ND ST | 14 |
| MARKET AVE | 14 |
| BOND AVE | 12 |
| BROADWAY ST | 12 |
| GRAND AVE | 12 |
| JARVIS PL | 12 |
| MC CASLAND | 10 |
| MCCAUSLAND | 10 |
| 40TH ST | 8 |
| 50TH | 8 |
| 50TH ST | 8 |
| 55TH ST | 8 |
| Other | 26 |
2002 - 2018 National Fire Incident Reporting System (NFIRS) incidents
- Incident types reported to NFIRS in Alorton, IL
- 73458.1%Fire
- 21316.9%Hazardous Condition
- 13710.8%Rescue & EMS
- 705.5%Good Intent Call
- 554.4%Service Call
- 544.3%False Alarm
- Fire incident types reported to NFIRS in Alorton, IL
- 47464.6%Structure Fires
- 15821.5%Outside Fires
- 679.1%Mobile Property/Vehicle Fires
- 354.8%Other
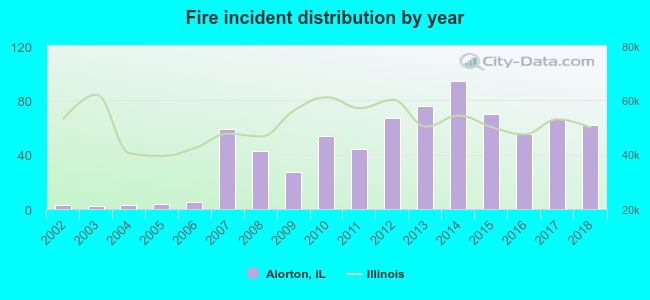 Based on the data from the years 2002 - 2018 the average number of fires per year is 43. The highest number of fire incidents - 94 took place in 2014, and the least - 2 in 2003. The data has a rising trend.
 The median response time based on all reported fire incidents is 5 minutes. This is similar to the state median value.
The median response time in Alorton, IL compared to nearest cities:
(Note: Based on data for all years, including only cities with at least 500 fire incidents)
| Alorton: | 5 minutes |
| Centreville: | 7 minutes |
| East St. Louis: | 6 minutes |
| Cahokia: | 7 minutes |
| Washington Park: | 5 minutes |
| Caseyville: | 6 minutes |
| Fairview Heights: | 5 minutes |
| Dupo: | 5 minutes |
| Madison: | 6 minutes |
 50.4% incidents where reported in the morning and 49.6% in the evening. The most fires (15.9%) took place on Saturday, and the least (12.5%) on Sunday.
 Based on the 734 reports from years 2002 - 2018 most fires (13.5%) took place during July, and the least (5.4%) in February.
 Out of all 1,264 cases reported during the years 2002 - 2018, the most belonged to the categories: Fire (58.1%), Rescue & EMS (16.9%), and Overpressure Rupture (10.8%).
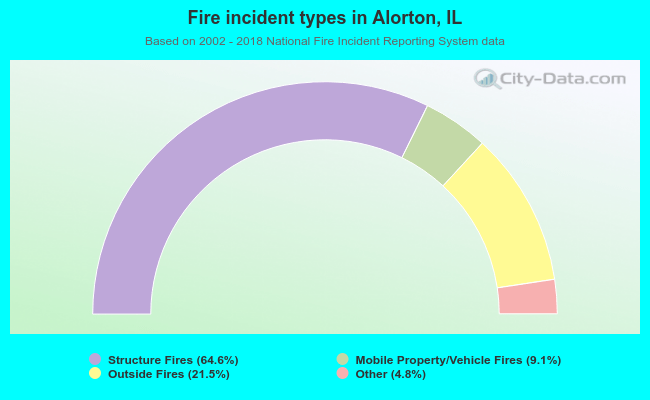 When looking into fire subcategories, the most incidents belonged to: Structure Fires (64.6%), and Outside Fires (21.5%).