Fairview Heights: Fire Incidents, Illinois (IL)
Where are fire incidents reported in Fairview Heights, IL
Something went wrong! Please refresh the page.
| Fire incidents reported | |
|---|---|
| Sreet name | Count |
| ILLINOIS ST | 272 |
| LINCOLN TRL | 106 |
| LUDWIG DR | 92 |
| I-64 | 76 |
| BUNKUM RD | 70 |
| I64 | 68 |
| UNION HILL RD | 46 |
| ST. CLAIR SQ. | 44 |
| CIRCLE DR | 42 |
| OLD LINCOLN TRL | 42 |
| WINCHESTER PL | 36 |
| LINCOLN HWY | 34 |
| CREST DR | 26 |
| OLD COLLINSVILLE RD | 26 |
| HOLY CROSS RD | 24 |
| ILLINOIS | 24 |
| JOSEPH DR | 24 |
| LINCOLN TRAIL | 22 |
| PHILLIPS DR | 22 |
| POTOMAC DR | 20 |
| SALEM PL | 20 |
| FAIRVIEW DR | 18 |
| ST CLAIR AVE | 18 |
| OLD COLLINSVILLE ROAD | 16 |
| I.64 | 14 |
| MONTICELLO PL | 14 |
| NORTH RD | 14 |
| RIDGE HEIGHTS RD | 14 |
| COMMERCE LANE | 12 |
| CONCORD DR | 12 |
| Other | 173 |
2002 - 2018 National Fire Incident Reporting System (NFIRS) incidents
- Incident types reported to NFIRS in Fairview Heights, IL
- 1,44127.1%Fire
- 1,31124.7%Hazardous Condition
- 1,11521.0%False Alarm
- 68212.8%Service Call
- 60111.3%Good Intent Call
- 1552.9%Rescue & EMS
- 100.2%Severe Weather
- Fire incident types reported to NFIRS in Fairview Heights, IL
- 64945.0%Structure Fires
- 47132.7%Outside Fires
- 28419.7%Mobile Property/Vehicle Fires
- 372.6%Other
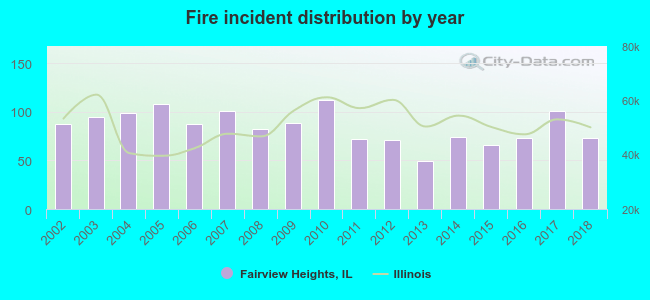 According to the data from the years 2002 - 2018 the average number of fire incidents per year is 85. The highest number of fires - 112 took place in 2010, and the least - 49 in 2013. The data has a declining trend.
The average number of yearly fire incidents per 10k residents in Fairview Heights, IL compared to nearest cities:
(Note: Based on data for the last 3 years, including only cities with population 5,000 and above)
| Fairview Heights: | 48.7 |
| Swansea: | 29.8 |
| Belleville: | 74.5 |
| Shiloh: | 5.4 |
| Collinsville: | 53.9 |
| Centreville: | 233.1 |
| Maryville: | 3.8 |
| Pontoon Beach: | 67.6 |
| Cahokia: | 146.7 |
 The median response time based on all reported fire incidents is 5 minutes. This is about the same as the state median value.
The median response time in Fairview Heights, IL compared to nearest cities:
(Note: Based on data for all years, including only cities with at least 500 fire incidents)
| Fairview Heights: | 5 minutes |
| Caseyville: | 6 minutes |
| Swansea: | 5 minutes |
| Belleville: | 4 minutes |
| Collinsville: | 5 minutes |
| Centreville: | 7 minutes |
| Washington Park: | 5 minutes |
| Alorton: | 5 minutes |
| East St. Louis: | 6 minutes |
 Based on the reports from the years 2002 - 2018 the average number of fire-related fatalities per year is 0. The highest number of reported deaths - 1 took place in 2009, and the lowest - 0 in 2002. The data has a constant trend.
 Based on the reports from the years 2002 - 2018 the average number of fire-related yearly casualties is 1. The highest number of injuries - 7 took place in 2006, and the lowest - 0 in 2002. The data has a rising trend.
The average number of casualties per 1,000 fire incidents is 17. This indicator was the highest - 80 in 2006, and the lowest 0 in 2002. The trend for casualties per 1,000 fires is increasing. Compared to the state value the number of casualties per 1,000 incidents is higher.
Based on the reports from the years 2002 - 2018 the average number of fire-related yearly casualties is 1. The highest number of injuries - 7 took place in 2006, and the lowest - 0 in 2002. The data has a rising trend.
The average number of casualties per 1,000 fire incidents is 17. This indicator was the highest - 80 in 2006, and the lowest 0 in 2002. The trend for casualties per 1,000 fires is increasing. Compared to the state value the number of casualties per 1,000 incidents is higher.Casualties per 1,000 incidents in Fairview Heights, IL compared to nearest cities:
(Note: Based on data for all years, including only cities with at least 500 fire incidents)
| Fairview Heights: | 17.3 |
| Caseyville: | 1.5 |
| Swansea: | 2.6 |
| Belleville: | 12.5 |
| Collinsville: | 16.9 |
| Centreville: | 0.0 |
| Washington Park: | 3.0 |
| Alorton: | 0.0 |
| East St. Louis: | 2.3 |
 29.0% incidents where reported in the morning and 71.0% in the evening. The most fires (17.9%) took place on Saturday, and the least (11.4%) on Friday.
 According to the 1,441 reports from years 2002 - 2018 most fires (13.4%) took place during March, and the least (6.5%) in October.
 Out of all 5,318 cases reported during the years 2002 - 2018, the most belonged to the categories: Fire (27.1%), Hazardous Condition (24.7%), and False Alarm (21.0%).
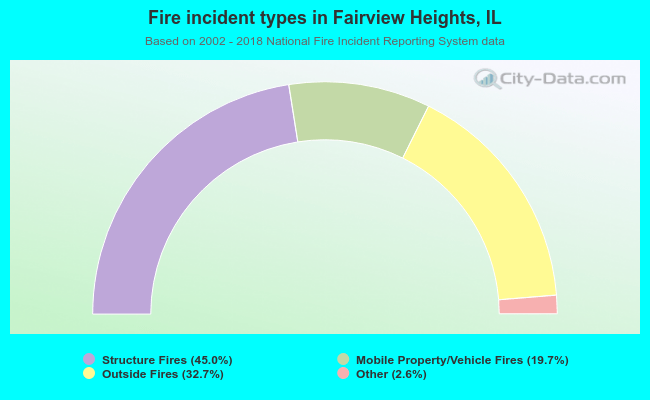 When looking into fire subcategories, the most incidents belonged to: Structure Fires (45.0%), and Outside Fires (32.7%).