Alton: Fire Incidents, Texas (TX)
Where are fire incidents reported in Alton, TX
Something went wrong! Please refresh the page.
|
| |||||||||||||||||||||||||||||||||||||||||||||||||||||||||||||||||||||||||||||||||||||||||||||||||||||||||||||
| Other | 61 | |||||||||||||||||||||||||||||||||||||||||||||||||||||||||||||||||||||||||||||||||||||||||||||||||||||||||||||
2002 - 2018 National Fire Incident Reporting System (NFIRS) incidents
- Incident types reported to NFIRS in Alton, TX
- 26574.6%Fire
- 5314.9%Service Call
- 154.2%Good Intent Call
- 123.4%Hazardous Condition
- 92.5%Rescue & EMS
- 10.3%False Alarm
- Fire incident types reported to NFIRS in Alton, TX
- 19573.6%Outside Fires
- 5821.9%Structure Fires
- 72.6%Mobile Property/Vehicle Fires
- 51.9%Other
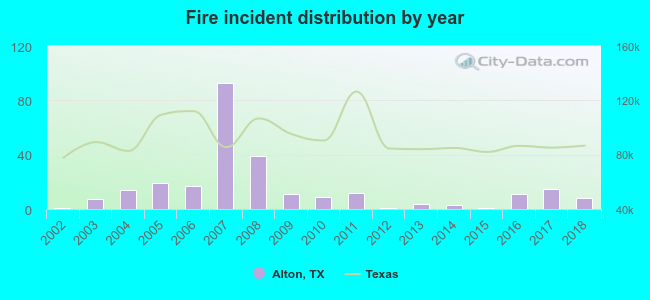 Based on the data from the years 2002 - 2018 the average number of fire incidents per year is 16. The highest number of fires - 93 took place in 2007, and the least - 1 in 2002. The data has a rising trend.
The average number of yearly fire incidents per 10k residents in Alton, TX compared to nearest cities:
(Note: Based on data for the last 3 years, including only cities with population 5,000 and above)
| Alton: | 7.3 |
| Mission: | 27.3 |
| Palmview: | 88.9 |
| McAllen: | 22.8 |
| Edinburg: | 37.3 |
| Pharr: | 4.1 |
| San Juan: | 19.7 |
| Hidalgo: | 2.0 |
| Alamo: | 70.4 |
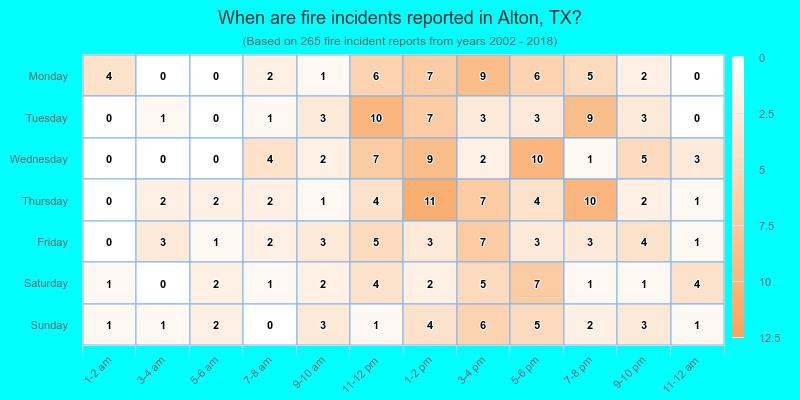
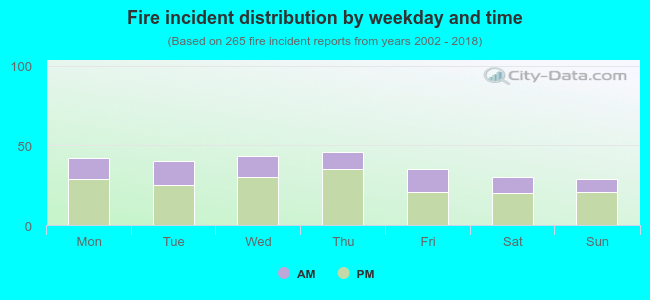 31.7% incidents where reported in the morning and 68.3% in the evening. The most fires (17.4%) took place on Thursday, and the least (10.9%) on Sunday.
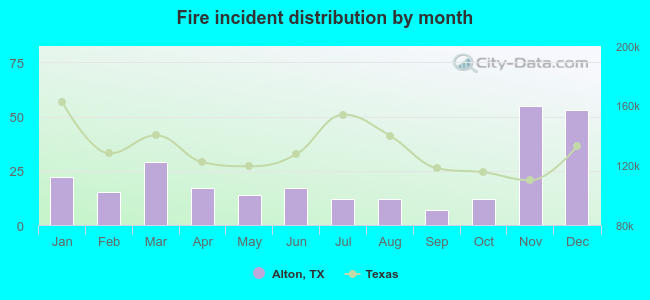 According to the 265 fire incident reports from years 2002 - 2018 most fires (20.8%) took place during November, and the least (2.6%) in September.
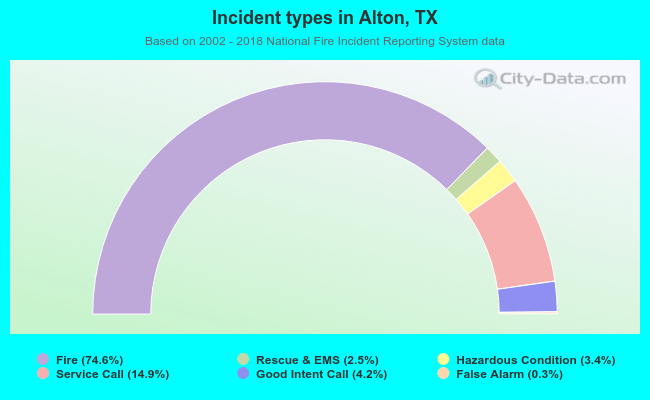 Out of all 355 cases reported during the years 2002 - 2018, the most belonged to the categories: Fire (74.6%), Hazardous Condition (14.9%), and Service Call (4.2%).
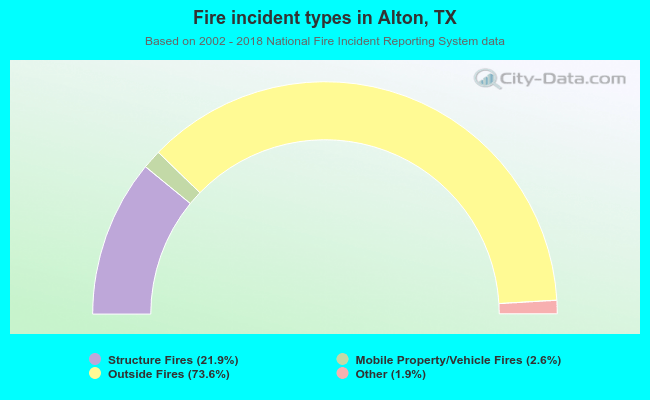 When looking into fire subcategories, the most reports belonged to: Outside Fires (73.6%), and Structure Fires (21.9%).