Asheboro: Fire Incidents, North Carolina (NC)
Where are fire incidents reported in Asheboro, NC
Something went wrong! Please refresh the page.
| Fire incidents reported | |
|---|---|
| Sreet name | Count |
| FAYETTEVILLE ST | 380 |
| DIXIE DR | 226 |
| NC HWY 49 | 106 |
| CHURCH ST | 88 |
| OLD LIBERTY RD | 82 |
| ZOO PKY | 80 |
| US HWY 64 | 68 |
| SUNSET AVE | 64 |
| MACK RD | 62 |
| GOLD HILL RD | 54 |
| TELEPHONE AVE | 52 |
| NC HWY 42 | 48 |
| US HWY 220 BUS | 48 |
| PRESNELL ST | 46 |
| ACADEMY ST | 44 |
| COX ST | 42 |
| OLD COX RD | 42 |
| SALISBURY ST | 42 |
| STALEYS FARM RD | 40 |
| BALFOUR AVE | 38 |
| BURNEY RD | 38 |
| FAIRVIEW FARM RD | 38 |
| MECHANIC RD | 38 |
| US HWY 220 HWY | 36 |
| MCCRARY ST | 34 |
| NEW HOPE CHURCH RD | 34 |
| OLD NC HWY | 34 |
| COLERIDGE RD | 32 |
| FARMER RD | 32 |
| HOPEWELL FRIENDS RD | 32 |
| Other | 1,775 |
2002 - 2018 National Fire Incident Reporting System (NFIRS) incidents
- Incident types reported to NFIRS in Asheboro, NC
- 10,13138.0%Rescue & EMS
- 3,77514.2%Fire
- 3,69413.9%Hazardous Condition
- 3,58813.5%Good Intent Call
- 2,83710.6%False Alarm
- 2,4479.2%Service Call
- 1290.5%Severe Weather
- 480.2%Overpressure Rupture
- Fire incident types reported to NFIRS in Asheboro, NC
- 1,77246.9%Structure Fires
- 1,38136.6%Outside Fires
- 49213.0%Mobile Property/Vehicle Fires
- 1303.4%Other
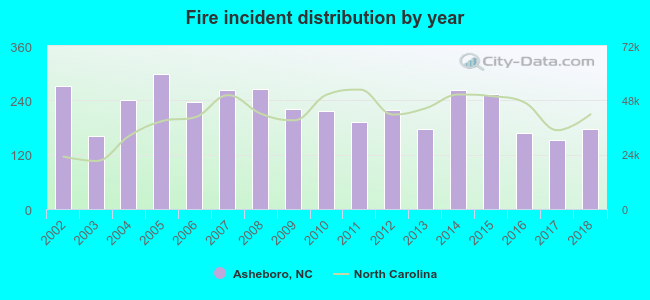 Based on the data from the years 2002 - 2018 the average number of fires per year is 222. The highest number of fire incidents - 298 took place in 2005, and the least - 153 in 2017. The data has a dropping trend.
The average number of yearly fire incidents per 10k residents in Asheboro, NC compared to nearest cities:
(Note: Based on data for the last 3 years, including only cities with population 5,000 and above)
| Asheboro: | 63.9 |
| Trinity: | 78.1 |
| Archdale: | 54.0 |
| Thomasville: | 78.8 |
| Siler City: | 108.4 |
| High Point: | 21.2 |
| Greensboro: | 33.0 |
| Lexington: | 172.1 |
| Gibsonville: | 135.9 |
 The median response time based on all reported fire incidents is 6 minutes. This is similar to the state median value.
The median response time in Asheboro, NC compared to nearest cities:
(Note: Based on data for all years, including only cities with at least 500 fire incidents)
| Asheboro: | 6 minutes |
| Randleman: | 6 minutes |
| Ramseur: | 7 minutes |
| Seagrove: | 10 minutes |
| Trinity: | 6 minutes |
| Archdale: | 5 minutes |
| Liberty: | 8 minutes |
| Pleasant Garden: | 6 minutes |
| Denton: | 8 minutes |
 According to the reports from the years 2002 - 2018 the average number of fire-related yearly casualties is 1. The highest number of casualties - 3 took place in 2006, and the lowest - 0 in 2002. The data has a constant trend.
The average number of casualties per 1,000 fire incidents is 3. This indicator was the highest - 13 in 2006, and the lowest 0 in 2002. The trend for injuries per 1,000 fires is constant. Compared to the state value the number of casualties per 1,000 fires is much lower.
According to the reports from the years 2002 - 2018 the average number of fire-related yearly casualties is 1. The highest number of casualties - 3 took place in 2006, and the lowest - 0 in 2002. The data has a constant trend.
The average number of casualties per 1,000 fire incidents is 3. This indicator was the highest - 13 in 2006, and the lowest 0 in 2002. The trend for injuries per 1,000 fires is constant. Compared to the state value the number of casualties per 1,000 fires is much lower.
 29.9% incidents where reported in the morning and 70.1% in the evening. The most fires (15.7%) took place on Saturday, and the least (12.9%) on Thursday.
 Based on the 3,775 fires from years 2002 - 2018 most fires (12.4%) took place during March, and the least (5.4%) in October.
 Out of all 26,671 cases reported during the years 2002 - 2018, the most belonged to the categories: Rescue & EMS (38.0%), Fire (14.2%), and Hazardous Condition (13.9%).
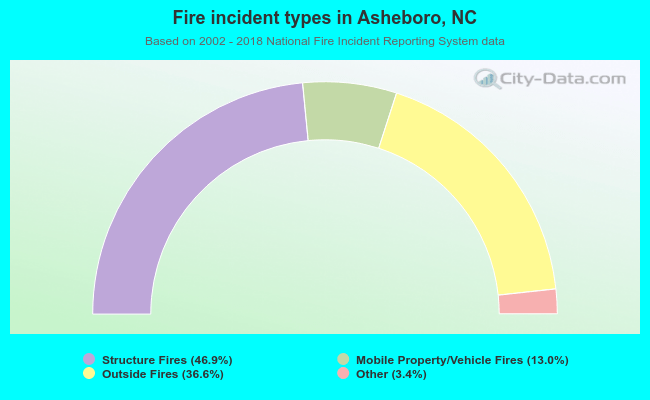 When looking into fire subcategories, the most incidents belonged to: Structure Fires (46.9%), and Outside Fires (36.6%).