Ramseur: Fire Incidents, North Carolina (NC)
Where are fire incidents reported in Ramseur, NC
Something went wrong! Please refresh the page.
|
| |||||||||||||||||||||||||||||||||||||||||||||||||||||||||||||||||||||||||||||||||||||||||||||||||||||||||||||
2002 - 2018 National Fire Incident Reporting System (NFIRS) incidents
- Incident types reported to NFIRS in Ramseur, NC
- 1,49542.4%Rescue & EMS
- 52514.9%Hazardous Condition
- 51114.5%Fire
- 37110.5%Service Call
- 36210.3%Good Intent Call
- 2527.2%False Alarm
- Fire incident types reported to NFIRS in Ramseur, NC
- 28155.0%Structure Fires
- 15129.5%Outside Fires
- 5210.2%Mobile Property/Vehicle Fires
- 275.3%Other
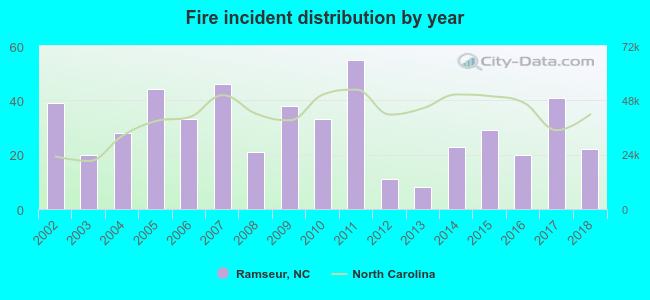 Based on the data from the years 2002 - 2018 the average number of fires per year is 30. The highest number of reported fire incidents - 55 took place in 2011, and the least - 8 in 2013. The data has a decreasing trend.
 The median response time based on all reported fire incidents is 7 minutes. This is close to the state median value.
The median response time in Ramseur, NC compared to nearest cities:
(Note: Based on data for all years, including only cities with at least 500 fire incidents)
| Ramseur: | 7 minutes |
| Asheboro: | 6 minutes |
| Liberty: | 8 minutes |
| Randleman: | 6 minutes |
| Siler City: | 7 minutes |
| Seagrove: | 10 minutes |
| Pleasant Garden: | 6 minutes |
| Archdale: | 5 minutes |
| Robbins: | 9 minutes |
 35.0% incidents where reported in the morning and 65.0% in the evening. The most fires (17.6%) took place on Saturday, and the least (11.7%) on Sunday.
 Based on the 511 fires from years 2002 - 2018 most fires (11.0%) took place during June, and the least (5.9%) in August.
 Out of all 3,522 cases reported during the years 2002 - 2018, the most belonged to the categories: Rescue & EMS (42.4%), Hazardous Condition (14.9%), and Fire (14.5%).
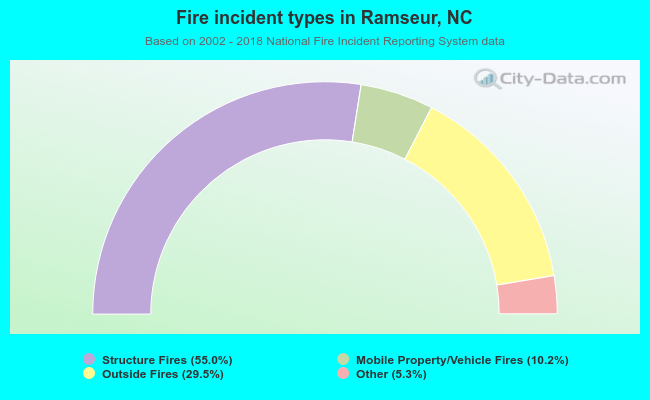 When looking into fire subcategories, the most incidents belonged to: Structure Fires (55.0%), and Outside Fires (29.5%).