Bedford Park: Fire Incidents, Illinois (IL)
Where are fire incidents reported in Bedford Park, IL
Something went wrong! Please refresh the page.
| Fire incidents reported | |
|---|---|
| Sreet name | Count |
| ARCHER RD | 260 |
| ARCHER AVE | 198 |
| CICERO AVE | 180 |
| 73RD ST | 150 |
| 65TH ST | 122 |
| 66TH ST | 78 |
| 71ST ST | 70 |
| CENTRAL AVE | 70 |
| 66TH PL | 68 |
| ARCHER | 40 |
| MASON AVE | 32 |
| 74TH ST | 30 |
| NARRAGANSETT AVE | 28 |
| 70TH PL | 26 |
| HARLEM AVE | 22 |
| STATE RD | 20 |
| 66 ST | 16 |
| 67TH ST | 16 |
| 75TH ST | 16 |
| ARCHER AV | 16 |
| MENARD AVE | 16 |
| BELT CIRCLE DR | 14 |
| CICERO | 14 |
| NASHVILLE AVE | 14 |
| OAK PARK AVE | 14 |
| SAYRE AVE | 14 |
| 68TH ST | 12 |
| LAVERGNE AVE | 12 |
| MASON | 10 |
| 65TH | 8 |
2003 - 2018 National Fire Incident Reporting System (NFIRS) incidents
- Incident types reported to NFIRS in Bedford Park, IL
- 2,39538.7%Rescue & EMS
- 1,24420.1%False Alarm
- 90614.6%Fire
- 84013.6%Good Intent Call
- 5408.7%Hazardous Condition
- 2263.7%Service Call
- 200.3%Special Incident
- 130.2%Overpressure Rupture
- Fire incident types reported to NFIRS in Bedford Park, IL
- 49454.5%Structure Fires
- 18720.6%Outside Fires
- 16318.0%Mobile Property/Vehicle Fires
- 626.8%Other
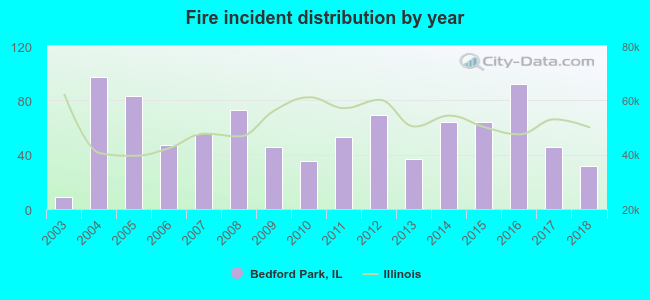 Based on the data from the years 2003 - 2018 the average number of fire incidents per year is 56. The highest number of reported fire incidents - 97 took place in 2004, and the least - 9 in 2003. The data has a growing trend.
 The median response time based on all reported fire incidents is 5 minutes. This is close to the state median value.
The median response time in Bedford Park, IL compared to nearest cities:
(Note: Based on data for all years, including only cities with at least 500 fire incidents)
| Bedford Park: | 5 minutes |
| Burbank: | 4 minutes |
| Summit: | 5 minutes |
| Bridgeview: | 5 minutes |
| Justice: | 4 minutes |
| Stickney: | 5 minutes |
| Lyons: | 5 minutes |
| Hickory Hills: | 4 minutes |
| Oak Lawn: | 5 minutes |
 According to the reports from the years 2003 - 2018 the average number of fire-related casualties per year is 0. The highest number of reported casualties - 1 took place in 2011, and the lowest - 0 in 2003. The data has a constant trend.
The average number of injuries per 1,000 fires is 4. This indicator was the highest - 22 in 2017, and the lowest 0 in 2003. The trend for casualties per 1,000 incidents is constant. Compared to the Illinois value the number of injuries per 1,000 fires is much lower.
According to the reports from the years 2003 - 2018 the average number of fire-related casualties per year is 0. The highest number of reported casualties - 1 took place in 2011, and the lowest - 0 in 2003. The data has a constant trend.
The average number of injuries per 1,000 fires is 4. This indicator was the highest - 22 in 2017, and the lowest 0 in 2003. The trend for casualties per 1,000 incidents is constant. Compared to the Illinois value the number of injuries per 1,000 fires is much lower.Casualties per 1,000 incidents in Bedford Park, IL compared to nearest cities:
(Note: Based on data for all years, including only cities with at least 500 fire incidents)
| Bedford Park: | 4.4 |
| Burbank: | 18.2 |
| Summit: | 14.3 |
| Bridgeview: | 13.5 |
| Justice: | 16.7 |
| Stickney: | 8.8 |
| Lyons: | 15.7 |
| Hickory Hills: | 21.9 |
| Oak Lawn: | 10.6 |
 38.3% incidents where reported in the morning and 61.7% in the evening. The most fires (19.9%) took place on Wednesday, and the least (8.4%) on Saturday.
 Based on the 906 incident reports from years 2003 - 2018 most fires (11.8%) took place during October, and the least (4.4%) in November.
 Out of all 6,188 cases reported during the years 2003 - 2018, the most belonged to the categories: Rescue & EMS (38.7%), False Alarm (20.1%), and Fire (14.6%).
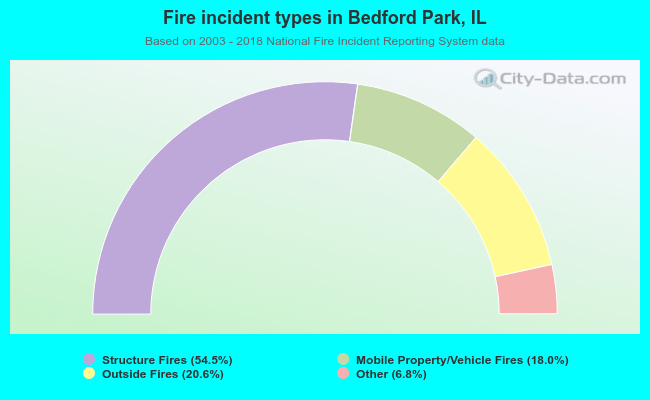 When looking into fire subcategories, the most incidents belonged to: Structure Fires (54.5%), and Outside Fires (20.6%).