Bessemer City: Fire Incidents, North Carolina (NC)
Where are fire incidents reported in Bessemer City, NC
Something went wrong! Please refresh the page.
|
| |||||||||||||||||||||||||||||||||||||||||||||||||||||||||||||||||||||||||||||||||||||||||||||||||||||||||||||
2002 - 2018 National Fire Incident Reporting System (NFIRS) incidents
- Incident types reported to NFIRS in Bessemer City, NC
- 75329.7%Good Intent Call
- 67826.7%Rescue & EMS
- 36214.3%Service Call
- 33013.0%Hazardous Condition
- 31412.4%Fire
- 973.8%False Alarm
- Fire incident types reported to NFIRS in Bessemer City, NC
- 13141.7%Structure Fires
- 13041.4%Outside Fires
- 4614.6%Mobile Property/Vehicle Fires
- 72.2%Other
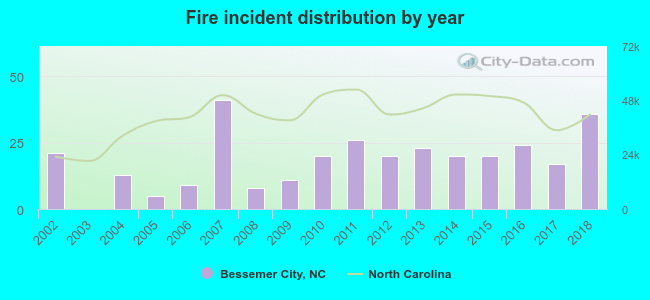 According to the data from the years 2002 - 2018 the average number of fire incidents per year is 18. The highest number of fire incidents - 41 took place in 2007, and the least - 0 in 2003. The data has an increasing trend.
The average number of yearly fire incidents per 10k residents in Bessemer City, NC compared to nearest cities:
(Note: Based on data for the last 3 years, including only cities with population 5,000 and above)
| Bessemer City: | 46.8 |
| Kings Mountain: | 112.4 |
| Gastonia: | 18.4 |
| Cherryville: | 89.2 |
| Lincolnton: | 216.8 |
| Belmont: | 50.1 |
| Shelby: | 78.1 |
| Mount Holly: | 58.7 |
| Huntersville: | 7.4 |

 31.8% incidents where reported in the morning and 68.2% in the evening. The most fires (16.2%) took place on Sunday, and the least (12.7%) on Tuesday.
 According to the 314 fires from years 2002 - 2018 most fires (11.5%) took place during March, and the least (5.7%) in June.
 Out of all 2,537 cases reported during the years 2002 - 2018, the most belonged to the categories: Good Intent Call (29.7%), Rescue & EMS (26.7%), and Service Call (14.3%).
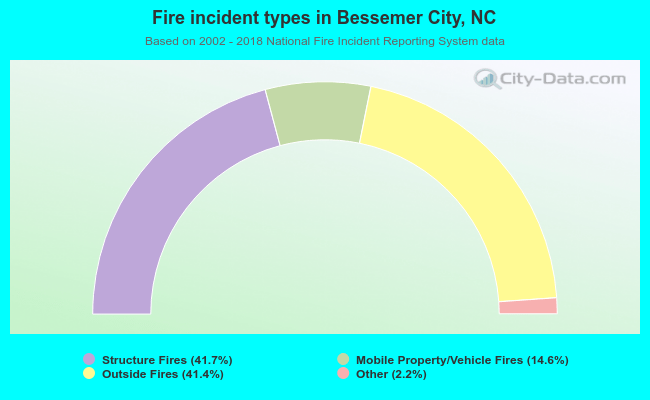 When looking into fire subcategories, the most incidents belonged to: Structure Fires (41.7%), and Outside Fires (41.4%).