Kings Mountain: Fire Incidents, North Carolina (NC)
Where are fire incidents reported in Kings Mountain, NC
Something went wrong! Please refresh the page.
|
| |||||||||||||||||||||||||||||||||||||||||||||||||||||||||||||||||||||||||||||||||||||||||||||||||||||||||||||
| Other | 300 | |||||||||||||||||||||||||||||||||||||||||||||||||||||||||||||||||||||||||||||||||||||||||||||||||||||||||||||
2002 - 2018 National Fire Incident Reporting System (NFIRS) incidents
- Incident types reported to NFIRS in Kings Mountain, NC
- 1,61826.5%Rescue & EMS
- 1,60626.3%Fire
- 1,06117.4%Hazardous Condition
- 74712.2%Good Intent Call
- 5398.8%False Alarm
- 4477.3%Service Call
- 490.8%Severe Weather
- 250.4%Special Incident
- 110.2%Overpressure Rupture
- Fire incident types reported to NFIRS in Kings Mountain, NC
- 69543.3%Structure Fires
- 52932.9%Outside Fires
- 25615.9%Mobile Property/Vehicle Fires
- 1267.8%Other
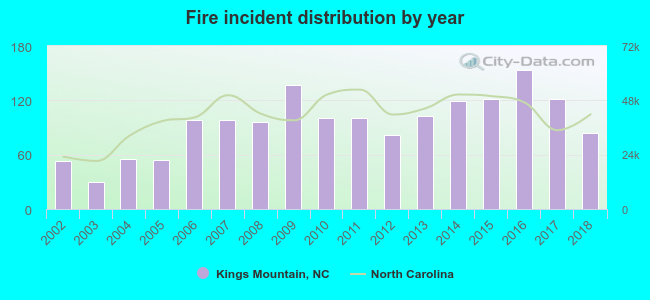 Based on the data from the years 2002 - 2018 the average number of fires per year is 94. The highest number of reported fire incidents - 154 took place in 2016, and the least - 30 in 2003. The data has an increasing trend.
The average number of yearly fire incidents per 10k residents in Kings Mountain, NC compared to nearest cities:
(Note: Based on data for the last 3 years, including only cities with population 5,000 and above)
| Kings Mountain: | 112.4 |
| Bessemer City: | 46.8 |
| Gastonia: | 18.4 |
| Cherryville: | 89.2 |
| Shelby: | 78.1 |
| Lincolnton: | 216.8 |
| Belmont: | 50.1 |
| Mount Holly: | 58.7 |
| Pineville: | 44.1 |
 The median response time based on all reported fire incidents is 7 minutes. This is similar to the state median value.
The median response time in Kings Mountain, NC compared to nearest cities:
(Note: Based on data for all years, including only cities with at least 500 fire incidents)
| Kings Mountain: | 7 minutes |
| Grover: | 7 minutes |
| Gastonia: | 6 minutes |
| Cherryville: | 7 minutes |
| Dallas: | 8 minutes |
| Shelby: | 8 minutes |
| Stanley: | 8 minutes |
| Lincolnton: | 6 minutes |
| Lawndale: | 8 minutes |
 According to the reports from the years 2002 - 2018 the average number of fire-related fatalities per year is 0. The highest number of deaths - 2 took place in 2013, and the lowest - 0 in 2002. The data has a constant trend.
 29.1% incidents where reported in the morning and 70.9% in the evening. The most fires (15.6%) took place on Thursday, and the least (12.6%) on Sunday.
 Based on the 1,606 fire incident reports from years 2002 - 2018 most fires (12.0%) took place during January, and the least (5.7%) in July.
 Out of all 6,103 cases reported during the years 2002 - 2018, the most belonged to the categories: Rescue & EMS (26.5%), Fire (26.3%), and Hazardous Condition (17.4%).
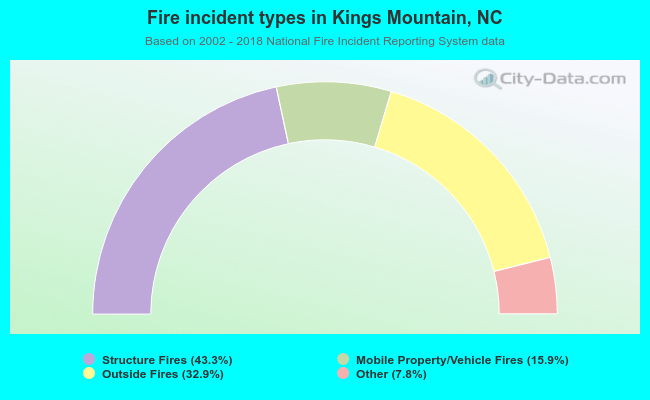 When looking into fire subcategories, the most reports belonged to: Structure Fires (43.3%), and Outside Fires (32.9%).