Brawley: Fire Incidents, California (CA)
Where are fire incidents reported in Brawley, CA
Something went wrong! Please refresh the page.
|
| |||||||||||||||||||||||||||||||||||||||||||||||||||||||||||||||||||||||||||||||||||||||||||||||||||||||||||||
2005 - 2018 National Fire Incident Reporting System (NFIRS) incidents
- Incident types reported to NFIRS in Brawley, CA
- 4,15273.9%Rescue & EMS
- 4838.6%Good Intent Call
- 4688.3%Fire
- 2604.6%Service Call
- 1612.9%False Alarm
- 891.6%Hazardous Condition
- Fire incident types reported to NFIRS in Brawley, CA
- 25053.4%Outside Fires
- 14230.3%Structure Fires
- 4810.3%Mobile Property/Vehicle Fires
- 286.0%Other
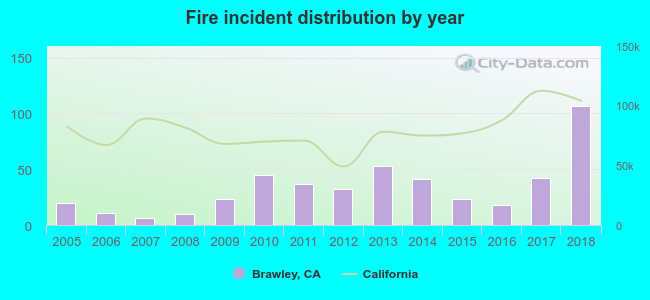 Based on the data from the years 2005 - 2018 the average number of fires per year is 33. The highest number of reported fires - 107 took place in 2018, and the least - 6 in 2007. The data has an increasing trend.
The average number of yearly fire incidents per 10k residents in Brawley, CA compared to nearest cities:
(Note: Based on data for the last 3 years, including only cities with population 5,000 and above)
| Brawley: | 21.6 |
| Imperial: | 22.6 |
| Calipatria: | 4.4 |
| El Centro: | 51.5 |
| Holtville: | 75.3 |
| Calexico: | 27.1 |
| Oasis: | 1.5 |
| Mecca: | 3.5 |
| Coachella: | 0.6 |

 38.0% incidents where reported in the morning and 62.0% in the evening. The most fires (15.2%) took place on Wednesday, and the least (12.2%) on Tuesday.
 Based on the 468 fire incident reports from years 2005 - 2018 most fires (12.0%) took place during April, and the least (6.0%) in November.
 Out of all 5,619 cases reported during the years 2005 - 2018, the most belonged to the categories: Rescue & EMS (73.9%), Good Intent Call (8.6%), and Fire (8.3%).
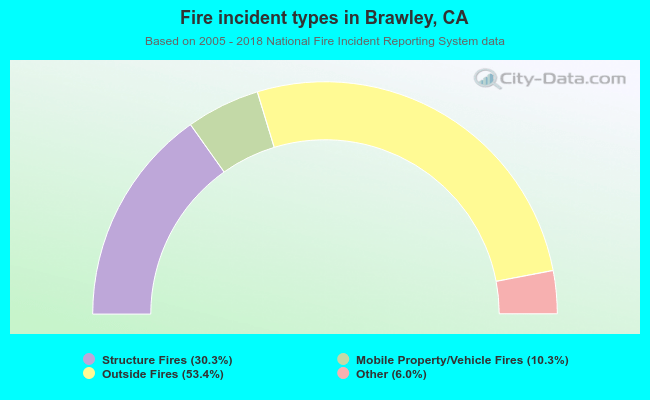 When looking into fire subcategories, the most reports belonged to: Outside Fires (53.4%), and Structure Fires (30.3%).