Brentwood: Fire Incidents, Missouri (MO)
Where are fire incidents reported in Brentwood, MO
Something went wrong! Please refresh the page.
| Fire incidents reported | |
|---|---|
| Sreet name | Count |
| BRENTWOOD BLVD | 144 |
| MANCHESTER RD | 68 |
| EAGER RD | 66 |
| STRASSNER DR | 60 |
| HANLEY RD | 52 |
| SWAN CIR | 52 |
| HANLEY | 30 |
| HANLEY INDUS CT | 26 |
| WRENWOOD LN | 26 |
| BRENTWOOD | 24 |
| EULALIE AVE | 24 |
| BLUEBIRD TER | 22 |
| BRIDGEPORT | 22 |
| BRIDGEPORT AVE | 22 |
| HANLEY INDUSTRIAL CT | 22 |
| ROSALIE AVE | 22 |
| WHITE AVE | 20 |
| LITZSINGER RD | 18 |
| PENDLETON AVE | 18 |
| BRENTWOOD BLVD | 16 |
| MANCHESTER | 16 |
| STRASSNER | 16 |
| VAN MARK WAY | 16 |
| HIGH SCHOOL DR | 14 |
| BRENTWOOD PROMENADE CT | 12 |
| CRICKET LN | 12 |
| COLLIER | 10 |
| HILLDALE AVE | 10 |
| LAWNDELL | 10 |
| MADGE | 10 |
2002 - 2018 National Fire Incident Reporting System (NFIRS) incidents
- Incident types reported to NFIRS in Brentwood, MO
- 2,96241.8%Rescue & EMS
- 1,08415.3%False Alarm
- 1,03014.5%Hazardous Condition
- 98813.9%Good Intent Call
- 6929.8%Fire
- 3064.3%Service Call
- 180.3%Overpressure Rupture
- 100.1%Severe Weather
- Fire incident types reported to NFIRS in Brentwood, MO
- 42261.0%Structure Fires
- 11316.3%Outside Fires
- 9413.6%Other
- 639.1%Mobile Property/Vehicle Fires
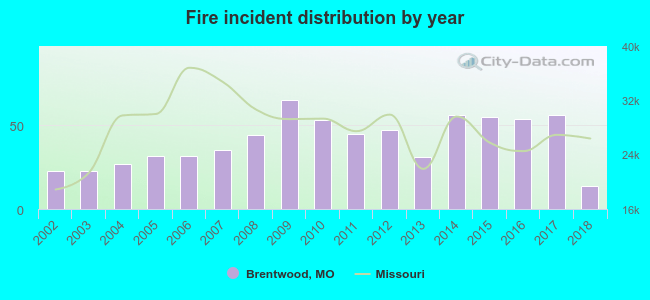 Based on the data from the years 2002 - 2018 the average number of fires per year is 41. The highest number of reported fires - 65 took place in 2009, and the least - 14 in 2018. The data has a dropping trend.
The average number of yearly fire incidents per 10k residents in Brentwood, MO compared to nearest cities:
(Note: Based on data for the last 3 years, including only cities with population 5,000 and above)
| Brentwood: | 51.4 |
| Richmond Heights: | 78.9 |
| Maplewood: | 75.0 |
| Clayton: | 43.4 |
| Ladue: | 48.2 |
| Webster Groves: | 24.9 |
| Shrewsbury: | 28.5 |
| Glendale: | 11.3 |
| University City: | 47.4 |
 The median response time based on all reported fire incidents is 4 minutes. This is lower compared to the Missouri median value.
The median response time in Brentwood, MO compared to nearest cities:
(Note: Based on data for all years, including only cities with at least 500 fire incidents)
| Brentwood: | 4 minutes |
| Richmond Heights: | 5 minutes |
| Maplewood: | 4 minutes |
| Clayton: | 4 minutes |
| Ladue: | 6 minutes |
| Webster Groves: | 5 minutes |
| Shrewsbury: | 5 minutes |
| University City: | 5 minutes |
| Olivette: | 5 minutes |
 35.1% incidents where reported in the morning and 64.9% in the evening. The most fires (15.5%) took place on Monday, and the least (12.6%) on Thursday.
 Based on the 692 fires from years 2002 - 2018 most fires (11.4%) took place during June, and the least (6.4%) in February.
 Out of all 7,094 cases reported during the years 2002 - 2018, the most belonged to the categories: Rescue & EMS (41.8%), False Alarm (15.3%), and Hazardous Condition (14.5%).
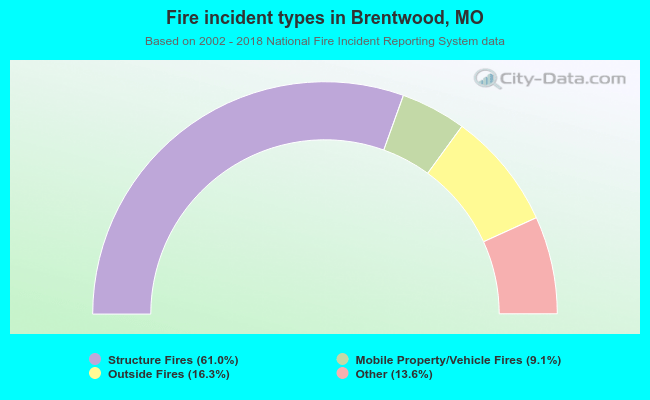 When looking into fire subcategories, the most reports belonged to: Structure Fires (61.0%), and Outside Fires (16.3%).