Glendale: Fire Incidents, Missouri (MO)
Where are fire incidents reported in Glendale, MO
Something went wrong! Please refresh the page.
|
| |||||||||||||||||||||||||||||||||||||||||||||||||||||||||||||||||||||||||||||||||||||||||||||||||||||||||||||
2002 - 2018 National Fire Incident Reporting System (NFIRS) incidents
- Incident types reported to NFIRS in Glendale, MO
- 87231.1%Hazardous Condition
- 83929.9%Rescue & EMS
- 33712.0%Good Intent Call
- 28210.0%Fire
- 2258.0%False Alarm
- 2117.5%Service Call
- 271.0%Severe Weather
- 130.5%Special Incident
- Fire incident types reported to NFIRS in Glendale, MO
- 19769.9%Structure Fires
- 3713.1%Outside Fires
- 3612.8%Other
- 124.3%Mobile Property/Vehicle Fires
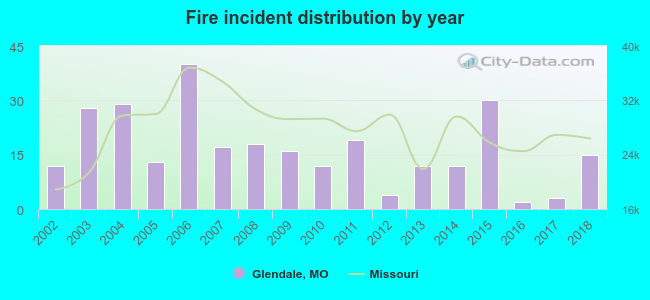 Based on the data from the years 2002 - 2018 the average number of fire incidents per year is 17. The highest number of reported fires - 40 took place in 2006, and the least - 2 in 2016. The data has a growing trend.
The average number of yearly fire incidents per 10k residents in Glendale, MO compared to nearest cities:
(Note: Based on data for the last 3 years, including only cities with population 5,000 and above)
| Glendale: | 11.3 |
| Webster Groves: | 24.9 |
| Kirkwood: | 26.6 |
| Crestwood: | 22.6 |
| Brentwood: | 51.4 |
| Ladue: | 48.2 |
| Shrewsbury: | 28.5 |
| Des Peres: | 19.9 |
| Maplewood: | 75.0 |

 40.4% incidents where reported in the morning and 59.6% in the evening. The most fires (23.0%) took place on Saturday, and the least (7.4%) on Wednesday.
 Based on the 282 fires from years 2002 - 2018 most fires (20.2%) took place during December, and the least (3.9%) in September.
 Out of all 2,808 cases reported during the years 2002 - 2018, the most belonged to the categories: Hazardous Condition (31.1%), Rescue & EMS (29.9%), and Good Intent Call (12.0%).
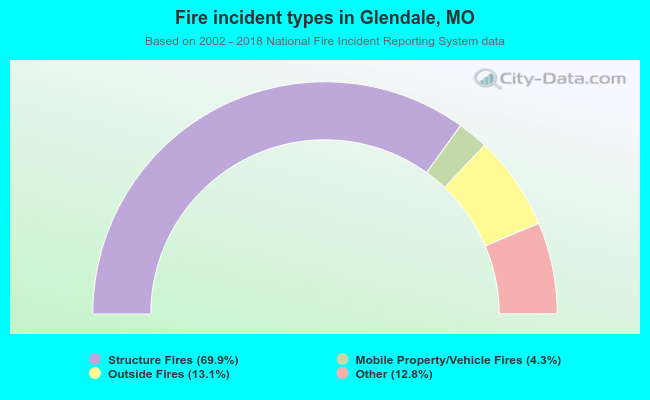 When looking into fire subcategories, the most reports belonged to: Structure Fires (69.9%), and Outside Fires (13.1%).