Canon City: Fire Incidents, Colorado (CO)
Where are fire incidents reported in Canon City, CO
Something went wrong! Please refresh the page.
| Fire incidents reported | |
|---|---|
| Sreet name | Count |
| RAYNOLDS | 54 |
| MACON | 52 |
| HIGHWAY 50 (EAST) | 50 |
| HIGHWAY 50WEST | 48 |
| GARDEN PARK RD | 44 |
| POPLAR | 40 |
| 15TH ST | 38 |
| COLLEGE AVE | 38 |
| 05TH ST | 36 |
| CENTRAL | 36 |
| ELM | 36 |
| HIGHWAY 50EAST | 36 |
| MAIN ST | 36 |
| ORCHARD | 36 |
| ROYAL GORGE BLVD | 36 |
| CEDAR | 34 |
| GRAND | 32 |
| 09TH. ST | 30 |
| COUNTY ROAD 3A | 30 |
| EAST MAIN ST | 30 |
| FREMONT DR | 30 |
| RED CANYON RD | 30 |
| JUSTICE CENTER RD | 28 |
| SHERMAN | 28 |
| 05TH. ST | 26 |
| COUNTY ROAD 3 | 26 |
| FIELDS AVE | 26 |
| HIGHWAY 50 (WEST) | 26 |
| GREENWOOD | 24 |
| COUNTY ROAD 143 | 22 |
| Other | 245 |
2006 - 2018 National Fire Incident Reporting System (NFIRS) incidents
- Incident types reported to NFIRS in Canon City, CO
- 9,57157.3%Rescue & EMS
- 1,97711.8%Good Intent Call
- 1,5919.5%Service Call
- 1,3127.9%Hazardous Condition
- 1,2837.7%Fire
- 8775.3%False Alarm
- 420.3%Overpressure Rupture
- 220.1%Special Incident
- 210.1%Severe Weather
- Fire incident types reported to NFIRS in Canon City, CO
- 66952.1%Outside Fires
- 36328.3%Structure Fires
- 12810.0%Mobile Property/Vehicle Fires
- 1239.6%Other
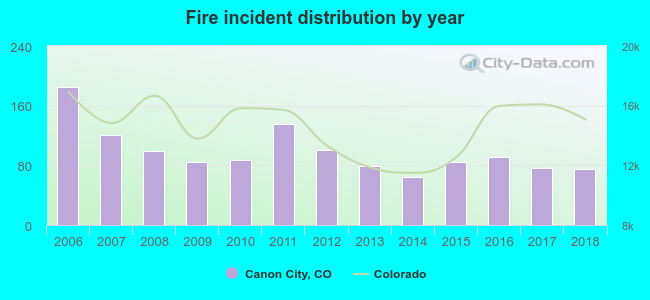 According to the data from the years 2006 - 2018 the average number of fires per year is 99. The highest number of fires - 185 took place in 2006, and the least - 64 in 2014. The data has a declining trend.
The average number of yearly fire incidents per 10k residents in Canon City, CO compared to nearest cities:
(Note: Based on data for the last 3 years, including only cities with population 5,000 and above)
| Canon City: | 49.6 |
| Pueblo West: | 9.0 |
| Fort Carson: | 9.7 |
| Manitou Springs: | 23.8 |
| Stratmoor: | 1.4 |
| Fountain: | 60.1 |
| Pueblo: | 58.0 |
| Colorado Springs: | 17.3 |
| Divide: | 9.4 |
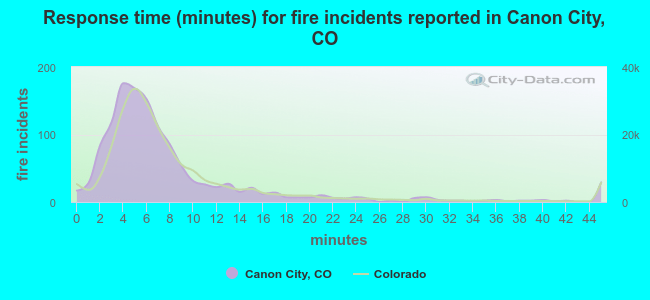 The median response time based on all reported fire incidents is 6 minutes. This is close to the state median value.
The median response time in Canon City, CO compared to nearest cities:
(Note: Based on data for all years, including only cities with at least 500 fire incidents)
| Canon City: | 6 minutes |
| Pueblo West: | 7 minutes |
| Fountain: | 5 minutes |
| Pueblo: | 6 minutes |
| Colorado Springs: | 6 minutes |
| Woodland Park: | 9 minutes |
| Salida: | 5 minutes |
| Monument: | 8 minutes |
| Peyton: | 12 minutes |
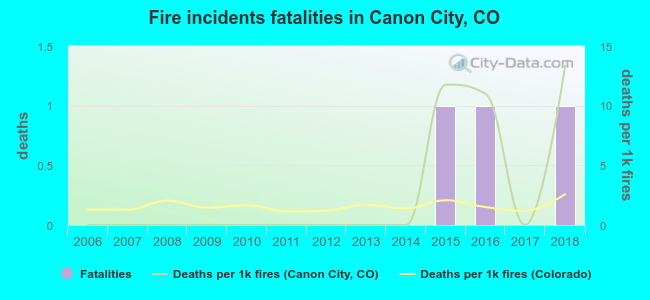 According to the reports from the years 2006 - 2018 the average number of fire-related yearly deaths is 0. The highest number of deaths - 1 took place in 2015, and the lowest - 0 in 2006. The data has a growing trend.
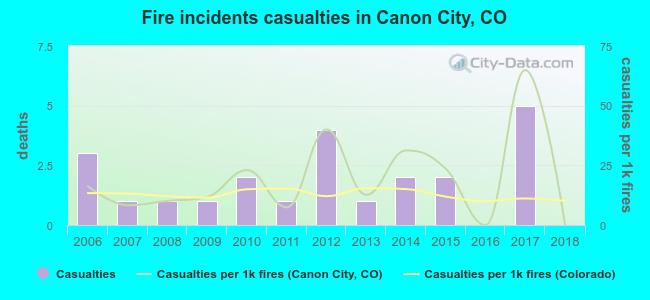 According to the reports from the years 2006 - 2018 the average number of fire-related yearly casualties is 2. The highest number of reported casualties - 5 took place in 2017, and the lowest - 0 in 2016. The data has a declining trend.
The average number of injuries per 1,000 fires is 19. This indicator was the highest - 65 in 2017, and the lowest 0 in 2016. The trend for injuries per 1,000 fire incidents is declining. Compared to the state value the number of injuries per 1,000 fire incidents is higher.
According to the reports from the years 2006 - 2018 the average number of fire-related yearly casualties is 2. The highest number of reported casualties - 5 took place in 2017, and the lowest - 0 in 2016. The data has a declining trend.
The average number of injuries per 1,000 fires is 19. This indicator was the highest - 65 in 2017, and the lowest 0 in 2016. The trend for injuries per 1,000 fire incidents is declining. Compared to the state value the number of injuries per 1,000 fire incidents is higher.Casualties per 1,000 incidents in Canon City, CO compared to nearest cities:
(Note: Based on data for all years, including only cities with at least 500 fire incidents)
| Canon City: | 17.9 |
| Pueblo West: | 9.7 |
| Fountain: | 21.8 |
| Pueblo: | 16.5 |
| Colorado Springs: | 23.3 |
| Woodland Park: | 3.9 |
| Salida: | 8.2 |
| Monument: | 7.7 |
| Peyton: | 6.4 |
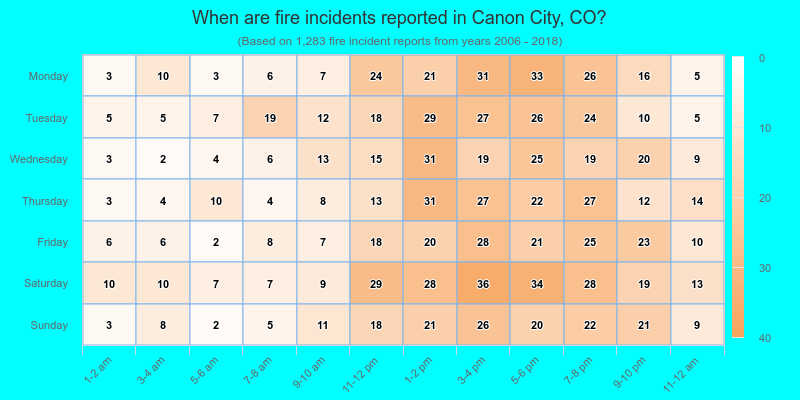
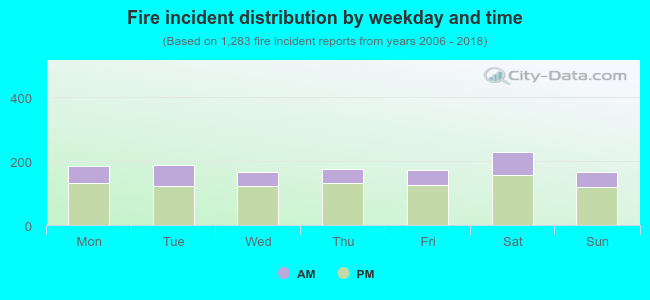 28.8% incidents where reported in the morning and 71.2% in the evening. The most fires (17.9%) took place on Saturday, and the least (12.9%) on Wednesday.
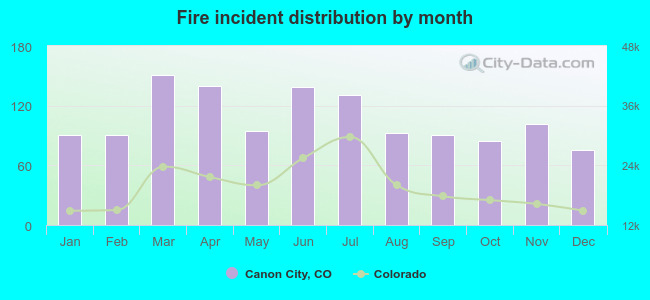 Based on the 1,283 fire incident reports from years 2006 - 2018 most fires (11.8%) took place during March, and the least (5.8%) in December.
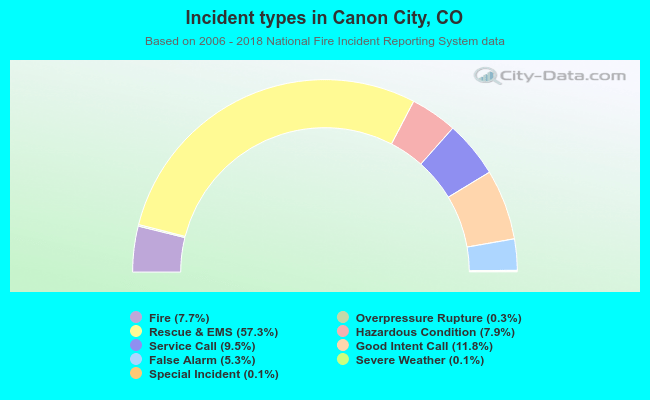 Out of all 16,696 cases reported during the years 2006 - 2018, the most belonged to the categories: Rescue & EMS (57.3%), Good Intent Call (11.8%), and Service Call (9.5%).
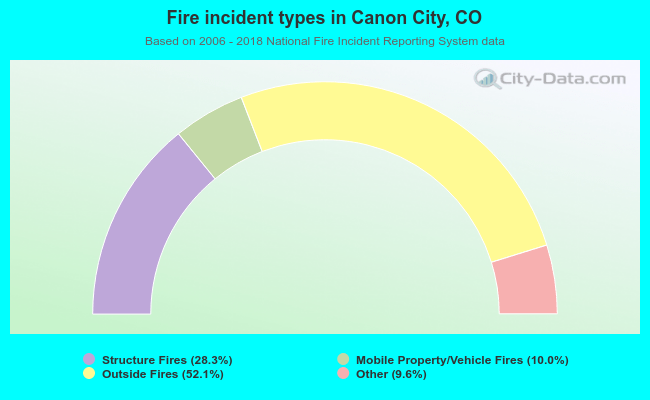 When looking into fire subcategories, the most reports belonged to: Outside Fires (52.1%), and Structure Fires (28.3%).