Fountain: Fire Incidents, Colorado (CO)
Where are fire incidents reported in Fountain, CO
Something went wrong! Please refresh the page.
| Fire incidents reported | |
|---|---|
| Sreet name | Count |
| I-25 HWY | 314 |
| I25 HWY | 206 |
| SANTA FE AVE | 182 |
| FOUNTAIN MESA RD | 126 |
| 85/87 HWY | 108 |
| OLD PUEBLO RD | 84 |
| MESA RIDGE PKY | 70 |
| MAIN ST | 60 |
| 85 HWY | 56 |
| OHIO AVE | 56 |
| SQUIRREL CREEK RD | 50 |
| BANDLEY DR | 44 |
| CHARTER OAK RANCH RD | 44 |
| SOUTHMOOR DR | 44 |
| CREST DR | 40 |
| I25 | 40 |
| ROYALTY PL | 40 |
| 16 HWY | 38 |
| JIMMY CAMP RD | 36 |
| COMANCHE VILLAGE DR | 34 |
| ALEGRE CIR | 32 |
| LINK RD | 32 |
| MILLBROSE RD | 32 |
| CALLE ENTRADA | 30 |
| CAMDEN BLVD | 30 |
| DAFFODIL ST | 30 |
| GRINDE DR | 30 |
| RACE ST | 30 |
| ANCESTRA DR | 28 |
| IOWA AVE | 28 |
| Other | 1 |
2002 - 2018 National Fire Incident Reporting System (NFIRS) incidents
- Incident types reported to NFIRS in Fountain, CO
- 15,10257.9%Rescue & EMS
- 3,07911.8%Service Call
- 2,66910.2%Good Intent Call
- 1,9757.6%Fire
- 1,9407.4%Hazardous Condition
- 1,1984.6%False Alarm
- 580.2%Overpressure Rupture
- Fire incident types reported to NFIRS in Fountain, CO
- 1,06053.7%Outside Fires
- 52626.6%Structure Fires
- 33216.8%Mobile Property/Vehicle Fires
- 572.9%Other
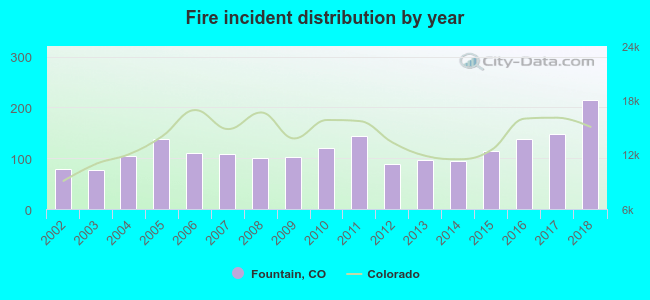 According to the data from the years 2002 - 2018 the average number of fires per year is 116. The highest number of fire incidents - 214 took place in 2018, and the least - 77 in 2003. The data has a rising trend.
The average number of yearly fire incidents per 10k residents in Fountain, CO compared to nearest cities:
(Note: Based on data for the last 3 years, including only cities with population 5,000 and above)
| Fountain: | 60.1 |
| Fort Carson: | 9.7 |
| Stratmoor: | 1.4 |
| Cimarron Hills: | 8.7 |
| Colorado Springs: | 17.3 |
| Elsmere: | 0.3 |
| Manitou Springs: | 23.8 |
| Southeastern El Paso: | 0.8 |
| Air Force Academy: | 1.5 |
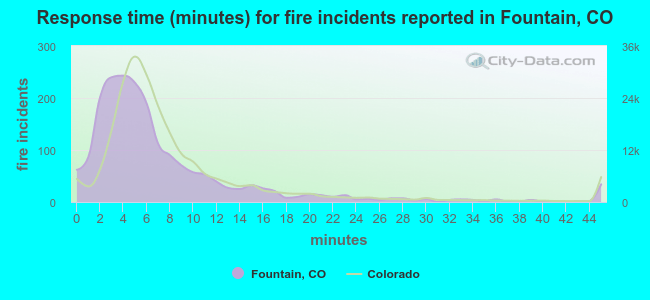 The median response time based on all reported fire incidents is 5 minutes. This is lower than the state median value.
The median response time in Fountain, CO compared to nearest cities:
(Note: Based on data for all years, including only cities with at least 500 fire incidents)
| Fountain: | 5 minutes |
| Colorado Springs: | 6 minutes |
| Pueblo West: | 7 minutes |
| Peyton: | 12 minutes |
| Monument: | 8 minutes |
| Woodland Park: | 9 minutes |
| Pueblo: | 6 minutes |
| Calhan: | 17 minutes |
| Canon City: | 6 minutes |
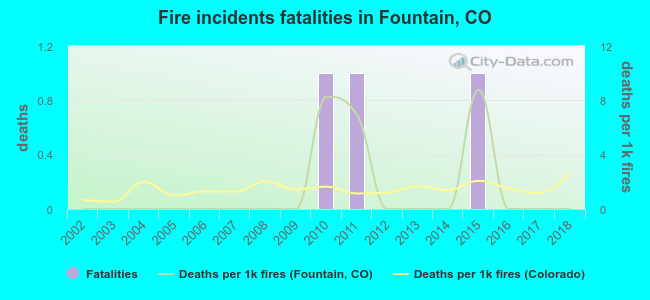 Based on the data from the years 2002 - 2018 the average number of fire-related yearly deaths is 0. The highest number of reported deaths - 1 took place in 2010, and the lowest - 0 in 2002. The data has a constant trend.
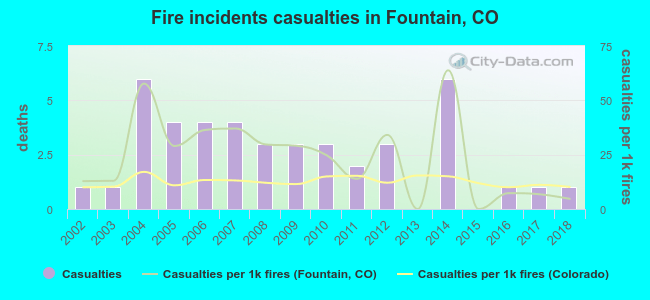 Based on the reports from the years 2002 - 2018 the average number of fire-related casualties per year is 3. The highest number of casualties - 6 took place in 2004, and the lowest - 0 in 2013. The data has a constant trend.
The average number of injuries per 1,000 fire incidents is 24. This indicator was the highest - 64 in 2014, and the lowest 0 in 2013. The trend for casualties per 1,000 fires is dropping. Compared to the Colorado value the number of injuries per 1,000 fire incidents is higher.
Based on the reports from the years 2002 - 2018 the average number of fire-related casualties per year is 3. The highest number of casualties - 6 took place in 2004, and the lowest - 0 in 2013. The data has a constant trend.
The average number of injuries per 1,000 fire incidents is 24. This indicator was the highest - 64 in 2014, and the lowest 0 in 2013. The trend for casualties per 1,000 fires is dropping. Compared to the Colorado value the number of injuries per 1,000 fire incidents is higher.Casualties per 1,000 incidents in Fountain, CO compared to nearest cities:
(Note: Based on data for all years, including only cities with at least 500 fire incidents)
| Fountain: | 21.8 |
| Colorado Springs: | 23.3 |
| Pueblo West: | 9.7 |
| Peyton: | 6.4 |
| Monument: | 7.7 |
| Woodland Park: | 3.9 |
| Pueblo: | 16.5 |
| Calhan: | 7.2 |
| Canon City: | 17.9 |
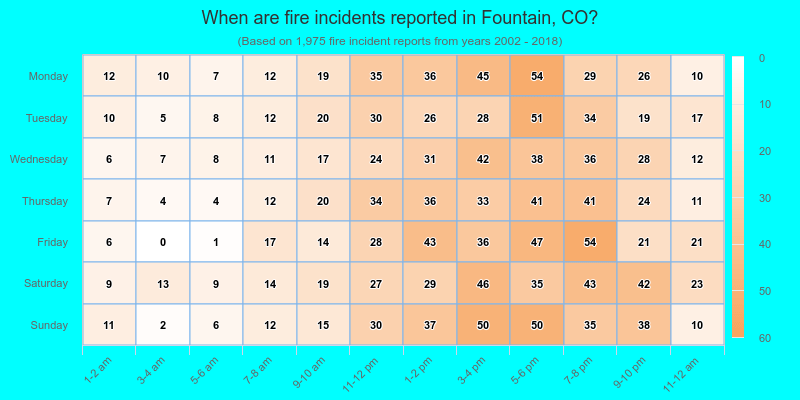
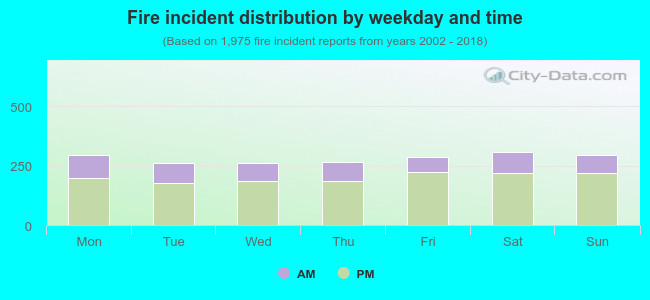 28.7% incidents where reported in the morning and 71.3% in the evening. The most fires (15.6%) took place on Saturday, and the least (13.2%) on Tuesday.
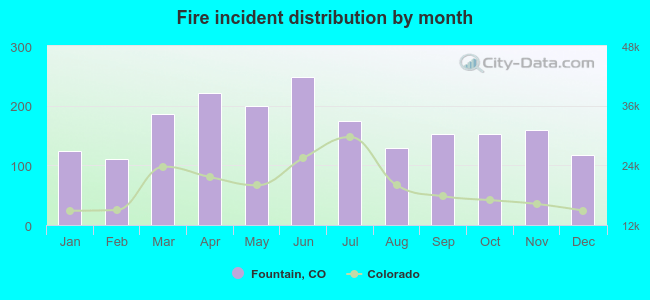 According to the 1,975 reports from years 2002 - 2018 most fires (12.6%) took place during June, and the least (5.6%) in February.
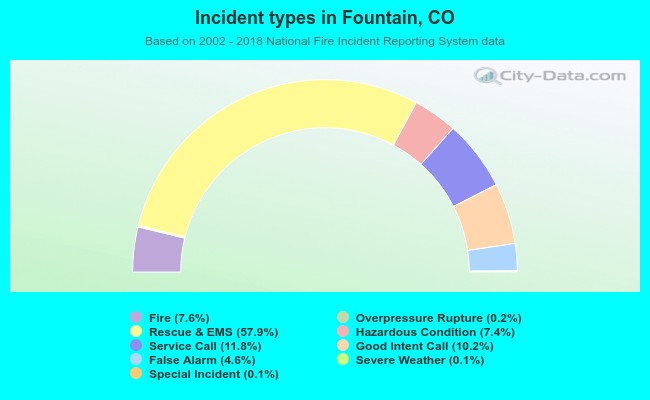 Out of all 26,063 cases reported during the years 2002 - 2018, the most belonged to the categories: Rescue & EMS (57.9%), Service Call (11.8%), and Good Intent Call (10.2%).
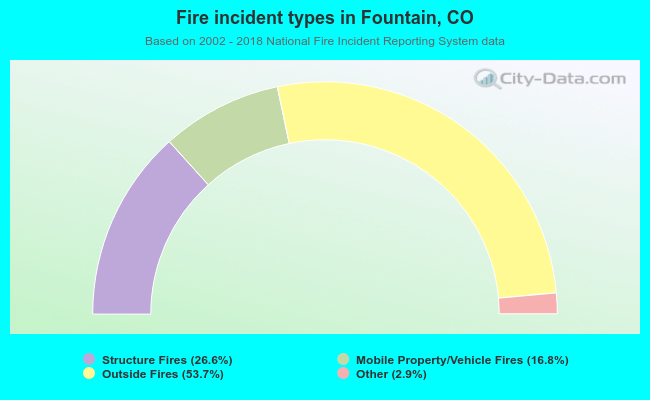 When looking into fire subcategories, the most reports belonged to: Outside Fires (53.7%), and Structure Fires (26.6%).