Castalian Springs: Fire Incidents, Tennessee (TN)
Where are fire incidents reported in Castalian Springs, TN
Something went wrong! Please refresh the page.
|
| |||||||||||||||||||||||||||||||||||||||||||||||||||||||||||||||||||||||||||||||||||||||||||||||||||||||||||||
2002 - 2018 National Fire Incident Reporting System (NFIRS) incidents
- Incident types reported to NFIRS in Castalian Springs, TN
- 19950.3%Fire
- 7719.4%Rescue & EMS
- 4511.4%Good Intent Call
- 338.3%Service Call
- 225.6%False Alarm
- 194.8%Hazardous Condition
- 10.3%Severe Weather
- Fire incident types reported to NFIRS in Castalian Springs, TN
- 9447.2%Outside Fires
- 8341.7%Structure Fires
- 168.0%Mobile Property/Vehicle Fires
- 63.0%Other
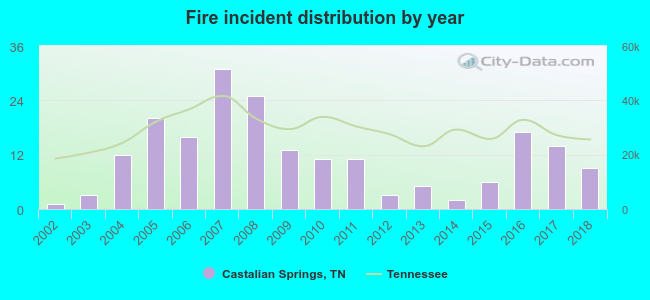 Based on the data from the years 2002 - 2018 the average number of fires per year is 12. The highest number of reported fires - 31 took place in 2007, and the least - 1 in 2002. The data has an increasing trend.
The average number of yearly fire incidents per 10k residents in Castalian Springs, TN compared to nearest cities:
(Note: Based on data for the last 3 years, including only cities with population 5,000 and above)
| Castalian Springs: | 25.4 |
| Gallatin: | 36.3 |
| Lebanon: | 91.1 |
| Hendersonville: | 16.0 |
| Mount Juliet: | 23.0 |
| Portland: | 62.7 |
| White House: | 48.0 |
| Goodlettsville: | 52.6 |
| Millersville: | 28.0 |

 28.6% incidents where reported in the morning and 71.4% in the evening. The most fires (18.6%) took place on Saturday, and the least (10.6%) on Wednesday.
 According to the 199 incident reports from years 2002 - 2018 most fires (13.1%) took place during November, and the least (2.0%) in October.
 Out of all 396 cases reported during the years 2002 - 2018, the most belonged to the categories: Fire (50.3%), Overpressure Rupture (19.4%), and Service Call (11.4%).
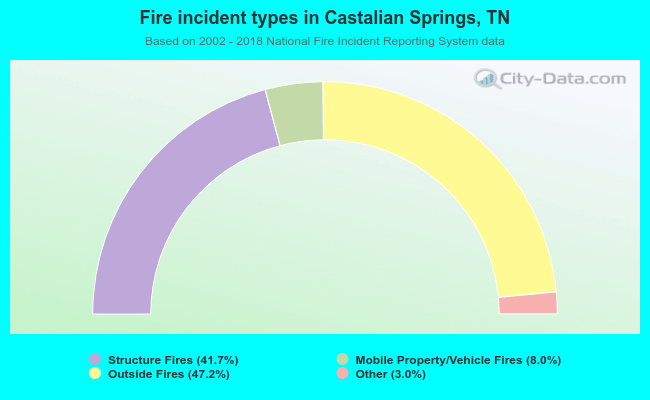 When looking into fire subcategories, the most incidents belonged to: Outside Fires (47.2%), and Structure Fires (41.7%).