Lebanon: Fire Incidents, Tennessee (TN)
Where are fire incidents reported in Lebanon, TN
Something went wrong! Please refresh the page.
| Fire incidents reported | |
|---|---|
| Sreet name | Count |
| CUMBERLAND ST | 254 |
| 40 INST | 236 |
| MAIN ST | 170 |
| CARTHAGE HWY | 162 |
| MURFREESBORO RD | 152 |
| BLUEBIRD RD | 134 |
| 109 HWY | 124 |
| CAINSVILLE RD | 108 |
| BADDOUR PKY | 90 |
| HARTMANN DR | 88 |
| HARTSVILLE PIKE | 88 |
| HIGHWAY 109 | 80 |
| SPARTA PIKE | 74 |
| COLES FERRY PIKE | 72 |
| LEEVILLE PIKE | 66 |
| CAIRO BEND RD | 64 |
| TATER PEELER RD | 60 |
| HICKORY RIDGE RD | 56 |
| FRANKLIN RD | 54 |
| I-40 FWY | 52 |
| TROUSDALE FERRY PIKE | 52 |
| EASTGATE BLVD | 50 |
| I 40 | 42 |
| LEBANON RD | 42 |
| MAPLE ST | 42 |
| BEASLEYS BEND RD | 40 |
| MADDOX SIMPSON PKY | 38 |
| BIG SPRINGS RD | 36 |
| CUMBERLAND | 36 |
| HOLLOWAY RD | 36 |
| Other | 1,506 |
2002 - 2018 National Fire Incident Reporting System (NFIRS) incidents
- Incident types reported to NFIRS in Lebanon, TN
- 13,90051.6%Rescue & EMS
- 4,10415.2%Fire
- 3,20711.9%Good Intent Call
- 2,73010.1%Hazardous Condition
- 1,9267.1%False Alarm
- 9453.5%Service Call
- 570.2%Overpressure Rupture
- 500.2%Special Incident
- Fire incident types reported to NFIRS in Lebanon, TN
- 2,01649.1%Outside Fires
- 1,06926.0%Structure Fires
- 84320.5%Mobile Property/Vehicle Fires
- 1764.3%Other
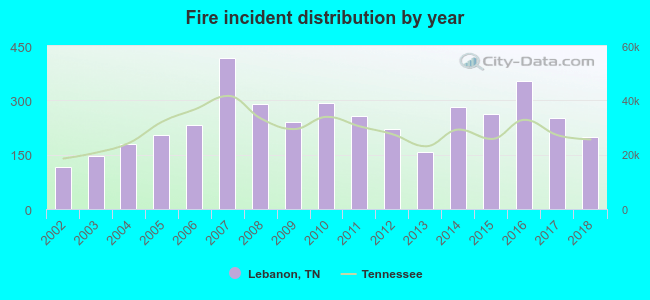 According to the data from the years 2002 - 2018 the average number of fire incidents per year is 241. The highest number of fires - 416 took place in 2007, and the least - 117 in 2002. The data has a rising trend.
The average number of yearly fire incidents per 10k residents in Lebanon, TN compared to nearest cities:
(Note: Based on data for the last 3 years, including only cities with population 5,000 and above)
| Lebanon: | 91.1 |
| Mount Juliet: | 23.0 |
| Castalian Springs: | 25.4 |
| Gallatin: | 36.3 |
| Lascassas: | 23.1 |
| Hendersonville: | 16.0 |
| La Vergne: | 1.8 |
| Smyrna: | 37.8 |
| Goodlettsville: | 52.6 |
 The median response time based on all reported fire incidents is 7 minutes. This is about the same as the Tennessee median value.
The median response time in Lebanon, TN compared to nearest cities:
(Note: Based on data for all years, including only cities with at least 500 fire incidents)
| Lebanon: | 7 minutes |
| Mount Juliet: | 9 minutes |
| Watertown: | 12 minutes |
| Gallatin: | 5 minutes |
| Hendersonville: | 5 minutes |
| La Vergne: | 3 minutes |
| Smyrna: | 6 minutes |
| Carthage: | 7 minutes |
| Goodlettsville: | 4 minutes |
 Based on the reports from the years 2002 - 2018 the average number of fire-related fatalities per year is 1. The highest number of deaths - 3 took place in 2011, and the lowest - 0 in 2003. The data has a declining trend.
The average number of deaths per 1,000 fires is 3. This indicator was the highest - 12 in 2011, and the lowest 0 in 2003. The trend for fatalities per 1,000 fires is declining. Compared to the Tennessee value the number of fatalities per 1,000 fire incidents is similar.
Based on the reports from the years 2002 - 2018 the average number of fire-related fatalities per year is 1. The highest number of deaths - 3 took place in 2011, and the lowest - 0 in 2003. The data has a declining trend.
The average number of deaths per 1,000 fires is 3. This indicator was the highest - 12 in 2011, and the lowest 0 in 2003. The trend for fatalities per 1,000 fires is declining. Compared to the Tennessee value the number of fatalities per 1,000 fire incidents is similar.Deaths per 1,000 incidents in Lebanon, TN compared to nearest cities:
(Note: Based on data for all years, including only cities with at least 2,500 fire incidents)
| Lebanon: | 2.9 |
| Murfreesboro: | 3.8 |
| Franklin: | 2.5 |
 Based on the reports from the years 2002 - 2018 the average number of fire-related yearly casualties is 1. The highest number of reported casualties - 3 took place in 2005, and the lowest - 0 in 2002. The data has a constant trend.
The average number of casualties per 1,000 fire incidents is 4. This indicator was the highest - 15 in 2005, and the lowest 0 in 2002. The trend for casualties per 1,000 fires is dropping. Compared to the Tennessee value the number of injuries per 1,000 incidents is lower.
Based on the reports from the years 2002 - 2018 the average number of fire-related yearly casualties is 1. The highest number of reported casualties - 3 took place in 2005, and the lowest - 0 in 2002. The data has a constant trend.
The average number of casualties per 1,000 fire incidents is 4. This indicator was the highest - 15 in 2005, and the lowest 0 in 2002. The trend for casualties per 1,000 fires is dropping. Compared to the Tennessee value the number of injuries per 1,000 incidents is lower.Casualties per 1,000 incidents in Lebanon, TN compared to nearest cities:
(Note: Based on data for all years, including only cities with at least 500 fire incidents)
| Lebanon: | 4.6 |
| Mount Juliet: | 12.6 |
| Watertown: | 0.0 |
| Gallatin: | 16.7 |
| Hendersonville: | 30.0 |
| La Vergne: | 3.2 |
| Smyrna: | 48.9 |
| Carthage: | 18.1 |
| Goodlettsville: | 7.5 |
 30.4% incidents where reported in the morning and 69.6% in the evening. The most fires (16.6%) took place on Saturday, and the least (12.5%) on Wednesday.
 Based on the 4,104 fires from years 2002 - 2018 most fires (10.2%) took place during March, and the least (6.9%) in May.
 Out of all 26,944 cases reported during the years 2002 - 2018, the most belonged to the categories: Rescue & EMS (51.6%), Fire (15.2%), and Good Intent Call (11.9%).
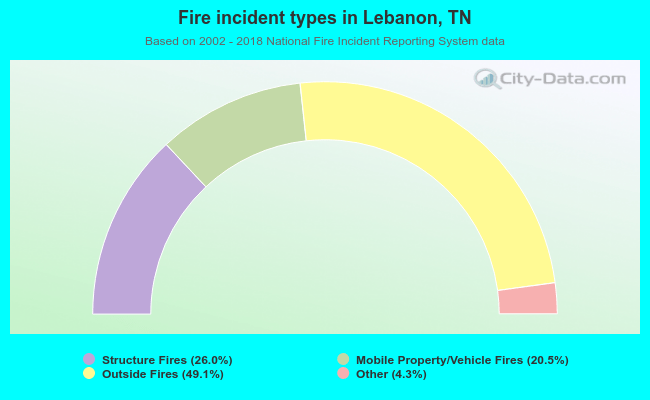 When looking into fire subcategories, the most incidents belonged to: Outside Fires (49.1%), and Structure Fires (26.0%).