Cicero: Fire Incidents, Illinois (IL)
Where are fire incidents reported in Cicero, IL
Something went wrong! Please refresh the page.
| Fire incidents reported | |
|---|---|
| Sreet name | Count |
| CICERO AVE | 444 |
| CERMAK RD | 300 |
| 48TH CT | 192 |
| 50TH AVE | 190 |
| 50TH CT | 188 |
| 59TH AVE | 172 |
| AUSTIN BLVD | 172 |
| CENTRAL AVE | 172 |
| 54TH AVE | 162 |
| 58TH AVE | 160 |
| LARAMIE AVE | 152 |
| 57TH CT | 150 |
| 61ST AVE | 150 |
| 58TH CT | 148 |
| 49TH AVE | 146 |
| 57TH AVE | 144 |
| 60TH CT | 126 |
| 61ST CT | 124 |
| 59TH CT | 122 |
| 56TH CT | 118 |
| 22ND PL | 116 |
| 51ST AVE | 116 |
| 51ST CT | 116 |
| 49TH CT | 112 |
| 23RD ST | 110 |
| ROOSEVELT RD | 110 |
| 31ST ST | 108 |
| 25TH ST | 106 |
| 55TH CT | 106 |
| OGDEN AVE | 106 |
2002 - 2018 National Fire Incident Reporting System (NFIRS) incidents
- Incident types reported to NFIRS in Cicero, IL
- 27,30471.1%Rescue & EMS
- 3,5009.1%Fire
- 3,2718.5%Hazardous Condition
- 2,0185.3%False Alarm
- 1,2793.3%Service Call
- 6041.6%Good Intent Call
- 2910.8%Special Incident
- 1090.3%Severe Weather
- Fire incident types reported to NFIRS in Cicero, IL
- 1,75550.1%Structure Fires
- 96227.5%Outside Fires
- 75921.7%Mobile Property/Vehicle Fires
- 240.7%Other
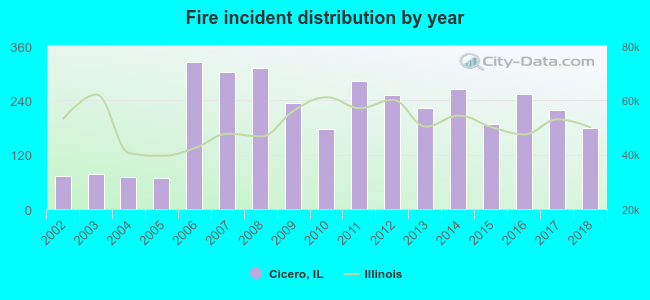 According to the data from the years 2002 - 2018 the average number of fire incidents per year is 206. The highest number of reported fires - 324 took place in 2006, and the least - 68 in 2005. The data has a growing trend.
The average number of yearly fire incidents per 10k residents in Cicero, IL compared to nearest cities:
(Note: Based on data for the last 3 years, including only cities with population 5,000 and above)
| Cicero: | 25.7 |
| Berwyn: | 23.0 |
| Stickney: | 48.4 |
| Riverside: | 20.6 |
| Oak Park: | 26.3 |
| Forest Park: | 45.8 |
| North Riverside: | 31.4 |
| Lyons: | 67.8 |
| Chicago: | 40.2 |
 The median response time based on all reported fire incidents is 3 minutes. This is lower compared to the state median value.
The median response time in Cicero, IL compared to nearest cities:
(Note: Based on data for all years, including only cities with at least 500 fire incidents)
| Cicero: | 3 minutes |
| Berwyn: | 3 minutes |
| Stickney: | 5 minutes |
| Riverside: | 6 minutes |
| Oak Park: | 5 minutes |
| Forest Park: | 5 minutes |
| Lyons: | 5 minutes |
| Chicago: | 4 minutes |
| River Forest: | 6 minutes |
 Based on the reports from the years 2002 - 2018 the average number of fire-related yearly deaths is 1. The highest number of deaths - 7 took place in 2010, and the lowest - 0 in 2004. The data has a dropping trend.
The average number of deaths per 1,000 fire incidents is 6. This indicator was the highest - 40 in 2010, and the lowest 0 in 2004. The trend for deaths per 1,000 fire incidents is declining. Compared to the state value the number of deaths per 1,000 incidents is much higher.
Based on the reports from the years 2002 - 2018 the average number of fire-related yearly deaths is 1. The highest number of deaths - 7 took place in 2010, and the lowest - 0 in 2004. The data has a dropping trend.
The average number of deaths per 1,000 fire incidents is 6. This indicator was the highest - 40 in 2010, and the lowest 0 in 2004. The trend for deaths per 1,000 fire incidents is declining. Compared to the state value the number of deaths per 1,000 incidents is much higher.
 Based on the data from the years 2002 - 2018 the average number of fire-related yearly casualties is 3. The highest number of injuries - 9 took place in 2002, and the lowest - 0 in 2005. The data has a dropping trend.
The average number of casualties per 1,000 fires is 18. This indicator was the highest - 125 in 2002, and the lowest 0 in 2005. The trend for casualties per 1,000 fires is dropping. Compared to the Illinois value the number of injuries per 1,000 incidents is higher.
Based on the data from the years 2002 - 2018 the average number of fire-related yearly casualties is 3. The highest number of injuries - 9 took place in 2002, and the lowest - 0 in 2005. The data has a dropping trend.
The average number of casualties per 1,000 fires is 18. This indicator was the highest - 125 in 2002, and the lowest 0 in 2005. The trend for casualties per 1,000 fires is dropping. Compared to the Illinois value the number of injuries per 1,000 incidents is higher.Casualties per 1,000 incidents in Cicero, IL compared to nearest cities:
(Note: Based on data for all years, including only cities with at least 500 fire incidents)
| Cicero: | 13.7 |
| Berwyn: | 15.9 |
| Stickney: | 8.8 |
| Riverside: | 11.7 |
| Oak Park: | 11.2 |
| Forest Park: | 8.3 |
| Lyons: | 15.7 |
| Chicago: | 9.7 |
| River Forest: | 5.5 |
 40.8% incidents where reported in the morning and 59.2% in the evening. The most fires (17.1%) took place on Sunday, and the least (12.2%) on Thursday.
 According to the 3,500 reports from years 2002 - 2018 most fires (11.2%) took place during July, and the least (7.1%) in February.
 Out of all 38,394 cases reported during the years 2002 - 2018, the most belonged to the categories: Rescue & EMS (71.1%), Fire (9.1%), and Hazardous Condition (8.5%).
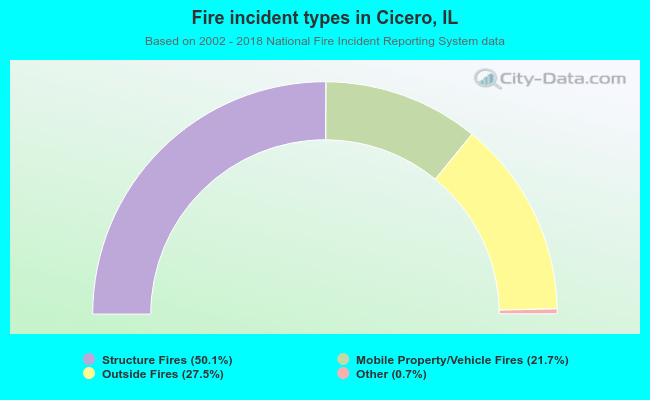 When looking into fire subcategories, the most reports belonged to: Structure Fires (50.1%), and Outside Fires (27.5%).